
5. Social Data: Where and Why
Variety’s the very spice of life, That gives it all its flavor.
—William Cowper
When you think of the word data, what comes to mind?
At a very simplistic level, data is nothing more than a collection of facts, measurements, or observations that, when combined, form or create what we might call information. At its core, data is a raw, unorganized set of facts that need to be processed into something more meaningful. A set of numbers (or data points) such as those shown in Table 5.1 is relatively meaningless until we put them into context. The numbers 45.3, 39.1, 35.9, and so on mean nothing to us until we realize (from Table 5.2) that they are measurements of temperature. So, by combining data (values in a table) with the additional contextual data that the values represent temperature, we are able to extract “information.”
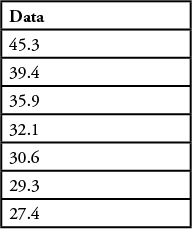
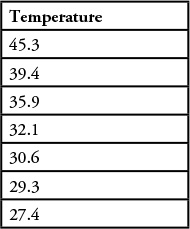
By labeling the column of data with the word Temperature, we at least have a bit of content. The numbers by themselves could represent literally anything—from distances between a specific city and nearby towns or cities, average test scores, water levels in a reservoir, or any other measurable entity.
But they’re still not useful.
![]() Are those temperatures at a specific location?
Are those temperatures at a specific location?
![]() When were the measurements taken? (At night, during the sunlit day, under water?)
When were the measurements taken? (At night, during the sunlit day, under water?)
![]() How is the temperature measured? Is it degrees Fahrenheit or Celsius, or is it measured in kelvins?
How is the temperature measured? Is it degrees Fahrenheit or Celsius, or is it measured in kelvins?
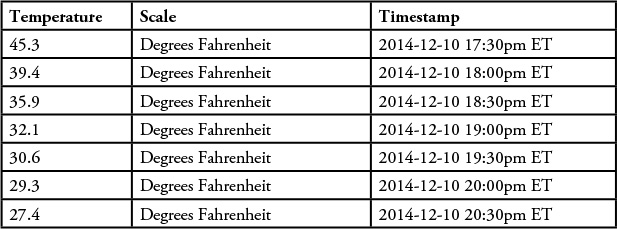
Table 5.3 provides even more context and tells us that these are observations about temperature (in degrees Fahrenheit) at various points in time on a particular day in 2014. This table now helps us realize that on the particular date in question, around 5:30 p.m. there was a sharp decrease in temperature—the derivation of a new piece of information. Each column represents a piece of data, meaningless when it stands alone but relevant when understood within a context.
Structured Data Versus Unstructured Data
Even though data comes in a variety of shapes, sizes, and forms, for the purpose of our analysis, we can think of data as coming in essentially two categories: organized and unorganized. That may be a bit of an oversimplification. A data scientist would call them structured and unstructured.
Think of structured data as data that contains a high degree of organization: We can define a data model for it and allow it to easily be placed into a database system. Once in a database, the data is readily searchable by simple, straightforward search engine mechanisms. Consider the example shown in Figure 5.1.
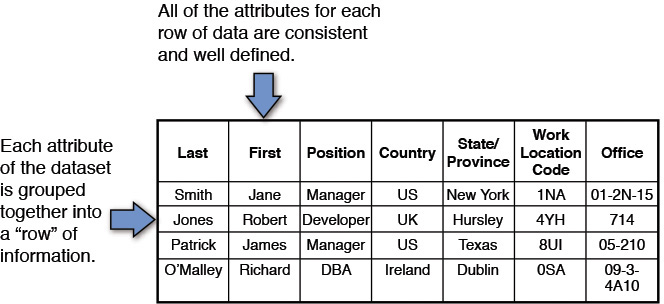
This example illustrates a table from a structured database. Each row in the column represents an observation (a specific employee), and each column is an attribute that describes the row of data (the person’s last name, position in the company, work location, and so on). We call it structured because each record or row has the same attribute. Each one can be interrogated because we know the type of data held in each attribute. For example, we know the country column has a well-known set of values, as does the work location code and position. This table can be stored in a database, so querying or evaluating the data is relatively straightforward using standard database querying tools that are available in the marketplace.
Unstructured data is essentially the opposite of structured. The lack of structure makes collecting this data a time- and energy-consuming task due to the nonuniformity of the data.
In the case of social media, the data takes the form of unstructured data, or data without a specific format. Unstructured data often includes text but more often than not can contain additional multimedia content. In the case of social media, this could include likes, URLs in messages, and pictures or references to other individuals. One contradiction to consider is that different data sources may have a specific “application structure”; that is, data from one source can all look similar (as if it was structured). But because the data that these sources contain doesn’t fit neatly into a database or across multiple applications, we still refer to it as “unstructured.” Consider the Twitter example in Figure 5.2.

While this data looks similar to that of the previous example of structured content, the real value of the Twitter data (or any other social media content) comes from an analysis of the unstructured portion of the “record,” in this case, the tweet.
Big Data
According to an article by Gil Press of Forbes [2], the first documented use of the term big data appeared in a 1997 paper by scientists from NASA, in which they were describing the problem they had with the visualization of their datasets:
[A large data set] provides an interesting challenge for computer systems: data sets are generally quite large, taxing the capacities of main memory, local disk, and even remote disk. We call this the problem of big data. When data sets do not fit in main memory (in core), or when they do not fit even on local disk, the most common solution is to acquire more resources. [3]
The term big data also appeared in a 2008 paper by Randal Bryant, Randy Katz, and Edward Lazowska that made the following bold statement:
Big-data computing is perhaps the biggest innovation in computing in the last decade. We have only begun to see its potential to collect, organize, and process data in all walks of life. [4]
There a number of definitions for big data:
“Big data is the derivation of value from traditional relational database-driven business decision making, augmented with new sources of unstructured data.” —Oracle Corporation [5]
“Big data is the term increasingly used to describe the process of applying serious computing power—the latest in machine learning and artificial intelligence—to seriously massive and often highly complex sets of information.” —Microsoft [6]
The National Institute of Standards and Technology (NIST) argues that “Big data refers to digital data volume, velocity, and/or variety that exceed the storage capacity or analysis capability of current or conventional methods and systems” (in other words, the notion of “big” is relative to the current standard of computation) [7]. No matter how we slice it or describe it, big data is the latest craze in the Information Technology industry. It’s a term (or concept) that attempts to describe the voluminous amount of data available (most likely on the Internet) that can be used to mine for information. Most pundits in the industry define big data through the use of the Three Vs: the extremely large volume of data, the wide-sweeping variety of types of data, and the various data sources and the velocity at which the data is appearing (or being created) and therefore must be processed. Others include a fourth dimension, veracity (or the quality of the data), and still others attach value as an attribute (see Figure 5.3). No matter what definition we use to describe this phenomena, it is clear that we are being inundated with data, and choosing the right data source can be crucial to a social media analytics strategy.

Social Media as Big Data
The term social media can be viewed as an umbrella term that can be used for several different venues where people connect with others directly on the Internet to communicate and exchange views and opinions or participate in any type of social commentary.
It is important to understand why people use these websites, as there is a variety of demographics represented on these sites. Some people use them for business purposes, to network, and to find new deals. Others use social networking sites for purely personal reasons and are totally oblivious to the fact that there is a business presence in the social networking environment.
Note
The content created by employees within a company while collaborating with each other in their enterprise social network is also considered social media. We cover this aspect of social media in Chapter 11.
We started with the concept of data, and through an explanation of big data and unstructured data, we have described what social media data is. Before we get into the analysis aspects in future chapters, we want to explore why social media is such an important media to focus on.
Social media has gained in acceptance over the past few years for a number of reasons. We can point to the growth of the Internet and the concept of information sharing and dissemination. Humans, by their very nature, are naturally social and want to share what they know. Add to that the incredible growth of smart phones and mobile technologies such that we, as a society, have truly reached an “always on” culture—and it’s no wonder we see a growth in social and community sites.
But what are people actually doing on these sites? Why do they bother?
In looking at a report by Anita Whiting and David Williams [9], we can see a number of reasons that Internet users participate in social media, as covered in the following sections.
Social for Social’s Sake
While not in any particular order, the concept of participating on these sites can purely be for the social aspect of meeting new acquaintances and staying in touch with older ones. In our opinion, this is the primary reason for the rapid growth of sites like Facebook. The ability to allow others to share in our daily lives and stay abreast of our every move has a certain appeal and perhaps gives us a sense of community. In the same vein, we tend to be curious by nature, and through the windows of social media, we are able to see into the lives of others, perhaps living vicariously through them or just building a bond as we stay “in” each other’s lives.
Social Media as Entertainment
Many people report that the use of social media is a way to unwind, to pass time, or just relax with others via the electronic highways of the Internet. Given that many of these social sites not only provide for the sharing of information in the form of pictures, short updates, and even longer blog-like postings, they also foster gaming, either with others in an immediate network or individuals. Through the use of games, many social media providers hope to keep participants coming back for more—and they obviously do. Many people simply look for relaxation or ways to alleviate stress and escape from reality, even if just for a little while.
Social Media as Sharing
Apart from socializing with others, we also like to share what we know with others or seek the advice of others when or if we have questions of our own. Not only that, but we do like to share our opinions and experiences with others in the hope of influencing them or perhaps steering them away from bad experiences. Social media can be a valuable tool, put in the hands of individuals, in a quest to spread praise or criticism of products or services.
In the case of blogging, millions of people are making their voices heard. The Internet has drastically changed how we, as individuals, can reach out to others. Never before has it been so easy to be able to reach a global audience with so little effort. Today, bloggers have the opportunity of reaching hundreds or even thousands of people every day and spreading their stories, opinions, and values. For individuals, there is a benefit of building their personal brand.
Think of this as Consumer Reports for individuals. From it own website, Consumer Reports defines itself like this:
Consumer Reports has empowered consumers with the knowledge they need to make better and more informed choices—and has battled in the public and private sectors for safer products and fair market practices. [10]
How do writers at Consumer Reports form their opinions? Through their own independent tests and evaluations, which then get reported to individuals. It’s not unlike posting a request for a local restaurant review on Facebook or Twitter and then making an informed decision based on what others have to say.
Now, to be fair, this is where the V for veracity comes in (and perhaps some pessimistic individuals). Obviously, there are those who will believe that since we can’t ensure an unbiased review, how do we know we can “trust” the opinions or thoughts espoused on social media sites? Well, the short answer is: we don’t. But if we see enough positive reviews versus negative reviews, we’re likely to be swayed (obviously one way or the other).
Where to Look for Big Data
The next question, then, is Where do we look for big data?
There are large number of conversational sites on the Internet where even larger varieties of conversations are happening. Knowing where to look or what conversations to watch for can be a daunting task. Conversations can (and do) happen everywhere. They obviously occur in social media sites, but conversations and opinions are often found in comments made to news stories, online retail stores, obituary sites—virtually everywhere on the Internet. It’s easy to get lost in the sea of sites when trying to collate all of this information. Often, organizations merge enterprise data with social data, linking together employees and their social commentary or product schedules and announcements with public discussions around the products. This can only compound the issue of trying to find the “right” conversations to analyze. While we acknowledge this is being done and it makes “big data” even bigger, within the context of this book, we don’t address the additional issues of expanding the datasets’ size by augmenting with additional data. This brings us to the next question: Which data source is right for my project?
Paradox of Choice: Sifting Through Big Data
In his book The Paradox of Choice: Why More Is Less, American psychologist Barry Schwartz purports that eliminating consumer choices can greatly reduce anxiety that many shoppers feel [11]. The idea that we have so many choices in life can actually cause us stress (stress over “Did I pick the right one?” or “Will this other option last longer?” and so on). According to The Paradox of Choice, when it comes to buying any kind of item, from a box of cereal to a new car, we have trouble making decisions. What’s interesting is the fact that too much choice is actually harmful to our well-being. When there are too many options, we suffer, believing our choice is flawed or that we could have made a better one in the long run.
This suffering is the paradox of choice, and it describes how we become less satisfied the more choices there are. We bring up this topic not to discuss our buying habits, but to point out a similar situation in choosing where to look for the social media data that we would like to analyze.
Consider the graph in Figure 5.4. Here, we graph the number of users reporting to be registered in some of the more popular social media sites available on the Internet. We’ve taken just a snapshot of the more popular sites; it would be nearly impossible to show them all—partially because social media sites come and go and some might not be identified as traditional “social media” sites, so we don’t know about them [12].
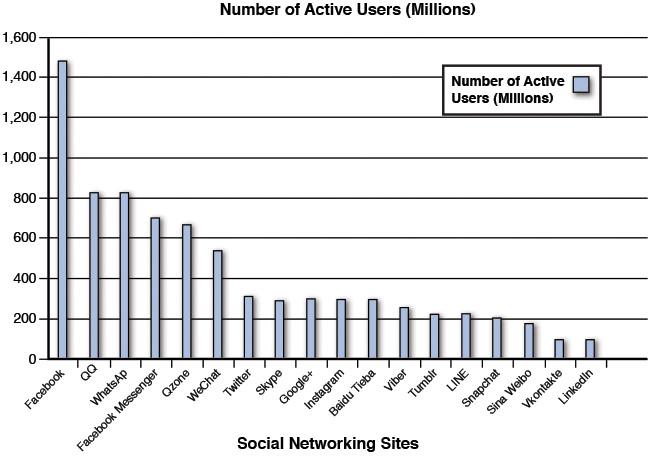
The question, however, remains: Which sites should we gather data from for our analysis?
The leader of social media content is clearly Facebook, which boasts of over 1.5 billion registered users at the time we wrote this chapter [13]. So the question analysts have to ask themselves is: Can I use data from just Facebook and ignore the rest? The short answer is no. To obtain a well-rounded opinion, we want to have as much relevant data as possible. So again, looking at the graph in Figure 5.4, we probably should focus on sites from Facebook to Baidu Tieba (or maybe Tumblr). But why not all of them? Where do we (or should we) stop?
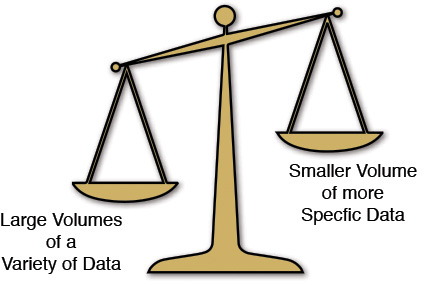
On one hand, when we hear about big data, we immediately think of sifting through tremendous amounts of data, distilling it down to its bare essence, revealing some golden nuggets of truth. In some cases, this may be true, but in practice, we have found that as the amount of data rises, so does the noise in the data. An electrical engineer refers to this as the signal-to-noise ratio—or how much “relevant” information there is in a sample versus how much “noise,” or nonrelevant information (see Figure 5.5).
As a case in point, consider one analysis we were involved in during our early days here. We were approached by one of our internal divisions and asked for an analysis of IBM’s BladeCenter product against its competitors. We were asked to look at this from a number of different angles including the sentiments toward/against IBM’s product, the sentiment around its competitors, the trends over time, the topics of conversation, and even where, within the social media space, the conversations about the product were occurring most.
For this analysis, we ingested as much “relevant” data as we could find into our analytics tool and began the analysis. In one instance, we discovered one particular venue (social media site) where the discussions about BladeCenter were far outpacing the others (see Figure 5.6).
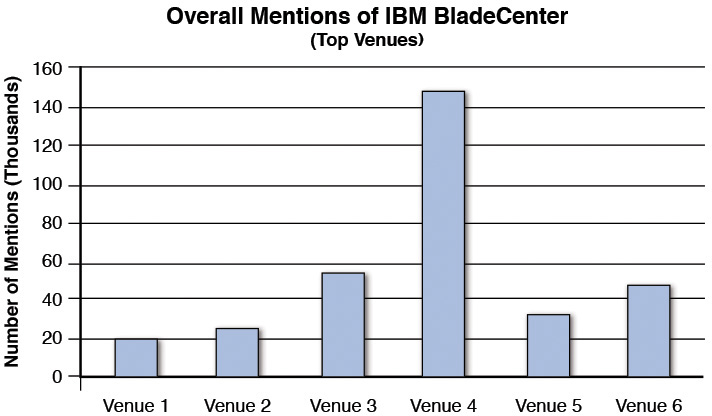
The interesting thing about that site is that it was a gaming site where users discuss various ins and outs of gaming: running sites, playing games, deploying strategies, and so on. This led to the (false) conclusion that the BladeCenter product was used heavily as a gaming platform, so we continue to “drill” into the specifics from that site.
Well, as any good data scientist will tell you: Your results are only as good as your data.
As we looked closer, it became apparent that the discussion on that social media site was indeed about Blades, but it wasn’t a computer; it was a character in one particular game that was very popular. In other words, all of that conversation was completely irrelevant to our topic! In that particular case, we ensured that our data collection avoided gaming sites to make sure we had the correct data. Issues like these are usually picked up in the first few iterations of analysis, which is an essential part of the process. We highlight this point here for you as an issue to be aware of as you do a similar analysis on your own.
Of course, the obvious question is: What if there was substantial discussion on these gaming sites of the BladeCenter product? It would have meant a much more sophisticated data model that ensured any discussion of BladeCenter was in the context of computing (or perhaps cloud computing), but in this case, the easiest solution was to simply remove the data source.
In another case, we were looking at what kinds of issues or topics were being talked about during the SapphireNow conference (http://events.sap.com/sapphirenow/en/home) a few years ago. We got some really interesting information, but at first we started to see several conversations surrounding mixed drinks (cocktails). A careful inspection revealed we were seeing discussions (and advertisements) for Bombay’s Sapphire Gin—completely unrelated to the IT conference we were interested in observing.
These examples illustrate what we mean by “scoping.” The concept of scoping a data collection simply means to set a boundary within which we want to collect data. In the case of SapphireNow, we wanted to scope the collection of an mentions of the word sapphire to computer- or software-related issues rather than allow it to be wide open to anything.
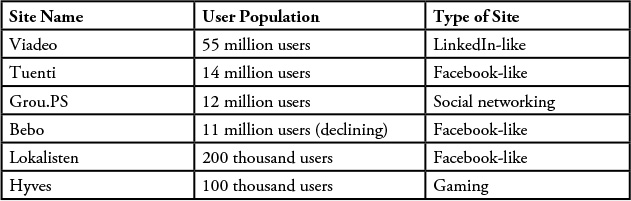
Identifying Data in Social Media Outlets
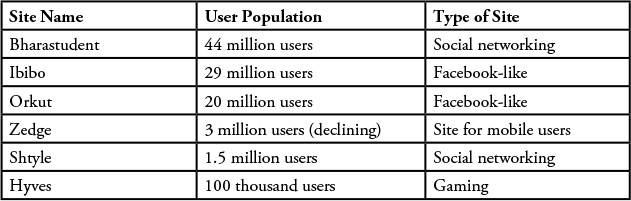
When we talk about social media sites, we often have to be clear what type of data we would gather. It’s important to understand how people interact on the site and how they exchange information with one another. In this section, we primarily discuss the sites that are most relevant in the United States. There are too many social media sites and venues to dive into the demographics of all of them. But it is useful to understand where we can go to find information from a specific region or demographic. The following tables provide a glimpse of the social media outlets for China (see Table 5.4), Europe (see Table 5.5), and India (see Table 5.6) [14].

Professional Networking Sites
Professional networking sites are just that: social networking sites where business professionals can go to meet or find others with similar interests or just stay connected with business contacts, all with a goal of building up a professional network. They are rich in profiling information such as education level, job history, and current position within companies. These sites often allow the users to be “introduced to” and collaborate with other professionals in an effort to enhance or improve their professional stature. LinkedIn is the dominant professional social network. It has become the de facto system of record for online résumés for many professionals. Want to hear what business professionals are saying about a topic? Look to LinkedIn (or other professional networking sites).
Demographics [15]:
![]() North America: 119 million
North America: 119 million
![]() Europe: 78 million
Europe: 78 million
![]() Asia: 52 million
Asia: 52 million
![]() South America: 46 million
South America: 46 million
![]() Africa: 15 million
Africa: 15 million
![]() Middle East: 11 million
Middle East: 11 million
![]() Oceania: 8 million
Oceania: 8 million
LinkedIn is an online social network that was designed for business professionals. Because of this distinction, it tends to be different from other social networking sites such as Facebook or RenRen. LinkedIn users are looking to build or enhance their professional network. They are looking for or posting job opportunities, discovering sales leads, or connecting with potential business partners—rather than simply making friends or sharing content.
LinkedIn profiles are more like professional résumés with a focus on employment and education history. Like Facebook users, LinkedIn users are part of “invited networks” (in Facebook, users have “friends”; in LinkedIn, they are part of a network). Based on work history and education background (from a profile), LinkedIn can help identify others that (potentially) have similar interests or backgrounds to invite into your network. On LinkedIn, the people who are part of your network are called your “connections.” A connection implies that you know the person well or that it is a trusted business.
Generally, user profiles are fully visible to all LinkedIn members who have signed into the site; all of this is configurable within LinkedIn. Typically, contact information such as email, phone number, and physical address is visible only to first-degree connections and members (those you have in your network). Users can control the visibility of their posts and other recent activity by adjusting their visibility settings, and most allow their comments/posts to be seen only within their networks.
Since LinkedIn does tend to be more professional networking, it’s not clear that sentiment would be all that valuable. If users are on LinkedIn to potentially connect with future employers (or employers are looking for new employees), most of these users tend to be careful about what they say.
Social Sites
Classifying a social media site as social seems a bit redundant, but in this instance, we’re referring to sites where people go to reconnect with old friends or meet new people with similar interests and hobbies. These sites enable users to create public profiles and form relationships with other users of the same website who access their profiles. These sites offer online discussion forums, chat rooms, status updates, as well as content sharing (such as pictures or videos). The king of social sites has to be Facebook with over 1.5 billion registered users [15]!
User population: 1.5 billion registered users
Demographics [16]:
![]() 171 million users from the United States
171 million users from the United States
![]() 66 million users from India
66 million users from India
![]() 60 million users from Brazil
60 million users from Brazil
![]() 54 million users from Indonesia
54 million users from Indonesia
![]() 41 million users from Mexico
41 million users from Mexico
![]() 35 million users from Turkey
35 million users from Turkey
![]() 34 million users from Phillipines
34 million users from Phillipines
Facebook is the king of social media sites, claiming the largest number of registered and active users of all such sites. At first blush, this would seem like a goldmine for gathering data for a social media analysis, but in actuality it’s not as useful, from a business perspective, as you would think.
Facebook is organized around a timeline, the things users say or post, and their friends. When users post something, typically the only ones who can see the content are those in that user’s list of friends. That capability is wonderful for sharing information within a community of friends, but from the perspective of trying to look at public opinion or thoughts, these posts or timelines aren’t available to the general public. While it is possible to set user controls to make all content publicly accessible, this setting is not generally used because most users want to keep their comments and conversations private, or within their own circles.
One alternative to the more private profile is a fan page. Businesses, organizations, celebrities, and political figures use fan pages to represent themselves to the public on Facebook. Unlike regular Facebook profiles and content, fan pages are visible to everybody on the Internet, which makes for a useful set of information to collect and analyze.
Facebook groups enable communication among a group of people to share common interests and express their opinions. Groups allow people to come together around a common topic to post and share content. When creating such a group, the owner can choose to make the group publicly available or private to members, but members must be Facebook users.
RenRen [17]
User population: 219 million users in 2014
Demographics: Predominantly Chinese
RenRen is the leading (real-name) social networking Internet platform in China. RenRen, which means “everyone” in Chinese, enables users to connect and communicate with each other, share information, create user-generated content, play online games, watch videos, and enjoy a wide range of other features and services. Most people refer to RenRen as the Chinese Facebook. Like Facebook, RenRen does not allow visitors or search engine spiders to view profile pages without being logged in (in other words, being a member). Of course, like Facebook, it does allow searching for public profile pages of brands and celebrities.
Information Sharing Sites
Most of the social media sites allowing sharing of status messages or content such as pictures or videos. Some, however, like Instagram, are almost solely focused on sharing (in this case, images). Other examples include sites like YouTube and Tumblr, and while they allow for commentary on the content posted, they are primarily content sharing.
YouTube
User population: 1 billion users
YouTube is a website that was designed to enable the general public to share video content. Millions of users around the world have created accounts and uploaded videos that anyone can watch—anytime and virtually anywhere.
Many businesses today have come to realize that the use of YouTube videos can help to increase their brand exposure while creating a personal connection with their audience. More importantly, these short videos can be an effective way to deliver information that users may find useful—perhaps leading to an increased brand loyalty.
What’s most important is the number of views that videos achieve from the YouTube site. Looking at the top 10 countries viewing videos [18], we see:
![]() United States: 124 billion views
United States: 124 billion views
![]() UK: 34 billion
UK: 34 billion
![]() India: 15 billion
India: 15 billion
![]() Germany: 15 billion
Germany: 15 billion
![]() Canada: 14 billion
Canada: 14 billion
![]() France: 13 billion
France: 13 billion
![]() South Korea: 12 billion
South Korea: 12 billion
![]() Russia: 11 billion
Russia: 11 billion
![]() Japan: 11 billion
Japan: 11 billion
![]() Brazil: 10 billion
Brazil: 10 billion
Video files can be very large and are often too big to send to someone else by email. By posting a video on YouTube, users can share a video simply by sending the other person a URL link.
Microblogging Sites
Microblogs are short postings or brief updates sent online. Think of them like text messaging. Unlike traditional blogs, microblogs are typically limited in the amount of text that can be posted (Twitter’s limit is 140 characters). These updates often contain links to online resources, such as web pages, images, or videos, and more often than not, they refer to other users (called mentions). As is the case with most microblogging, when a message is posted, those updates are seen by all users who have chosen to “follow” the author who posted the message (submitter). In the case of Twitter, those posts are all public; you may not receive them if you don’t follow the submitter, but you can search for a keyword or topic and find someone who is talking about a specific subject (and then perhaps follow that person if he or she seems interesting). Microblogging should not be confused with text messaging (or texting) on mobile phones, which is private and not recorded anywhere. Texting is typically one-to-one (or in the hybrid case, group chats among a small number of people).
Demographics:
![]() 180 million from the United States
180 million from the United States
![]() 23 million from the UK
23 million from the UK
![]() 16 million from Canada
16 million from Canada
![]() 8 million from Australia
8 million from Australia
![]() 6 million from Brazil
6 million from Brazil
![]() 4 million from India
4 million from India
Twitter is the prototypical microblogging site. Users tweet using short bursts of messages out to the Twitterverse with the hope that their messages will be useful or interesting to others. Messages on Twitter, by definition, are limited to 140 characters, so they tend to be statements as opposed to conversations. There are threads of conversation where users reply to other tweets, but more often than not, we tend to see more retweeting of messages. This behavior can be viewed as an implicit agreement with the originator’s view.
One of the draws of Twitter is the instantaneous delivery (and reception) of messages and information. Many people tweet about current events that are underway, during sporting events or talks at trade shows, for example. All of these message can be immensely important when trying to understand conditions surrounding an event in real time. From a historical perspective, looking back at tweets (or sentiment) when an event occurred (understanding the event in hindsight) can be particularly useful in trying to predict reactions to future events.
Blogs/Wikis
A blog is nothing more than an online personal journal or diary. It provides a platform for people to express themselves and their opinions. It is a place to share thoughts and passions. The Internet makes this information dissemination that much easier. In earlier days, someone with a strong opinion would stand on a raised platform (typically a box meant for holding soap) in a public square and make an impromptu speech, often about politics, but it could be about anything. Hyde Park in London is known for its Sunday soapbox orators, who have assembled at Speakers’ Corner since 1872 to allow individuals to discuss any number of topics ranging from religion and politics to social themes. The modern form of this soapbox is a blog, which allows anyone, anywhere, to make a statement that can be heard by all (or ignored by many).
Blogs can range from personal experiences and observations to well-crafted marketing messages put out, seemingly, by individuals on the behalf of corporations. Of course, this is true for any form of social media. And as with any media, being sure to determine who is conveying the opinions and message is important.
Summary
As we have seen in this chapter, data can come in a number of different forms and from a wide variety of sources. Given the unstructured nature of social media content and the large number of possible sources, each requiring a unique analysis methodology, the complexity of this type of data can be overwhelming at times. The trick is to be able to understand what is being said in the unstructured content and to look for patterns (repetition of themes, sentiment, or perhaps customer satisfaction issues). We briefly touched on these concerns here but deal with them at length in Chapter 7. Once it is understood, we can process this data as if it’s one large set of structured data, using standard relational queries and well-known techniques.
Endnotes
[1] Cowper, William, The Task and Other Poems, Published by David Huntington, 1814.
[2] Press, Gil, “12 Big Data Definitions: What’s Yours?” Forbes. Retrieved from http://www.forbes.com/sites/gilpress/2014/09/03/12-big-data-definitions-whats-yours/.
[3] IEEE Computer Society Press, Proceedings of the 8th Conference on Visualization ’97 (Los Alamitos, CA: Author, 1998), 235-ff.
[4] Bryant, Randal, Randy H. Katz, and Edward D. Lazowska, “Big-Data Computing: Creating Revolutionary Breakthroughs in Commerce, Science and Society.” Computing Community Consortium, December 22, 2008. Retrieved from http://cra.org/ccc/wp-content/uploads/sites/2/2015/05/Big_Data.pdf.
[5] See http://www.ecampusnews.com/top-news/big-data-definition-224/.
[6] See https://news.microsoft.com/2013/02/11/the-big-bang-how-the-big-data-explosion-is-changing-the-world/.
[7] NIST Big Data Definitions and Taxonomies, Version 1.0, Definitions & Taxonomies Subgroup, NIST Big Data Working Group (NBD-WG) August, 2013.
[8] See https://en.wikipedia.org/wiki/Big_data.
[9] Whiting, Anita, and David Williams, “Why People Use Social Media: A Uses and Gratifications Approach,” Qualitative Market Research: An International Journal 16.4 (2013): 362–369.
[10] Consumer Reports. Retrieved from http://www.consumerreports.org/cro/about-us/index.htm.
[11] Schwartz, Barry, The Paradox of Choice: Why More Is Less, Harper Collins Publishers, 2004.
[12] Statista, “Leading Social Networks Worldwide as of August 2015, Ranked by Number of Active Users (In Millions).” Retrieved from http://www.statista.com/statistics/272014/global-social-networks-ranked-by-number-of-users/.
[13] Carrasco, Ed, “The Top 10 Countries in YouTube Viewership Outside the USA [INFOGRAPHIC],” New Media Rockstars, March 18, 2013. Retrieved from http://newmediarockstars.com/2013/03/the-top-10-countries-in-youtube-viewership-outside-the-usa-infographic/.
[14] Kemp, Simon, “Digital, Social & Mobile Worldwide in 2015.” We Are Social, January 21, 2015. Retrieved from http://wearesocial.net/blog/2015/01/digital-social-mobile-worldwide-2015/.
[15] Techner, Isobel, Blog, LinkedIn Usage By Country 2014, http://linkhumans.com/blog/linkedin-usage-2014.
[16] See http://worldknowing.com/top-10-most-facebook-user-country-in-the-world/.
[17] See http://www.chinainternetwatch.com/10928/renren-q3-2014/.
[18] See http://sysomos.com/sites/default/files/Inside-Twitter-BySysomos.pdf.