
7. Reading Tea Leaves: Discovering Themes, Topics, or Trends
In wisdom gathered over time I have found that every experience is a form of exploration.
—Ansel Adams [1]
Discovering themes and patterns from social media content can be a very exciting endeavor. This is the part of analysis where the detective in the analyst really comes out. This chapter focuses on the common goals of a majority of social data analysis projects. These goals fall into two broad categories: validation of hypothesis and discovery of themes. In the first category, the researcher already has a hypothesis (a prediction of what the likely outcome will be) in mind that he or she wants to validate. In the second major category, discovering themes or topics or trends, there is no preconceived notion of what the researcher is likely to find. The analyst begins the analysis with an open mind and attempts to discover what the data is implying either in terms of definitive insights or answers to specific questions, or in terms of the trends being implied by the underlying data. Here, we discuss the analysis steps that are typically taken to satisfy these goals in the context of some specific project examples.
Many social media analysis projects require an iterative approach. We have made reference to this approach throughout this book, and we refer to it in this chapter also. Toward the end of this chapter, we have included a discussion of iterative methods and how we recommend applying this method for social media analysis projects.
Validating the Hypothesis
Many social media analytics projects start with some preconceived idea of the results or insights they are expecting to find. With that as a starting point, the analyst identifies the appropriate datasets and performs analysis iteratively to arrive at the conclusion. At the end, the results might either confirm the hypothesis or reject it. It is possible that an analysis may end up with inconclusive evidence, so the analyst may have to refine the approach and try again. In the following sections, we look at a few examples and describe the process end-to-end to highlight the specific steps that need to be taken.
We discuss three specific examples:
![]() Youth unemployment—In this example, we describe a project that we executed for a marketing team in Europe. The subject was youth unemployment in Europe. The hypothesis was that we would be able to find evidence in social media to support the conclusions being reported by official government reports.
Youth unemployment—In this example, we describe a project that we executed for a marketing team in Europe. The subject was youth unemployment in Europe. The hypothesis was that we would be able to find evidence in social media to support the conclusions being reported by official government reports.
![]() Cannes Lions 2013—In this example, we describe a project that we executed for a marketing team in the United States. The hypothesis was that a very popular movie in general media would win an award in this competition.
Cannes Lions 2013—In this example, we describe a project that we executed for a marketing team in the United States. The hypothesis was that a very popular movie in general media would win an award in this competition.
![]() 56th Grammy Awards—In this example, we describe a project that the social media analytics team executed as an experiment to test the hypothesis that social media chatter could give very effective clues about who would ultimately win an award.
56th Grammy Awards—In this example, we describe a project that the social media analytics team executed as an experiment to test the hypothesis that social media chatter could give very effective clues about who would ultimately win an award.
Youth Unemployment
A marketing team in Europe contracted our IBM social media analytics team to see if social media analysis could be used to confirm or deny youth unemployment in Europe. At the time of this project, the topic of youth unemployment in Europe was dominating the news media. The IBM marketing team was interested in exploring the benefits of IBM’s social media analysis tools and techniques in an effort to see what could be uncovered in this space. The theory was that if our team could identify some insights by just using data that is freely available (social media content), it could be used in a case study discussing product or service opportunities with some of our government clients in Europe. The hypothesis was that there would be a sufficient amount of chatter across the social media sites to corroborate the reports that were being generated by the official channels in the countries being severely affected by this problem. As we have discussed before, these projects required an iterative analysis. Based on this concept, our approach for this project included the following steps:
1. Identify the relevant data sources.
2. Develop or modify a set of keywords to bring in the most appropriate data from these sources.
3. Develop or modify a model to classify and categorize the information.
4. Evaluate the results.
5. If the results are satisfactory, the project concludes. If not, we go back to step 2 and iterate.
Data Identification and Data Analysis
Given that this project focused on the views of Europeans, we needed to look at all of the social media content originating in those countries. With location as the first filter, we needed to identify content that matched a known set of keywords that would indicate discussion around the term youth unemployment. We utilized the service of a data aggregator called Boardreader to search and discover social media content matching our keywords. We started with an initial set of keywords based on input from the marketing team and the judgment and experience of our lead analyst, Mila Gessner [2].
From a data identification perspective, we came up with a list of countries that we needed to focus on: Spain, Italy, Ireland, France, Portugal, and Slovakia. We configured the data identification tool to select content from these countries.
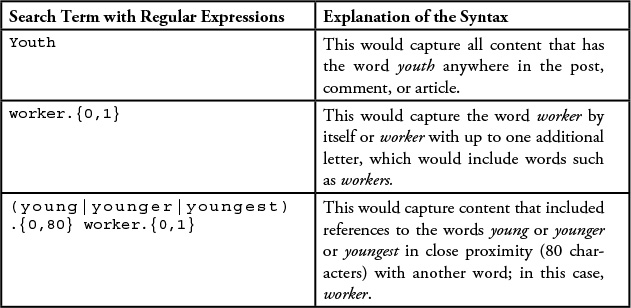
We then needed to come up with an initial set of keywords that we were going to use to pull in content from the social media universe: youth, unemployment. We configured the analysis tool to focus on search keywords like youth, young, and teen. We used regular expressions to ensure all variations of these terms were captured and included in our data model. In Chapter 2, we discussed the method of using regular expressions to “cleanse” the data, or to limit that data that we collected for further analysis. We demonstrate a few more examples of regular expressions here. See Table 7.1.
The tool also allows the analyst to specify related context keywords, ensuring that only content relevant to the project is included. For example, in our initial model, we used context keywords such as unemployment and unemployed. This ensured that we captured all conversations that referenced young people but within the context of talking about topics of “unemployed” or “unemployment.”
We took the results of this phase forward and conducted our analysis. For the sake of discussion, let’s call this iteration 1. We quickly learned that we were missing much of the relevant content because our search keywords were too limiting. For example, we learned that we needed to add the word graduates to our mix (implications of being young). We also learned that we needed to add a few additional context keywords like jobless and out of work.
During this phase, we also learned that quite a bit of irrelevant content was being captured in the model. The analysis tools allowed us to exclude that irrelevant content by using “exclude” keywords, or keywords that, when found, cause the content to be ignored. As a result, in the next iteration, we used exclude keywords such as movie, cricket, and world war to eliminate content that perhaps matched our keywords and context words but was not relevant for our analysis.
We hope this discussion gives you an indication of how a typical analysis phase, with multiple iterations, is executed on projects. Rarely does a first attempt work without any changes to the model or collection.
Here, we have reproduced the final model at the conclusion of this project.
EU, Spain, Italy, Ireland, France, Portugal, Slovakia
Keywords:
youth
grads
graduates
(young|younger|youngest) .{0,80} worker.{0,1}
worker.{0,1} .{0,80} (young|younger|youngest)
(young|younger|youngest) .{0,80} (adult|adults)
(adult|adults) .{0,80} (young|younger)
youngsters
(young|younger|youngest) (worker|generation|people|folks|individual
s|citizens|adult|adults).{0,1}
(young|younger|youngest) .{0,80} generation.{0,1}
generation.{0,1} .{0,80} (young|younger|youngest)
(young|younger|youngest) .{0,80} people.{0,1}
people.{0,1} .{0,80} (young|younger|youngest)
(young|younger|youngest) .{0,80} folks
folks .{0,80} (young|younger|youngest)
(young|younger|youngest) .{0,80} individuals
individuals .{0,80} (young|younger|youngest)
(young|younger|youngest) .{0,80} citizens
citizens .{0,80} (young|younger|youngest)
Context terms for keywords:
unemployment
unemployed
jobless
joblessness
not employed
(looking|searching) for work
(looking|searching) for job.{0,1}
no job.{0,1}
no employment
without employment
without job.{0,1}
unwaged
out-of-work
out of work
between jobs
(looking|searching) for .{10} work
(looking|searching) for .{10} job.{0,1}
without work
Exclude keywords:
Cypriot
prophet
World War.{0,3}
Stalin
Holy Roman Empire
mortgage.{0,1}
obesity
gay.{0,5}marriage.{0,1}
football
Pistorius.{0,2}
soccer
horse.{0,5}
.{0,1}baseball.{0,3}
fashion.{0,20}week
topless
Vatican
marathon.{0,2}
league.{0,1}
Pope
film
drone strike.{0,1}
drone.{0,1}
movie
cartoon
{0,1}World.{0,1}Cup.{0,1}
mandela
Cricket.{0,1}
Once the model is ready, then we need to look at the results to see if they are ready for interpretation. One common issue that we run into in projects like this is called “duplicates.” A particular piece of content may be referenced in different social media venues by different sets of people. We typically have to weed out these duplicates to ensure clean analysis.
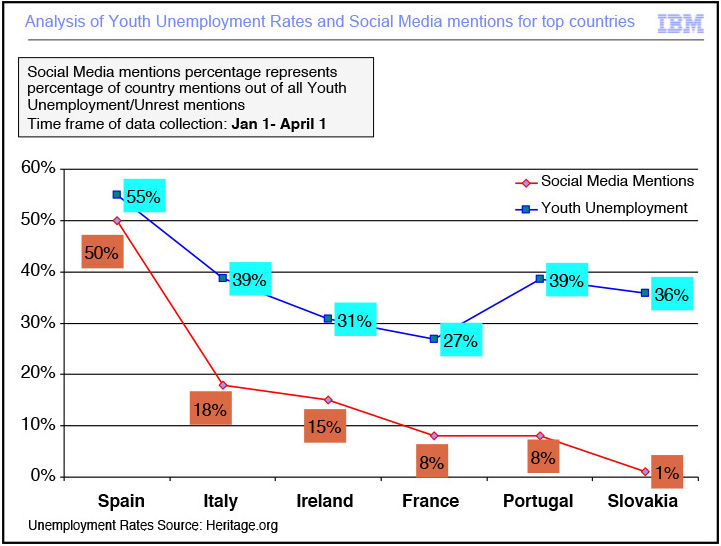
Based on the amount of content we were obtaining from our aggregator, we decided to limit the analysis to a duration of three months (January to March 2013). At the end of this phase, we identified a number of qualified mentions about youth unemployment from a number of European countries. These mentions were then ranked by the countries that showed evidence of high incidence of youth unemployment. We then compared this data with official unemployment data published in Europe by the Heritage Foundation.
The results are shown in Figure 7.1.
Results
From this analysis, we were able to conclude that indeed there was a strong correlation between countries with high levels of youth unemployment and the chatter related to youth unemployment in social media venues.
This use case is an example of validating a predetermined hypothesis. In this particular case, we were able to confirm the hypothesis.
So what’s the big deal?
That’s a good question. Just because we’ve shown a relationship exists between the social media postings of unemployed youth and the real unemployment number doesn’t really answer any questions for us (or quite honestly, provide any business value on its own).
The important thing is that we have shown we have a working model that would contain social comments made by individuals who are unemployed. So if we want to target them in marketing campaigns, blogs, or social media, we can use this model to understand the issues concerning them, such as education, health care, cost of living, and so on.
This is the point where there is a close tie between social media analytics and marketing. Let’s assume that a company that provides higher education services is looking at this data during some of its decision-making processes. If that company is trying to get members of this segment to consider educational classes or additional education, it launches a marketing campaign. Using the concepts in this model, it could perform a before-and-after analysis to understand if its marketing message made any inroads into the community. It could also determine if its message is having a positive (or negative) effect on its intended audience. The point is that the company now has a tool to measure the pulse or general feeling of a particular segment. As we said before: knowledge is power.
Cannes Lions 2013
The IBM Social Analytics team was again contacted by the IBM Marketing team to do some social media analysis around the Cannes Lions 2013 event. This is an event that honors and celebrates creativity in media. During this time, an IBM movie called A Boy and His Atom was creating quite a stir in the media. We were approached to see if we could determine how popular this movie was when compared to other campaigns that were receiving a similar buzz at the festival.
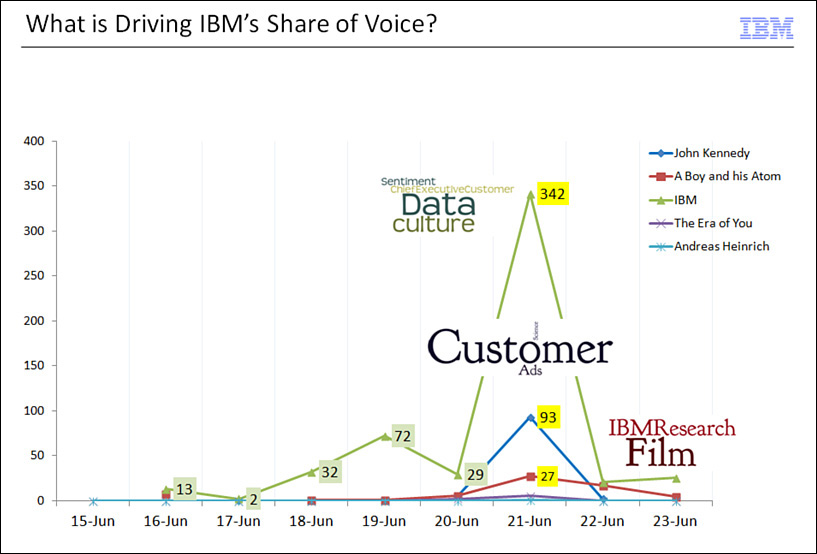
Since this was a real-time event, we built a model analyzing Twitter data that was being generated during the event. We first noticed that A Boy and His Atom was receiving mentions (27 to be precise) in the context of IBM (342 total mentions). To us, this meant that the movie was clearly being noticed and being talked about in the context of technology companies (in this case, IBM). See Figure 7.2.
Next, we compared the mentions of this movie as compared to others in the same category, and we realized that it was nowhere in the top (see Figure 7.3).
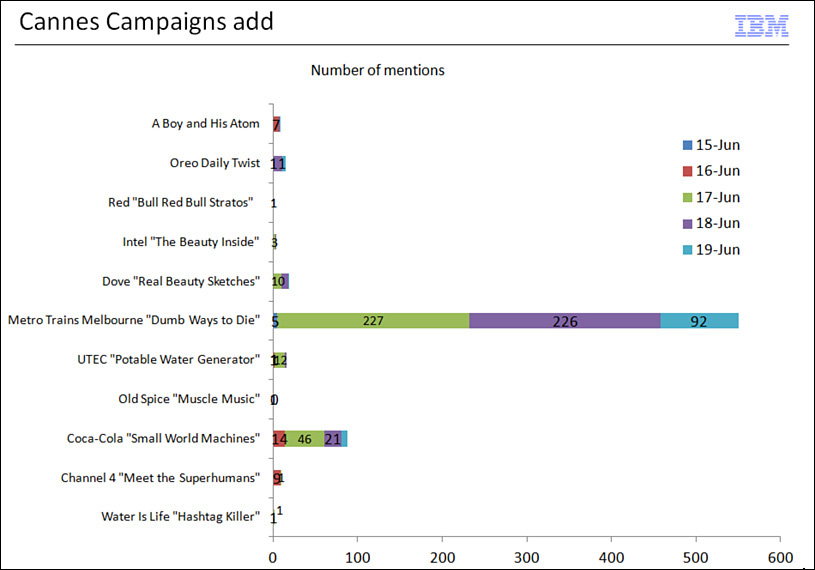
So, the conclusion at this point was that our hypothesis was rejected. There was clearly a lot of external media buzz about this particular movie, but other movies in the category had many more mentions within social media channels.
We’ve seen this scenario time and time again: a topic is discovered in an analysis, and we assume that it is relevant based on the frequency of use. But what always has to be considered is the context in which that topic is discussed. So naturally, when users of social media were referencing the movie A Boy and His Atom, they probably posted something like this:
Check out IBM’s “A boy and his atom”—a great piece of work.
So the movie was discussed in the context of IBM (in other words, when we looked for mentions of the word IBM, we also found discussion about this movie). This is logical and makes perfect sense. But what that means is that in the context of movies, it gained far less traction (and perhaps appeal).
56th Grammy Awards
In 2013, we challenged our social media analytics team to see if they could use the tools available to predict the winners in Grammy awards based on chatter in social media.
Hypothesis: There is a correlation between the number of mentions (and positive sentiment) in social media about an artist and the fact that he or she won.
Table 7.2 shows some sample categories and the nominations in those categories.
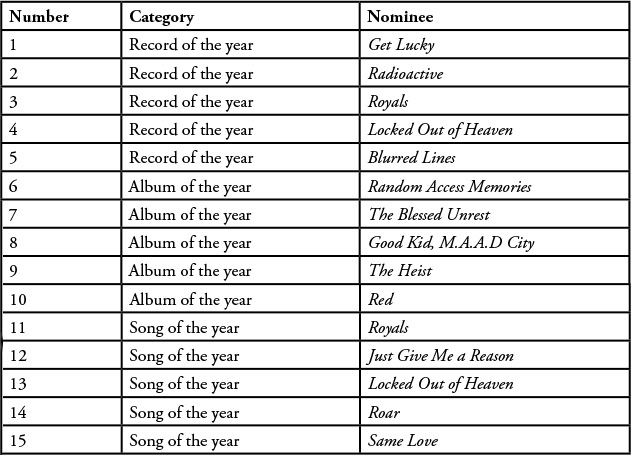
We analyzed content in social media and public media up to one month prior to the day of awards. About 81 categories were identified. There were an average of 5 nominations in each category.
We captured mentions about each category and each person nominated. We then tabulated the winners that were determined purely by number of mentions in social media. We compared this list with the eventual winners. We observed that in 62 out of the 81 categories (77%), the eventual winner was in the top three list based on social media mentions. We concluded that in a majority of cases, the winners identified by social media analysis prior to the actual announcement were in the top three of the actual winners.
So, what is the business value of this experiment?
The first important lesson our analysts learned from this experiment was that social media mentions are quite powerful. Even when they had no idea of the real process that was utilized to select the winners, they were able to obtain a prediction about who the winners might be (in a majority of the cases) by listening to public opinion. From a business perspective, social media analytics becomes a tool that can be leveraged for some quick analysis using publicly available data before spending large amounts of money in focus groups or other formal information-gathering mechanisms. Consider that a company with many established products in the marketplace could perform a quick market reaction analysis of its products without spending much money before deciding on further formal research that may be needed. Thus, perhaps it could make an educated guess before proceeding.
Discovering Themes and Topics
So far, we have discussed some actual use cases that satisfy the goal of validating hypotheses. Here, we look at a use case in which we do not start with a predetermined hypothesis, but we keep an open mind and try to discover and understand what the data is telling us. In these types of cases, the project team is usually not sure of what to expect. Team members are truly open to discovering new information from the analysis. The content utilized in this project cannot be considered as social media content; however, the content is unstructured text and the techniques used and conclusions drawn are equally applicable to text captured via social media.
One of the divisions in IBM had initiated an award for the best-managed project in that division. A number of project managers submitted their projects for consideration of this award. A panel of judges evaluated the applications and designated one project as the best project of the year.
As part of this process, the project management profession leaders of that division wanted to analyze the project submissions to discover attributes of top projects based on the information submitted. What made one project stand out against others? What were the common attributes of projects that were perceived to be better than others?
As input to our analysis, we started with the content that was submitted by each of the 100 projects. The format of the input file contained the following fields:
Name of Project:
Email Address of the Project Manager:
Name of the Manager:
Business Value: Free-form text
Business Value of Projects
To give you an idea of the content available for this project, we include here one random example of an entry for a project that we utilized in our analysis. This is basically the text that the person who submitted the application included in the Business Value field.
Sample Entry
This Project implemented best practices in Scope Management, Planning, Monitoring including Status Reporting. In addition to using Fasttracking wherever possible, the PM created an Excel-based visual dashboard for displaying project scope up to the task level on each of the multiple components (Work Breakdown Structure), status of the task, and the date when it was expected to complete. It facilitated stakeholders and the PM to get a quick understanding of which tasks and which components were behind schedule. This sped up monitoring as well as control and communication to stakeholders, and thereby identified action items that could control the deviations in the schedule. This saved quite a bit of time during reviews with stakeholders and enabled the team to focus more on resolving issues, minimizing risks, increased planning, and better decision making and implementation. The quantitative business value was the setting up of a new I/T infrastructure of 22 servers from scratch (including capital and hardware procurement) and deploying IBM’s business-critical CRM (Customer Relationship Management) application which produces reports that are utilized by executives and our CEO in just 10 weeks, which normally would have taken close to a year.
Analysis of the Information in the Business Value Field
We then analyzed this information using a text analytics tool called IBM Content Analytics (now, Watson Text Analytics). IBM Content Analytics (ICA) is an advanced search and analytics platform that enables users to derive insight and create better decision-making models from any type of content (enterprise content, social media, plain text, and so on). IBM’s Content Analytics solutions allow users to understand the meaning and context of human language and rapidly process information to improve knowledge-driven search and surface new insights from that content. Content Analytics uses the same natural language processing (NLP) technologies as IBM Watson DeepQA, the world’s most advanced question-answering machine.
Our Findings
Once the model was defined in this tool, the tool was able to analyze all of the content and, based on the frequency and co-occurrence of the words, come up with themes suggested by the content. For example, there was a lot of discussion associated with projects being executed “on budget,” “under budget,” or with “cost savings.” Our analyst collected a list of such words and categorized them in our model under the attribute “Financial Planning” of a project. This process was continued, and nine attributes were identified across all the projects that were submitted for consideration. The following list shows the name of the attribute and the key words that we used to include a particular textual description under the given attribute of project performance:
![]() Financial Planning—On budget, under budget, cost savings, accurate revenue-cost forecasting, financial management cost savings, decreased costs, no cost overruns, cost reduction for the client, under estimated cost
Financial Planning—On budget, under budget, cost savings, accurate revenue-cost forecasting, financial management cost savings, decreased costs, no cost overruns, cost reduction for the client, under estimated cost
![]() On-Time Delivery—On time, on schedule
On-Time Delivery—On time, on schedule
![]() Strong PM—Implemented strong PM practice, strong PM, PM capabilities, PM discipline, PM resolution, PM approach, WWPMM, The IBM Worldwide Project Management Methods Project MGMT Disciplines
Strong PM—Implemented strong PM practice, strong PM, PM capabilities, PM discipline, PM resolution, PM approach, WWPMM, The IBM Worldwide Project Management Methods Project MGMT Disciplines
![]() Agile Methodology—Agile methodology, agile development framework
Agile Methodology—Agile methodology, agile development framework
![]() Control Management—Agile Scope Control, monitoring, tracking, tight control framework
Control Management—Agile Scope Control, monitoring, tracking, tight control framework
![]() Risk Management—Risk management plan, minimize the risk of failure, risk management, reduce risk
Risk Management—Risk management plan, minimize the risk of failure, risk management, reduce risk
![]() Defect Resolution—Eliminate constraints, address clients’ issues, fix incapability and dependency, minimize disruption, cutover, zero escalation, manage defect, reduce defect, fix framework
Defect Resolution—Eliminate constraints, address clients’ issues, fix incapability and dependency, minimize disruption, cutover, zero escalation, manage defect, reduce defect, fix framework
![]() Milestone Adherence—Meet key deadlines, key project milestones, meeting of planned deliverables, deliverable management mobilizing resources in a timely fashion
Milestone Adherence—Meet key deadlines, key project milestones, meeting of planned deliverables, deliverable management mobilizing resources in a timely fashion
![]() Target Adherence—Project performance measured against the project plan on a weekly basis, systematic tracking of goal, target adherence, ongoing evaluation results, refine requirements at the beginning of each spiral
Target Adherence—Project performance measured against the project plan on a weekly basis, systematic tracking of goal, target adherence, ongoing evaluation results, refine requirements at the beginning of each spiral
We then calculated the percentage of projects that referenced these key attributes, as shown in Figure 7.4.
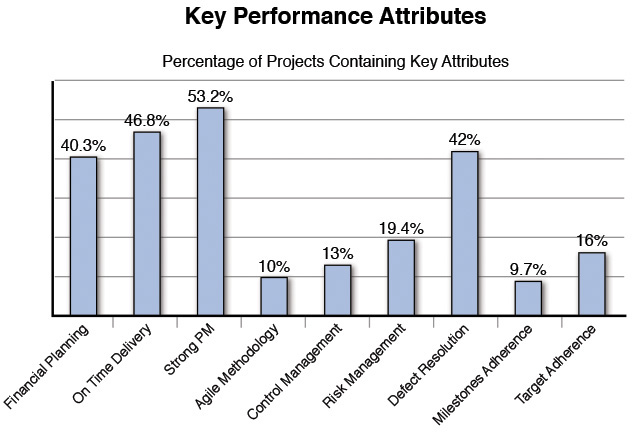
This analysis showed that the top three attributes of successful projects were strong project management discipline, on time delivery, and good processes for defect resolution. These results were fed back to the Project Management Education and Training program for that division to further reinforce the importance of these attributes in successful execution of projects.
Using Iterative Methods
Many times when we start out on a project, we have a clear vision, and with a little forethought, we establish a course of action that enables us to achieve our desired results. Of course, as Robert Burns once said: “Sometimes the best-laid plans of mice and men oft go awry.” Mice, men, or even social media analysts—it’s all the same! Sometimes the ideas we have, the questions we’ve posed, or the plan of attack that we’ve devised needs to be modified. We have to be flexible because sometimes we’re just plain wrong, or we’ve picked up a screwdriver to drive a nail. Things just aren’t right.
An iterative method of working, be it the creation of a model, the writing of software, or even of writing a book, is one in which we do not attempt to start with a full specification of requirements or plan. We don’t define steps 1 through 100 and then proceed in order creating our solution. Instead, we begin by specifying and implementing just part of our solution, which can then be reviewed and evaluated in order to identify further requirements or changes. This process is then repeated, producing a new version that is hopefully an improved version of the previous release. We continue cycling through iterations of our product, software, or solution until we believe we’ve achieved success.
As we work iteratively on a project, we create a rough draft or rough set of results in a single iteration. We then review it, decide on changes to (hopefully) improve it in next iteration, and continue until we’ve finished. Figure 7.5 visually describes the iterative method.
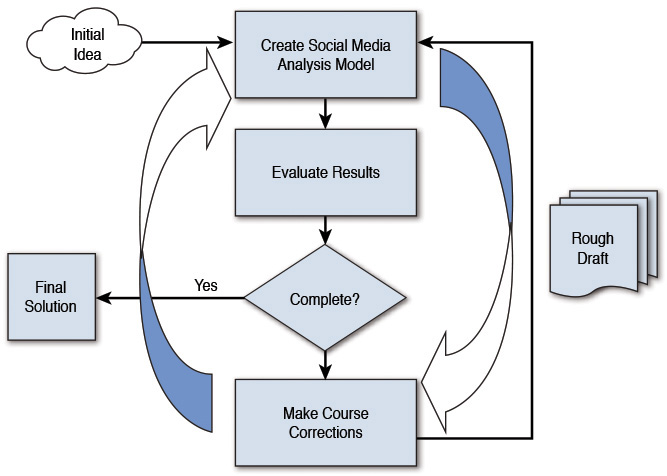
In the iterative model, we are building and improving the final analysis step-by-step. In this way, we can address deficiencies in our model or analysis early on in the process. This allows us to perhaps change our model, look for additional data, or perhaps change the question in a way that is more relevant. The most important aspect is the ability to obtain feedback as we progress.
A feedback loop is something we use to gather feedback about what we’re doing, learn from the feedback, and then make changes based on that feedback. The sole purpose of a feedback loop is to improve a project based on the current plan of attack. These loops are important because they allow us a systemized approach to observing our results and learning from them.
Using this approach helps us to avoid those awkward moments that can happen when we present our analysis and the customers simply look on with a blank stare and comment, “That’s not what I asked for.” If they can see the progress (and perhaps help shape the final analysis), there are no surprises at the end.
Summary
For projects in which we are validating a previously formed hypothesis, the analysis is complete as soon as we find enough evidence that either proves or disproves the hypothesis. For projects in which we are discovering the themes, the end is not so clear. The team that is performing the analysis has to work with the stakeholders iteratively to determine if the level of detail analyzed and the types of conclusions derived are in line with stakeholder expectations. There are also projects in which, even after validating a hypothesis, there is considerable business value to be gained by discovering other themes that the team had not considered before.
Endnotes
[1] Spaulding, Jonathan. Ansel Adams and the American Landscape: A Biography. University of California Press, 1998.
[2] Mila Gessner is an analyst who works at IBM. Many of the examples used in this chapter are based on the specific work she did on these projects. These examples are reproduced here with her knowledge and permission.
[3] The Heritage Foundation, “2015 Index of Economic Freedom.” Retrieved from http://www.heritage.org/index/country/france. To locate a specific country, use the following URL, supplying the name of country where indicated: http://www.heritage.org/index/country/name of country.