
6. The Right Tool for the Right Job
2014 will just be about the improved use of data to drive insight, action, and value in a huge number of ways. The last few years have been about putting the systems, technology, and people in place. There will still be an ongoing war for data talent but the use of data across organizations will finally become more ‘business as usual’ in 2014.
—Ashley Friedlein, Econsultancy [1]
Data analysis is the critical set of activities that assist in transforming raw data into insights, which in turns leads to a new base of knowledge and business value. A review of the current literature on social media analytics reveals a wide variety of use cases and types of analysis.
Many different types of analysis can be performed with social media data. In our own work, we have found it beneficial to categorize and classify these different types of analysis in a number of “buckets.” In this chapter, we present our recommended taxonomy schema for social media analytics as well as the types of insights that could be derived from that analysis. This taxonomy is mainly based on four dimensions:
1. The depth of analysis (the complexity of the analysis)
2. The machine capacity (the computational needs of the analysis)
3. The domain of analysis (internal versus external social media)
4. The velocity of data (the rate at which data arrives for analysis)
This proposed taxonomy is then examined through the use of several sample metrics derived from a number of engagements we have worked on in the past [2].
The Four Dimensions of Analysis Taxonomy
A taxonomy is a valuable construct for the categorization and organization of attributes used to describe similar entities. There have been many attempts to classify the type of analysis possible in the social networking analytics space [3] and, recently, an attempt to classify the types of data used [4]. In the case of social media analysis, various tools and techniques are used to aid analysts in drawing conclusions from these data sources. Understanding the type of analysis that is required is important when comparing tools or services that would be needed for any future analysis projects.
The taxonomy is mainly based on four dimensions:
![]() Depth of analysis—Simple descriptive statistics based on streaming data, ad hoc analysis on accumulated data, or deep analysis performed on accumulated data.
Depth of analysis—Simple descriptive statistics based on streaming data, ad hoc analysis on accumulated data, or deep analysis performed on accumulated data.
![]() Machine capacity—The amount of CPU needed to process datasets in a reasonable time period. Capacity numbers need to address not only the CPU needs but also the network capacity needed to retrieve data.
Machine capacity—The amount of CPU needed to process datasets in a reasonable time period. Capacity numbers need to address not only the CPU needs but also the network capacity needed to retrieve data.
![]() Domain of analysis—The vast amount of social media content available out there can be broadly classified into internal social media (all of the social media content shared by company employees with each other that typically stays inside a firewall) and external social media (content that is outside a company’s firewall).
Domain of analysis—The vast amount of social media content available out there can be broadly classified into internal social media (all of the social media content shared by company employees with each other that typically stays inside a firewall) and external social media (content that is outside a company’s firewall).
![]() Velocity of data—Streaming data or data at rest. Streaming data such as Twitter that is being posted in real time about a conference versus accumulated data from the past five minutes, past day, past week, past month, or past year.
Velocity of data—Streaming data or data at rest. Streaming data such as Twitter that is being posted in real time about a conference versus accumulated data from the past five minutes, past day, past week, past month, or past year.
For each distinct type of analytics specified in the taxonomy, we describe the type of analysis that can be performed and what types of techniques can be utilized for the analysis. In future chapters, we take some of these salient types of analytics and provide more complete treatment based on real-life examples.
Depth of Analysis
The depth of analysis dimension is really driven by the amount of time available to come up with the results of a project. This can be considered as a broad continuum, where the analysis time ranges from a few hours at one end to several months at the other end. For the sake of simplicity, we can consider this as three broad categories: small, medium, and large.
In cases in which the depth of analysis is small, we typically use a system called Simple Social Metrics (SSM). SSM allows us to look at a stream of data and come up with some simple and quick metrics that yield useful information. For example, if we are monitoring Twitter data on a given topic, say cloud computing, SSM will be able to answer the following questions at the end of the day:
How many people mentioned IBM in their tweets?
How many people mentioned the word Softlayer in their tweets?
How many times were the words IBM, Microsoft, and Amazon mentioned during the day?
Which author had the highest number of posts on cloud computing during the day?
In cases that could be classified as having a medium depth of analysis, we can take the example of projects in which we have to do ad hoc analysis. Consider, for instance, the case in which our marketing team has been collecting information from social media channels, including Twitter, over the past three months. Now the team wants the analysts to answer the following questions:
Which IBM competitor is gathering the most mentions in the context of social business?
What is the trend of positive sentiment of IBM over the past three months in the context of mentions of the term social business?
And, lastly, cases that could be considered as having a large depth of analysis are varied and are really project specific. For example, a group within IBM that is responsible for releasing new features for a specific product wants to do an in-depth analysis of social media chatter about its product continuously over a period of one year. This group may do a baseline analysis for three months, where it just collects social media data and counts the number of mentions and assesses sentiment. Then, in response to a specific new feature release, the group wants to see how the same metrics change over a period of three or six months. The group also wants to understand how the sentiment is influenced by some other attributes in the marketplace such as overall economy or competitors’ product releases.
Machine Capacity
The machine capacity dimension considers the network and CPU capacity of the machines that are either available or required for a given type of use case.
In subsequent sections of this chapter, we discuss aspects of network use and CPU use in the context of the four main dimensions that we have considered in the taxonomy. Table 6.1 shows a summary view of Network and CPU requirements.
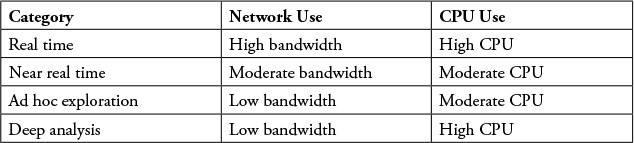
Real-time analysis in social media is an important tool when trying to understand the public’s perception of a certain topic as it is unfolding to allow for reaction or an immediate change in course. The amount of data to be processed can be very large in such cases. During one of the debates between President Barack Obama and Mitt Romney during the 2012 presidential election, there were about 20,000 related tweets per second [1]. The need to collect, store, and analyze information at such velocities causes us to rate the bandwidth and the CPU requirements as high within our taxonomy.
In the case of near real-time analysis, we assume that data is ingested into the tool at a rate that is less than real time. As a consequence, the bandwidth requirement is less than that of a real-time component, and the CPU requirement also becomes less.
An ad hoc analysis is a process designed to answer a single specific question. The product of ad hoc analysis is typically a report or data summary. An ad hoc analysis is typically used to analyze data at rest—that is, data that has previously been retrieved and ingested in a non-real-time manner. These types of systems are used to create a report or analysis that does not already exist, or drill deeper into a specific dataset to uncover details within the data. As a result, the CPU requirement can be moderate while the network bandwidth requirement would be relatively low.
A deep analysis implies an analysis that spans a long time and involves a large amount of data, which typically translates into a high CPU requirement.
Figure 6.1 presents a graphical view of the machine capacity requirements.

![]() External social media—In this book, we have spent quite a bit of time describing and focusing on external social media.
External social media—In this book, we have spent quite a bit of time describing and focusing on external social media.
Most of the time when people use the term social media, they usually mean external social media. This includes content generated on popular social media sites such as Twitter, Facebook, LinkedIn, and so on (see the discussion on various social media venues in Chapter 5).
![]() Internal social media—For a number of years now, many companies have been investing in enterprise social networks as a way to open communication channels between employees.
Internal social media—For a number of years now, many companies have been investing in enterprise social networks as a way to open communication channels between employees.
An enterprise social network (ESN) is an internal, private social network used to assist communication within a business [5]. As the number of companies investing in ESNs grows, employees are discovering more and more ways to conduct business in a more social and “open” way. According to an IDC Study in June 2013, about 79% of the companies surveyed had enterprise social networks [6]. Internal social media, also known as enterprise social media, refers to the variety of contributions (blogs, forums, communities, and so on) made by company employees with each other utilizing ESNs as the platform for communication.
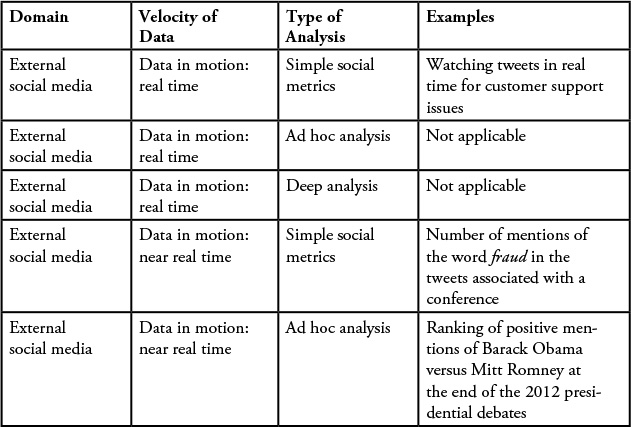
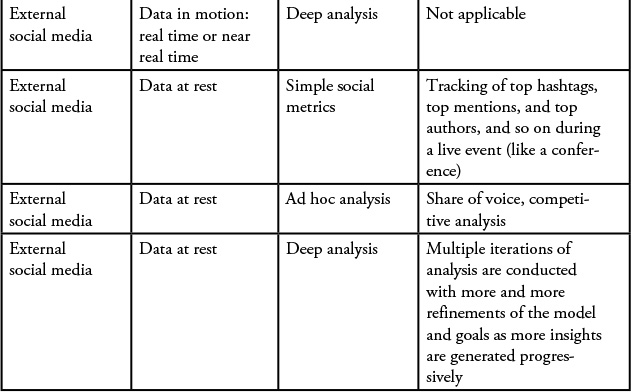
External Social Media
Let’s first focus on the external social media domain. There are two broad analysis types based on whether the data is at rest or in motion. And, in each of these cases, we consider use cases for simple social metrics, ad hoc analysis, and deep analysis.
Data in Motion
Earlier we described the velocity of data, or the rate at which new data arrives. The term velocity implies something in motion (such as the arrival of new entries in a data stream). Consider the buildup to a major sporting event, say the finals of a World Cup Soccer match. Prior to the event, there may be a small amount of discussion leading up to the match, but as the day of the match approaches, the amount of conversation around the topic will grow, sometimes to a feverish pitch. This increased rate of arrival of motions is what we refer to as the velocity of the data, or its increased rate of motion.
Simple Social Metrics (SSM)
There are several use cases in which we may want to understand what is happening in real time. For example, consider the host of a large conference or trade show that is attended by customers, press, and industry insiders. The success or failure of such an event can be critical to the hosting organization. During the conference, a dedicated team of customer service professionals may be able to watch a live Twitter feed to stay on the lookout for any tweets related to a customer service or dissatisfaction issue. In another case at this same conference, a technology consulting firm that specializes in fraud prevention in the financial industry may be looking for leads by looking at any tweets that mention the terms fraud, financial, bank, and so on. In this use case, the focus is on timely processing of information that is streaming through. In both of these examples, the need for real-time alerts or analysis is required to complete these tasks.
In thinking about the machine capacity and the real-time nature of the data, the network bandwidth and the CPU capacity required for this type of analysis can be quite high. By network capacity, we are referring to how fast of a network connection is required to keep up with the data rates from a high-velocity feed. For example, a typical T1 network connection (about 187,500 characters per second) would be consumed (fully used) if the velocity of a Twitter feed exceeded approximately 1,340 tweets per second.
CPU bandwidth, on the other hand, is the amount of compute time needed to perform the text analytics on the tweets received from a feed. If the CPU can’t “keep up” with the arrival rate of the data, the ability to analyze tweets in real time suffers as the data “queues” up waiting for CPU to free up for the next analysis.
If, instead of real time, we are allowed to have a delay of one to five minutes (near real time), the network and CPU requirements become more moderate. The reason is that we are allowed to process the tweets we’ve already received in whatever time we have available.
Ad Hoc Analysis and Deep Analysis
Because of the short amount of time available for processing, deep analysis or ad hoc analysis usually is not possible in such cases. In our taxonomy, we use the term ad hoc analysis to describe an analysis that is produced one time to answer a single specific business question. This type of analysis refers to dealing with situations as they occur rather than ones that are repeated on a regular basis. The assumption is that there is a data store or collection of raw data that these queries or analysis can “run over.”
Data at Rest
Data at rest refers to use cases in which data has already been accumulated. This can include data from the past day, week, month, or year. This also includes custom windows of time—for example, social media data around a “water day” event in South Africa several months back for a duration of one month.
Simple Social Metrics (SSM)
SSM analysis is characterized by simple metrics, computations, and analytics. The focus is on generating some quick results. Following are some sample use cases with the SSM type of analysis:
![]() Duration of analysis—1 day
Duration of analysis—1 day
During the IBM Insight 2014 conference in Las Vegas, at the end of the day, we wanted to identify the top hashtags, top mentions, and top authors in discussions around the topics cloud, analytics, mobile, social, and security.
![]() Machine capacity—The network bandwidth and the CPU capacity required for this type of analysis are low.
Machine capacity—The network bandwidth and the CPU capacity required for this type of analysis are low.
Ad Hoc Analysis
![]() Duration of analysis—1 month
Duration of analysis—1 month
During the first month after the release of a new version of an IBM Software product, we wanted to understand the trend of “volume of conversations.”
For a given IBM Software product, during any continuous time period, we may want to understand the “volume of conversations” around IBM. This analysis is often called the “share of voice” in a conversation, or how much of the conversation includes mentions of, say, IBM, and how much contains mentions of its competitors.
![]() Machine capacity—The network bandwidth required is quite low, but the CPU capacity is typically low to moderate, depending on the amount of total data that we will be processing.
Machine capacity—The network bandwidth required is quite low, but the CPU capacity is typically low to moderate, depending on the amount of total data that we will be processing.
Deep Analysis
A deep analysis is a full-fledged social media research project typically spanning a period of weeks to months. The amount of data processed in each iteration of the analysis could be relatively small or large, but the duration of the study is usually large. This type of analysis is characterized by an approach that starts with raw data and some limited goals. But as the analysis progresses through the various iterations, the team progressively becomes aware of the hidden insights, and the solution focus areas get narrower and narrower. We described one example from our experience here.
In this case, we collected data from a conference and analyzed it in an attempt to identify dominant themes. Once the themes and topics were identified, using tools that support sophisticated statistical capabilities, we established correlations between various topic pairs. The resultant table is shown in Figure 6.2. The data has been modified for illustrative purposes so that no “real” conclusions can be drawn about the named entities here.
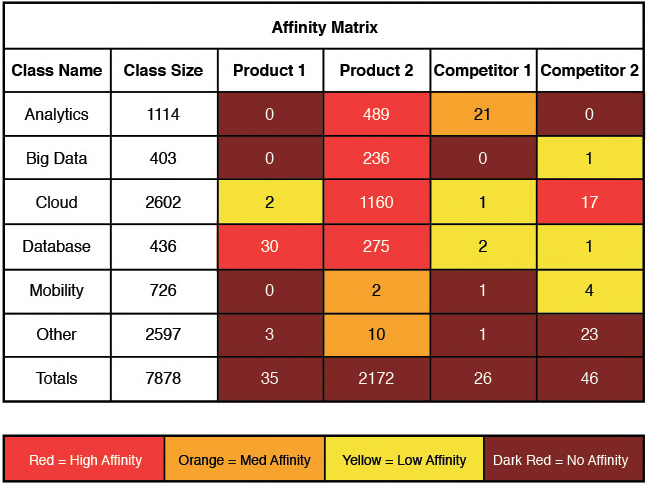
In many cases, a deeper analysis of a set of data involves combining several specific terms under a single umbrella, or concept. For example, when mining unstructured data for words such as computer, computing, computer networking, or cloud, we could group them together to form a single concept called “Information Technology.” The increased CPU intensity attribute for the deep analysis comes from this extra pattern matching and text analytics code. In the case of the relationship matrix (see Figure 6.2), all of the concepts are compared to compute an affinity matrix between concepts in an attempt to determine if there is a low affinity (relationship) between concepts or a high affinity. Since it is quite possible that new terms or words could be uncovered during the analysis that would be relevant to a particular concept, the data models would need to be modified and rerun. This, in turn, also drives the high CPU utilization (in hindsight, this could also point to another extension of the taxonomy: time to deliver results). Table 6.2 contains a summary of different types of use cases involving External Social Media.
Internal Social Media
Let’s now focus on the internal social media domain. IBM uses its own product, called IBM Connections, as its enterprise social network platform to facilitate collaboration among all the employees inside the firewall. Even in this domain, there are two broad analysis types based on whether the data is at rest or in motion. And, in each of these cases, we consider use cases for simple social metrics, ad hoc analysis, and deep analysis.
Data in Motion
With more than 500,000 profiles enabled on the IBM Connections platform, there tends to be quite a bit of activity occurring throughout the day. Activity ranges from the simple posting of a status message to notifications of new product announcements, recognition of employees, and just general awareness of things happening inside of IBM.
To watch for potential employee dissatisfactions, we have implemented a simple application that analyzes content in this platform and can capture and highlight any IT support issues that could arise with a new release of an internal computing application. For example, if a new version of Lotus Notes is rolled out to a broad section of the employees, the IT support team can configure this application to watch for positive or negative sentiment words being mentioned together with the name of the product.
![]() Machine capacity—Given the real-time nature of the data and the network bandwidth needed to keep up with incoming data, the CPU capacity required for this type of analysis is quite high. If, however, instead of real time, we introduce a delay, say one to five minutes, we can significantly reduce the network and CPU requirements because our computing infrastructure doesn’t need to process in real time. This is what we would call “near real time.”
Machine capacity—Given the real-time nature of the data and the network bandwidth needed to keep up with incoming data, the CPU capacity required for this type of analysis is quite high. If, however, instead of real time, we introduce a delay, say one to five minutes, we can significantly reduce the network and CPU requirements because our computing infrastructure doesn’t need to process in real time. This is what we would call “near real time.”
Simple Social Metrics (SSM)
Similar to the Simple Social Metrics discussed previously, IBM’s research team in Haifa has created a simple pie chart that shows a breakdown of the sentiment of all the content streaming through IBM Connections into positive, neutral, and negative sentiments. As of this writing, 38% percent of the posts are positive, 60% are neutral, and 2% are negative. These kinds of metrics allow us to understand the general feeling within IBM; this analysis doesn’t need to be on a real-time basis, since the change in mood of a large workforce changes over time, not instantaneously.
This Social Network Analysis application also continuously updates trending topics and trending words in real time because they can be predictors of things to come.
![]() Machine capacity—The network and CPU requirements are moderate in this case.
Machine capacity—The network and CPU requirements are moderate in this case.
Ad Hoc Analysis
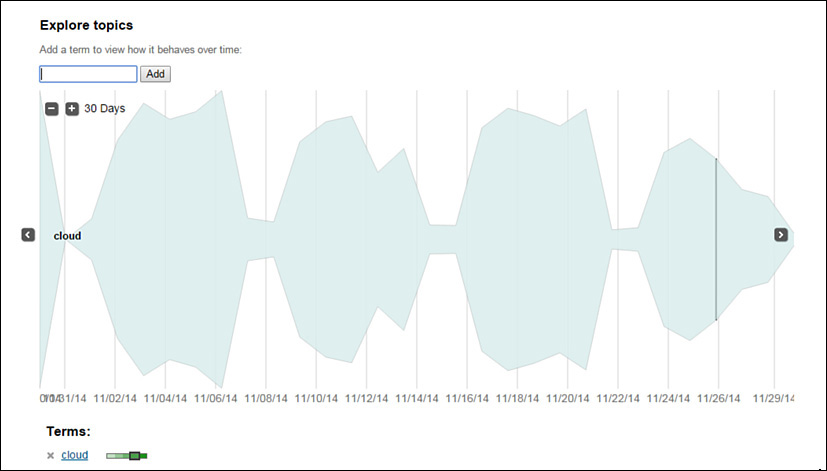
The IBM Research team has built an application that continuously monitors and analyzes all of the content that is streaming through IBM’s enterprise social network: IBM Connections. This social network analysis application has an interface that enables users to specify any topic, and the application will show these users an interactive view of all the conversations (including counts) relevant to that topic over the past 30 days (see Figure 6.3). This can be a very handy tool to gauge how well a certain topic has been resonating with the employees in the past month or so.
Deep Analysis
Because of the short amount of time available for processing in these types of projects, deep analysis is usually not possible.
Data at Rest
Data at rest refers to use cases in which data has already been accumulated. This can include data from the past day, week, month, or year. This also includes custom windows of time—for example, social media data around a “water day” event in South Africa several months back, for a duration of one month.
Simple Social Metrics (SSM)
IBM conducts online courses on key topics for very large audiences every month. The industry refers to these as massive open online courses (MOOCs). These courses are accessible to all employees. A new course is launched on the first Friday of each month. During the course of this day, we collect comments from all IBMers about this topic and about this specific course in the IBM Connections platform. At the end of the day, we compute some simple social metrics and come up with the following: top 10 hashtags, top 10 mentions, top 10 authors, and overall sentiment.
![]() Machine capacity—The network bandwidth and the CPU capacity required for this type of analysis are low.
Machine capacity—The network bandwidth and the CPU capacity required for this type of analysis are low.
Ad Hoc Analysis
![]() Duration of analysis—1 month
Duration of analysis—1 month
During the first month after the release of a new MOOC, we perform an analysis of all posts made by IBMers in IBM Connections and come up with some reports. For a course on cloud computing, we produced the following:
![]() Volume of conversations over time
Volume of conversations over time
![]() Volume of conversations by geography of the author
Volume of conversations by geography of the author
![]() Percentage of posts about cloud computing, in comparison to other similar words
Percentage of posts about cloud computing, in comparison to other similar words
![]() Percentage of positive, neutral, and negative comments
Percentage of positive, neutral, and negative comments
![]() Percentage of discussion by business unit and role
Percentage of discussion by business unit and role
![]() Machine capacity—The network bandwidth required is quite low, but the CPU capacity is typically low to moderate, depending on the amount of total data that we will be processing.
Machine capacity—The network bandwidth required is quite low, but the CPU capacity is typically low to moderate, depending on the amount of total data that we will be processing.
Deep Analysis
There are a variety of possibilities for use cases in the deep analysis category.
Since IBM has implemented an enterprise social network to facilitate communication and collaboration with and among employees, the next logical question becomes: What new insights can we derive through an analysis of the conversations? A few possible analytics projects have been proposed, but to date, we haven’t implemented them due to time constraints. We thought it might be of interest to see what kinds of projects would be possible given this rich source of data:
![]() What is the correlation between the level of social activity and the likelihood of increased innovation?
What is the correlation between the level of social activity and the likelihood of increased innovation?
![]() What is the correlation between the level of social activity and the likelihood of getting selected for a customer advocate role?
What is the correlation between the level of social activity and the likelihood of getting selected for a customer advocate role?
We cover the details of this use case in a subsequent chapter. Some of the high-level steps in implementing an internal social analytics practice include:
1. Establish an enterprise social network inside the corporate firewall. If the intent is to use an external platform, take care to ensure employees understand the risks of inadvertently releasing sensitive information to the public. But if an external platform is chosen, keeping a record of employee identifiers in that platform is critical to enable the retrieval of their information and ensure the analysis contains information from just the employees and not those outside the company.
2. Ensure a widespread adoption of the capabilities by employees.
3. Establish a metrics program that measures people’s participation in social activities.
4. Map these activities to behaviors and identify key performance indicators (KPIs).
5. Establish algorithms to compute the scores for each key performance indicator.
6. Establish a baseline.
7. Establish a metric for measuring innovation—for example, the number of patents.
8. Establish a metric for the customer advocate role—for example, names of people who got selected for a customer advocate role.
9. Establish a window of time for the study and analysis.
10. Measure the change in KPI values during the window of time.
11. Apply regression analysis and draw conclusions.
![]() Machine capacity—The network bandwidth required is usually low, but the CPU capacity required for this type of analysis is usually high.
Machine capacity—The network bandwidth required is usually low, but the CPU capacity required for this type of analysis is usually high.
Table 6.3 shows use cases for internal social media.

Velocity of Data
We briefly discussed time as an attribute of data in Chapter 1. We broadly divided this into two categories: data at rest and data in motion. In the following sections, we look at the dimension of time from the perspective of analysis. The dimension of velocity of data also can be divided into two parts: data in motion and data at rest.
Data in Motion
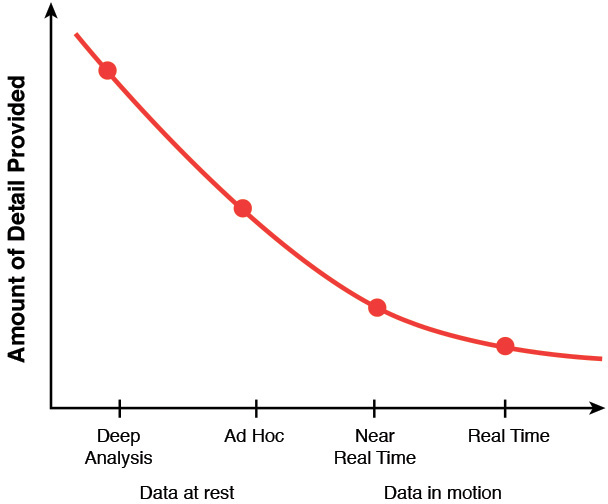
As an example of data in motion, during a US Open tennis match between two players, we might want to understand how the sentiment of the general population is changing about the two players during the course of match. Is the crowd conveying positive sentiment about the player who is actually losing the game? In such cases, the analysis is done as the data arrives. Our assumption, as shown in Figure 6.4, is that for a constant time interval, the amount of detail produced increases as the complexity of the analytical tool or system increases.
Data at Rest
A second type of analysis in the context of velocity is what we call “analysis of data at rest.” For example, we can collect social media conversations around IBM products and services before, during, and after a specific event to understand the public’s opinion. Once the data is fully collected, we can then perform analysis on this data to provide different types of insights; some examples follow:
![]() Which of your company’s products has the most mentions as compared to others?
Which of your company’s products has the most mentions as compared to others?
![]() What is the relative sentiment around your products as compared to a competitor’s product?
What is the relative sentiment around your products as compared to a competitor’s product?
![]() Is there a strong correlation between the marketing of a product or service and the number of positive comments about the brand itself?
Is there a strong correlation between the marketing of a product or service and the number of positive comments about the brand itself?
In these two cases (data at rest and data in motion), there are trade-offs that we need to consider time and the cost-to-deliver those results.
For example, if the results of such an analysis are needed in real time or near real time, the amount of time available for processing is, of course, limited and that will have an influence on how deep we can go with the analysis. We have observed that valuable insights can be derived quickly by providing some lightweight analytics in these real-time use cases. Simple metrics such as popular hash tags, most prolific authors, top mentions, and so on can provide some revealing insights without a large investment in computing (and analysts’) time. This usually translates into lower infrastructure costs because we are processing relatively small amounts of data in a small chunk of time.
When we are performing analysis of data at rest, the amount of data available for analysis (the volume) has a strong bearing on the time needed for the analysis to complete and hence the costs of that analysis. The amount of data could range from the one day to several weeks, months, or years. In such cases, we are usually interested in topics in aggregate, such as “How has the sentiment about a company’s brand changed over the given time period as compared to its competitors?” rather than a very specific topic or question.
The business benefits gained from a social analytics project aren’t always directly proportional to the cost. We have observed that, even though a lightweight analytics solution may cost much less than a deep analytics solution, the business benefit is still highly dependent on the specifics of the project that we are working on. For example, if a company is monitoring social media for any negative press about itself, its products, or its executives, and it detects a sudden surge in negative sentiment, the public relations department can be prepared with an appropriate response in a very short time. As any good public relations staff will tell you: “Forewarned is forearmed.”
Summary
Data analysis is the phase that takes filtered data as input and transforms that into information of value to the analyst. In this chapter, we presented a taxonomy of the various analytical situations we can run into and also discussed in general some of the analysis techniques that can be used in each situation. In subsequent chapters, we pick some specific situations and provide a fuller treatment of the analysis phase.
Endnotes
[1] Shiveley, Kevin, “10 Quotes from Analysts About the Future of Social Analytics and Measurement,” The Simply Measured Blog, March 24, 2014. Retrieved from http://simplymeasured.com/blog/2014/03/24/10-quotes-from-analysts-about-the-future-of-social-analytics-and-measurement/.
[2] Ganis, Matthew, and Avinash Kohirkar, “Taxonomy for Social Media Analysis, Infosys Lab Briefings,” Volume 12, Number 1, 2014. Retrieved from http://www.infosys.com/infosys-labs/publications/Documents/social-media-computing/taxonomy-social-media-analysis.pdf.
[3] Chelmis, C., and V. K. Prasanna, “Social Networking Analysis: A State of the Art and the Effect of Semantics,” Privacy, Security, Risk and Trust (PASSAT), October 2011, 531–536.
[4] Schneier, B., “A Taxonomy of Social Networking Data,” Security & Privacy, IEEE, 8, no. 4 (July–August 2010), 88.
[5] Kitt, Denise, “What Is An Enterprise Social Network?, CRM Switch—CRM,” May 24, 2012. Retrieved from http://www.crmswitch.com/social-crm/enterprise-social-network/.
[6] Thompson, Vanessa, “Worldwide Enterprise Social Software 2013–2017 Forecast and 2012 Vendor Shares: From ESS to ESN,” IDC, June 2013.