
Lesson 23. Performance Monitoring
It is important you build SQL statements that will execute efficiently. Fortunately SQL Server Management Studio provides you with the tools to analyze your SQL statements and ensure you have built them as efficiently as possible. This lesson introduces you to:
![]() How to execute queries in SQL Server Management Studio
How to execute queries in SQL Server Management Studio
![]() How to display and analyze the estimated execution plan for a query
How to display and analyze the estimated execution plan for a query
![]() How to add indexes to allow queries to execute more efficiently
How to add indexes to allow queries to execute more efficiently
![]() How to set query options
How to set query options
![]() How to use the SQL Server Profiler to diagnose performance bottlenecks
How to use the SQL Server Profiler to diagnose performance bottlenecks
Executing Queries in SQL Server Management Studio
By executing a query within SQL Server Management Studio, you can easily troubleshoot performance problems and tune your SQL statements. Use the following steps to execute a query:
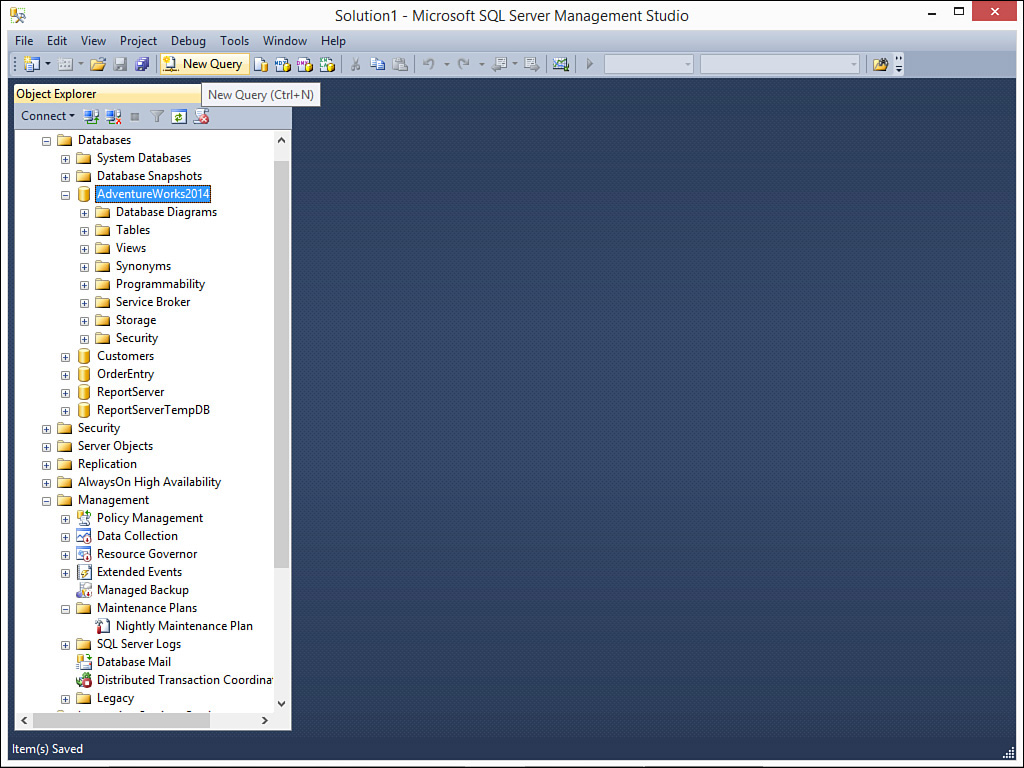
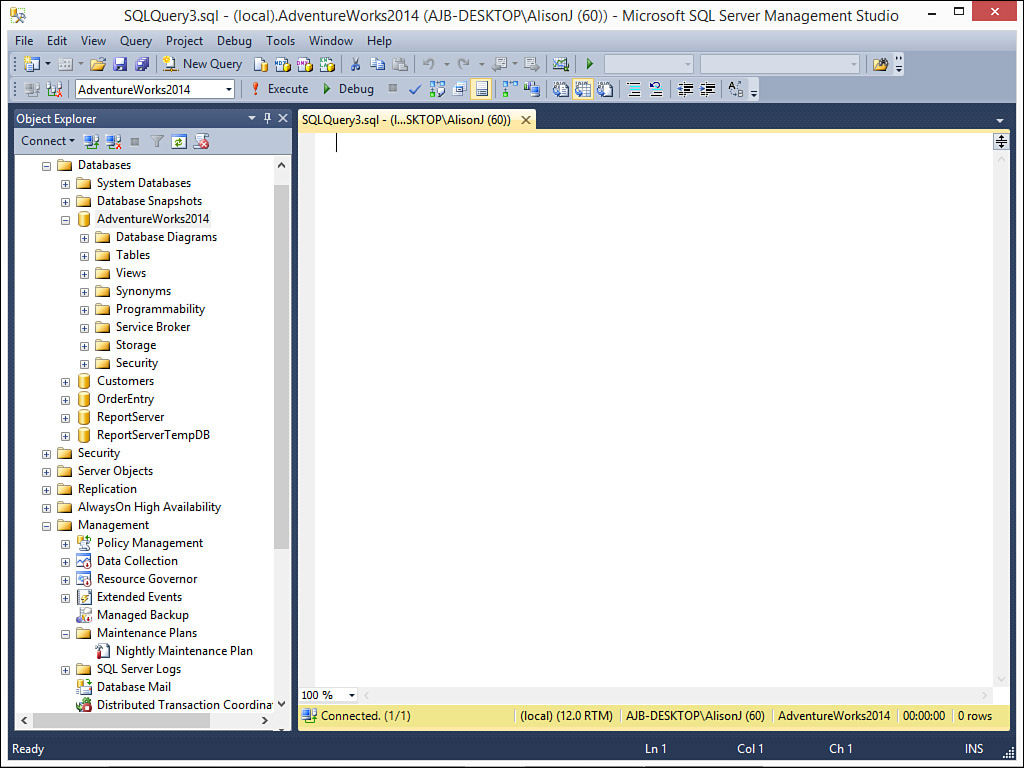
1. Click the New Query button on the toolbar (see Figure 23.1). A new query window appears where you can type a SQL statement (see Figure 23.2).
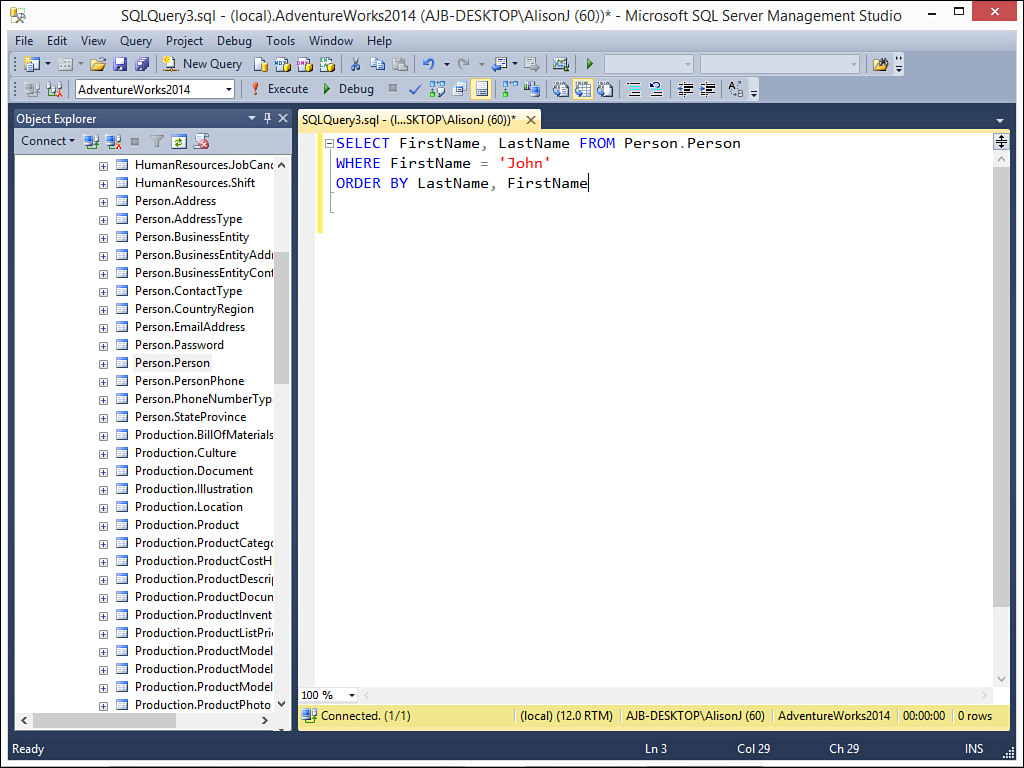
2. Type the desired SQL statement (see Figure 23.3).
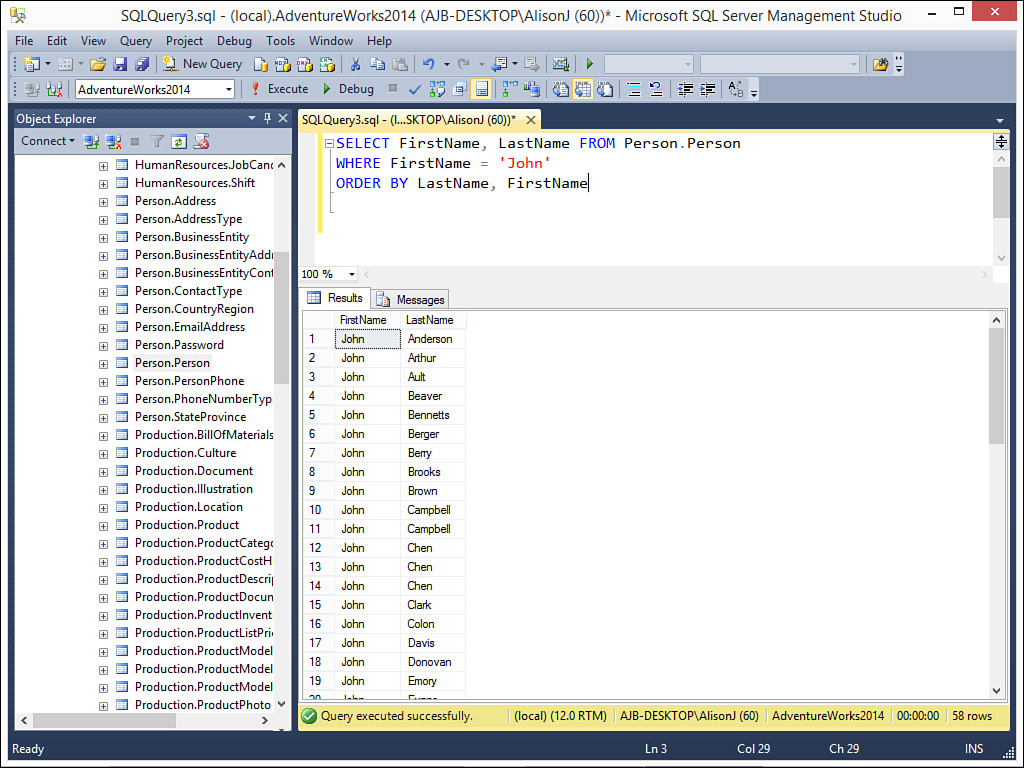
3. Click the Execute button on the toolbar to execute the query. The results appear as in Figure 23.4.
4. Click the Messages tab to view any messages associated with the execution of the query (see Figure 23.5).
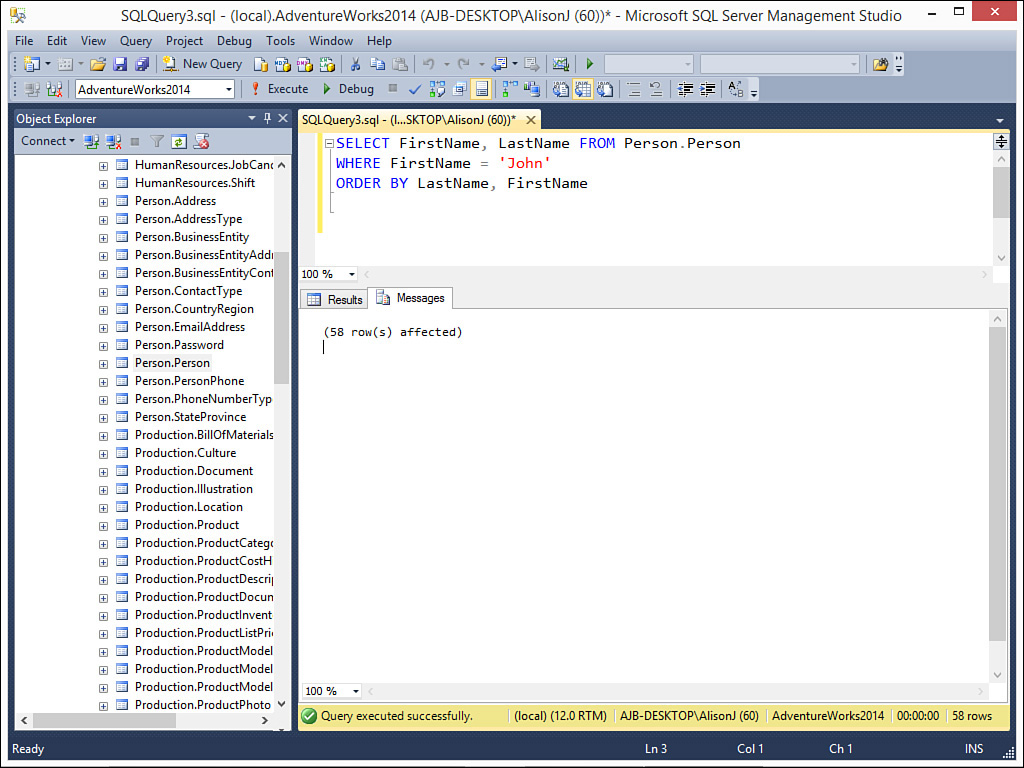
FIGURE 23.5 The Messages tab of the Results pane shows you any messages associated with the execution of the query.
Displaying and Analyzing the Estimated Execution Plan
Generally, you will not want to simply execute queries in SQL Server Management Studio. You will also want to analyze those queries to see if they are executing as efficiently as possible. Use the following steps to analyze a query:
1. Click the New Query button on the toolbar. A new query window appears where you can type a SQL statement.
2. Type the desired SQL statement.
3. Click Display Estimated Execution Plan. Your screen appears as in Figure 23.6.
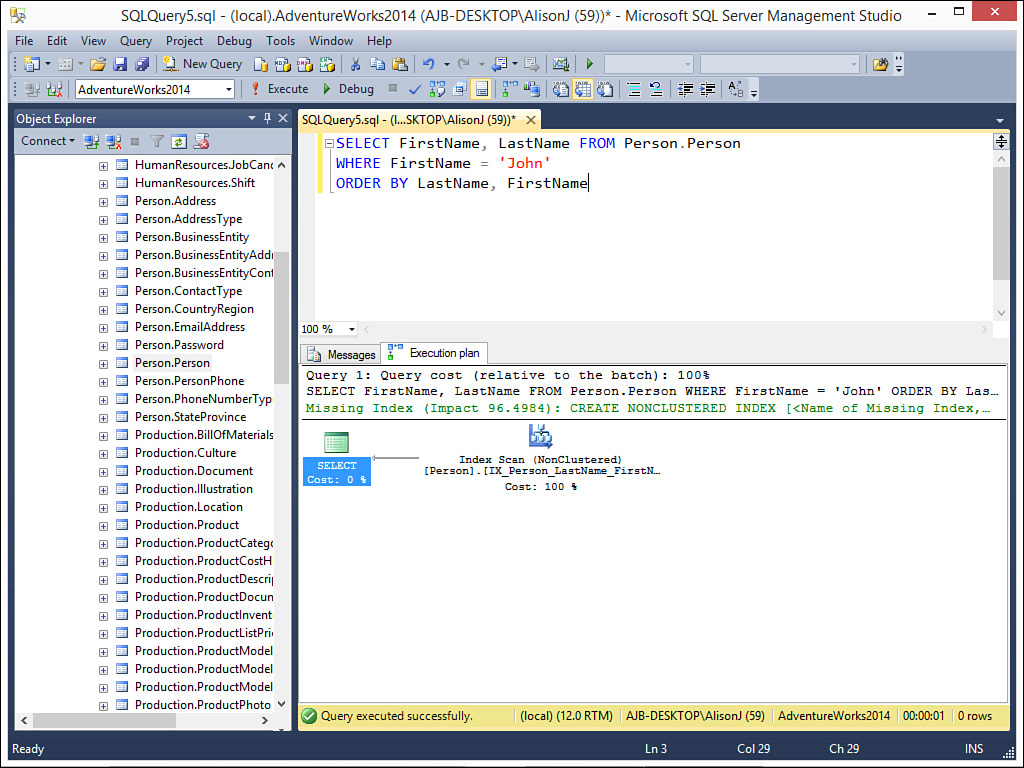
FIGURE 23.6 After clicking the Display Estimated Execution Plan toolbar button, you can see the execution plan for the query.
4. Hover your mouse pointer over the various steps in the execution plan. You will get more information about each step (see Figures 23.7 and 23.8).
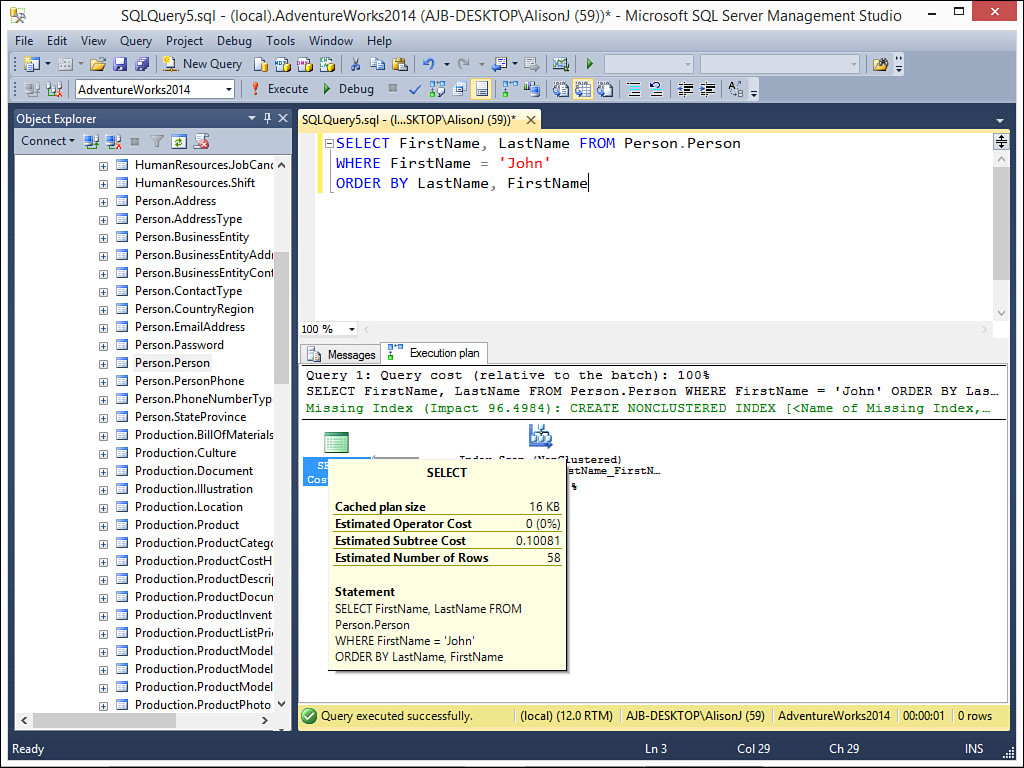
FIGURE 23.7 If you hover your mouse pointer over each step of the execution plan, you see information about that step.
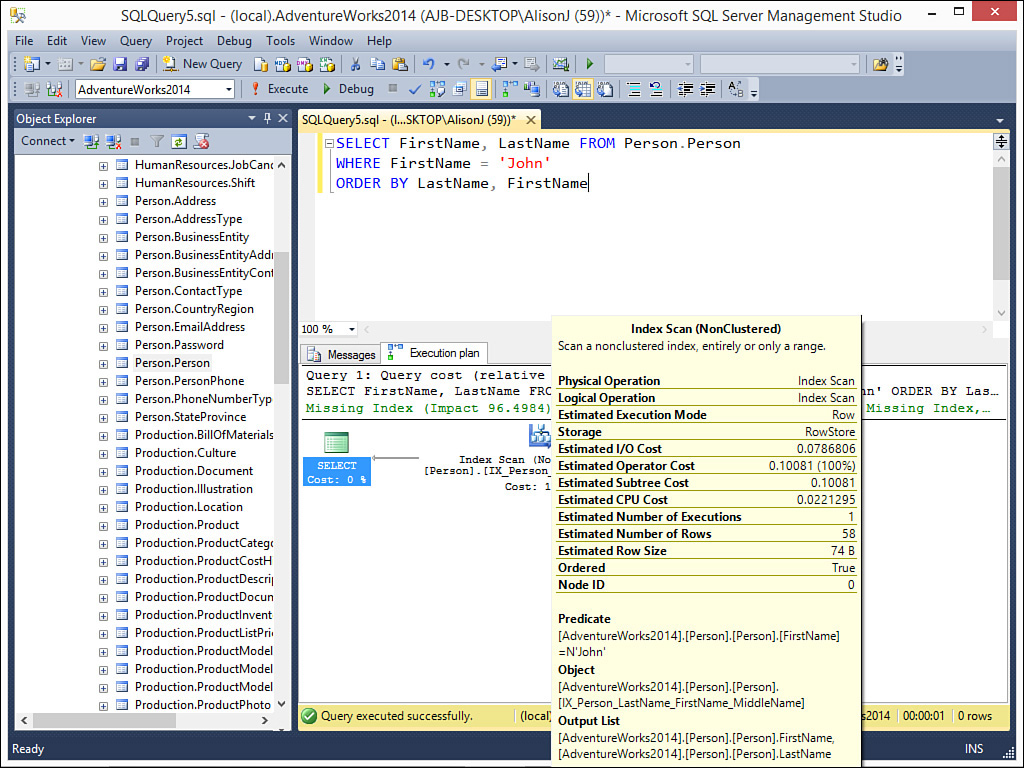
FIGURE 23.8 Notice in the example, SQL Server is using a clustered index scan when executing the SQL statement.
5. If you want to display the execution plan each time you execute the query, click the Include Actual Execution Plan button on the toolbar. The Execution Plan tab displays each time you execute the query (see Figure 23.9).
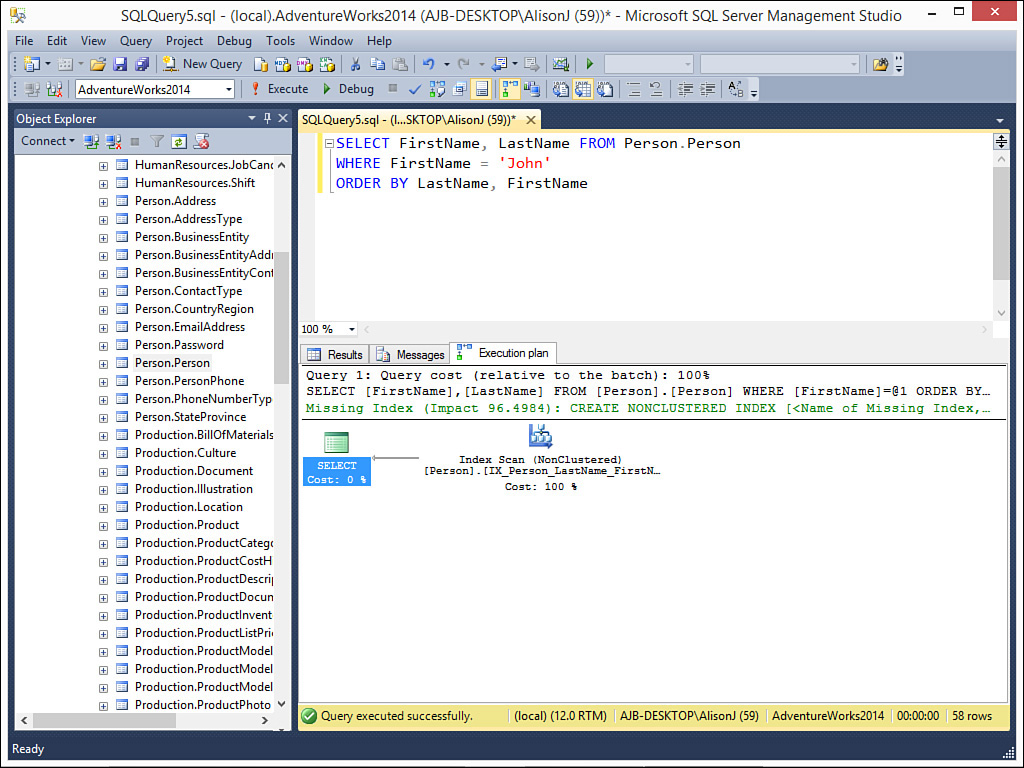
FIGURE 23.9 If you click the Include Actual Execution Plan button on the toolbar, the Execution Plan tab displays each time you execute the query.
6. To include client statistics each time you execute the query, click the Include Client Statistic button on the toolbar. After executing the query, the Client Statistics tab appears as in Figure 23.10. Here you can receive valuable statistical information about the execution of the query. For example, you can determine the number of roundtrips SQL Server made to the server in executing the query.
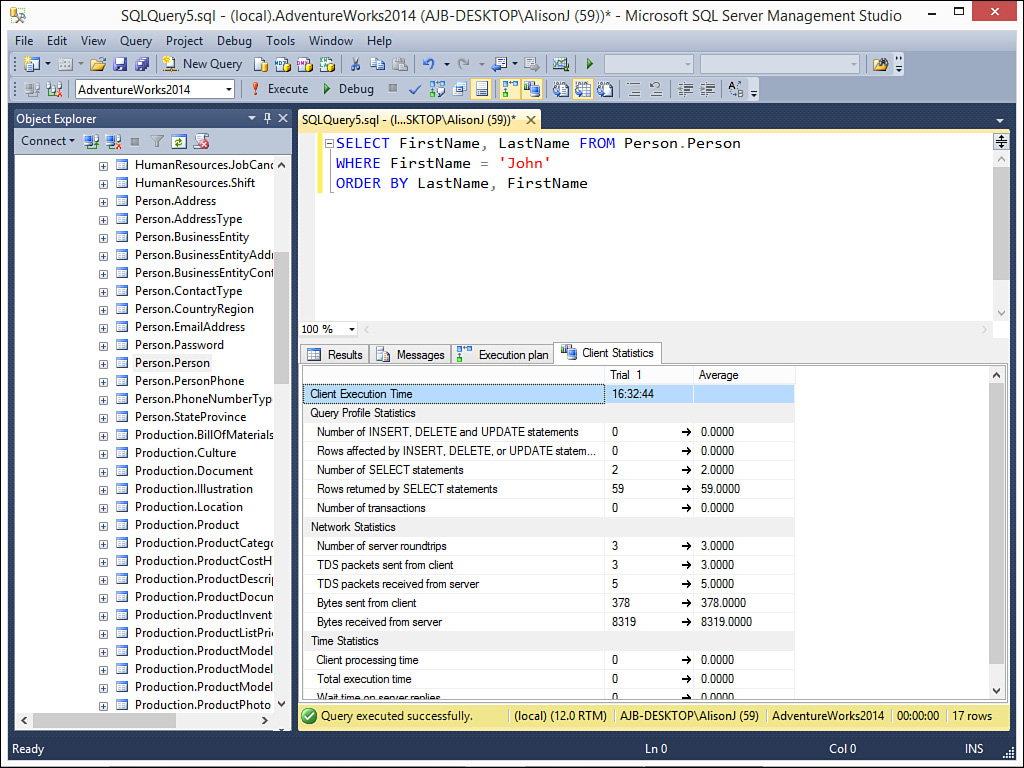
FIGURE 23.10 If you click the Include Client Statistics button on the toolbar, the Client Statistics tab appears each time you run a query.
Adding Indexes to Allow Queries to Execute More Efficiently
The easiest way to improve the efficiency of the queries you build is to add indexes to the underlying tables. You can easily view the results of your efforts using the Execution Plan tab and the Client Statistics tab after executing the query. Here’s how:
1. Make sure you have both the Include Actual Execution Plan and Include Client Statistics toolbar buttons selected.
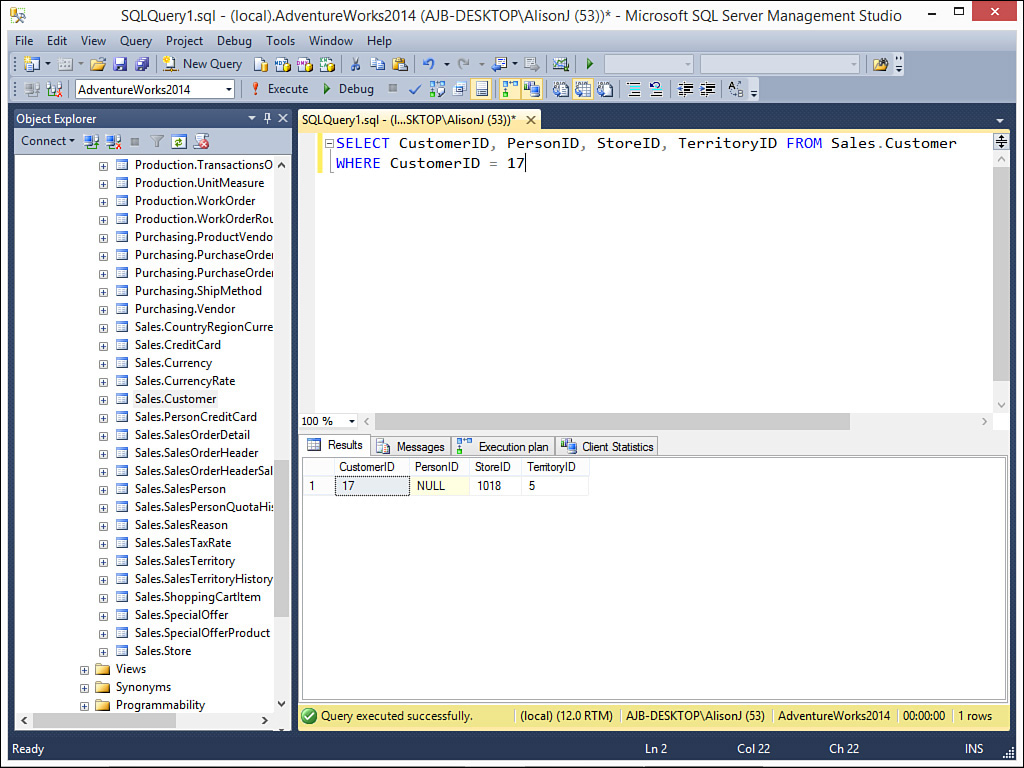
2. Execute a query and apply criteria to a field on which there is no index (see Figure 23.11).
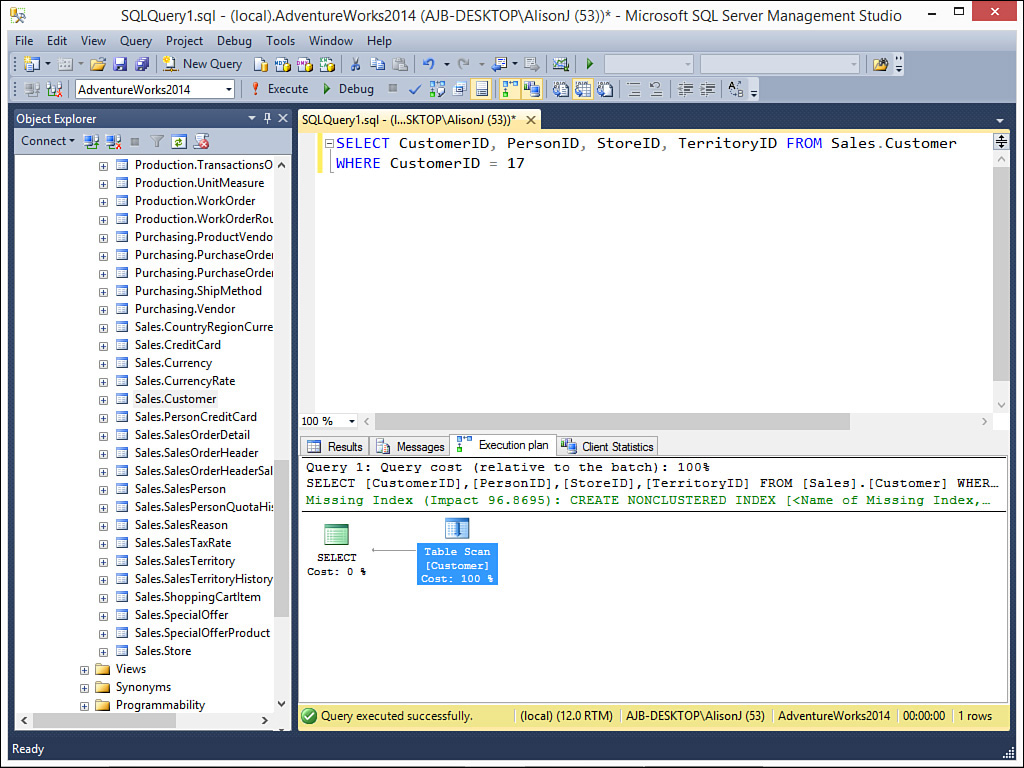
3. Click the Execution Plan tab. Notice that the execution plan includes a sort (see Figure 23.12). A sort is very inefficient when executing a query.
4. Click the Client Statistics tab and note the Total execution time so you can compare it to your optimized query.
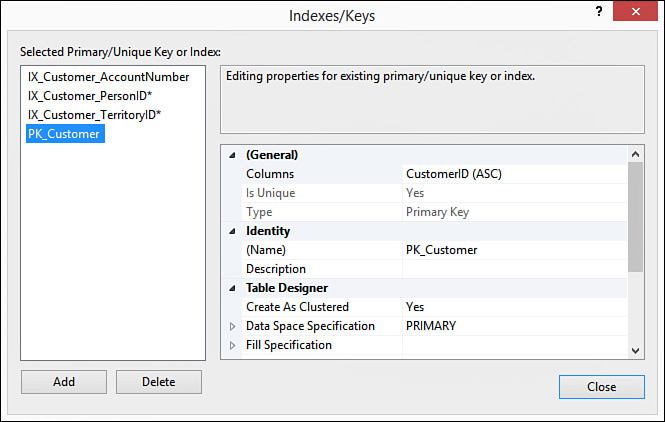
5. Create an index on the field by which you are searching (see Figure 23.13).
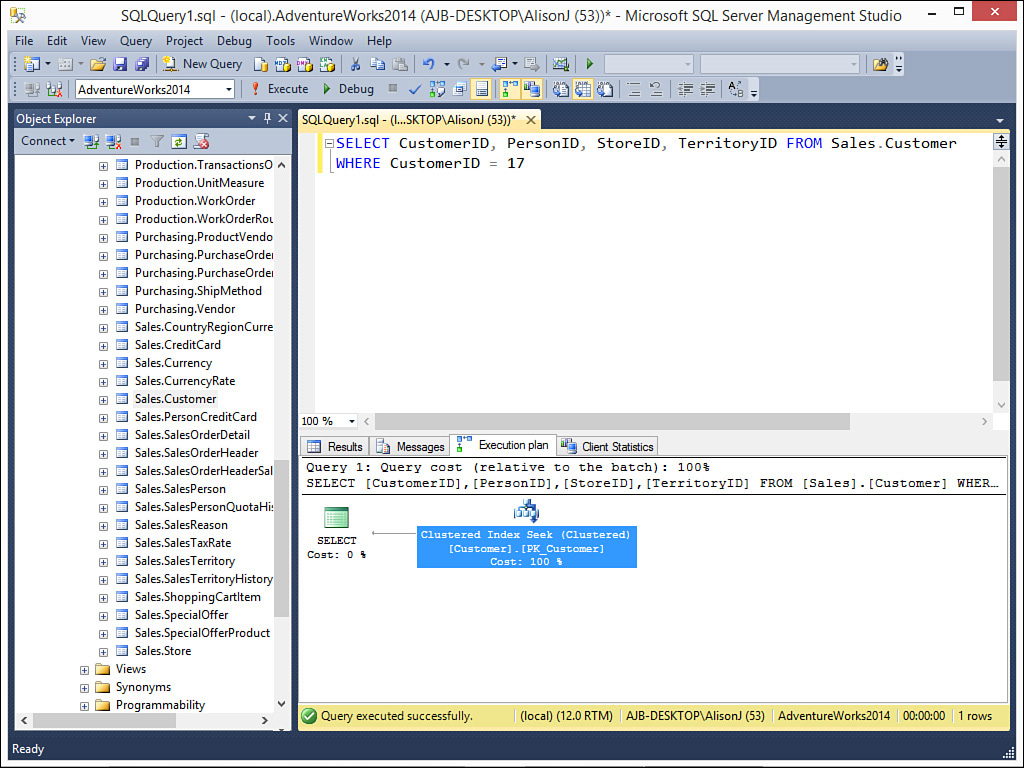
7. Compare the Execution Plan tab. Notice that the execution plan no longer includes a sort and instead includes a clustered index scan (see Figure 23.14).
8. Compare the Client Statistics tab and note the Total execution time. It should be less than the one without index.
Setting Query Options
SQL Server Management Studio provides you with a plethora of options you can use to affect how your queries process. Use the following steps to access and modify these options:
1. Select Query Options from the Query Menu. The Query Options dialog box displays (see Figure 23.15).
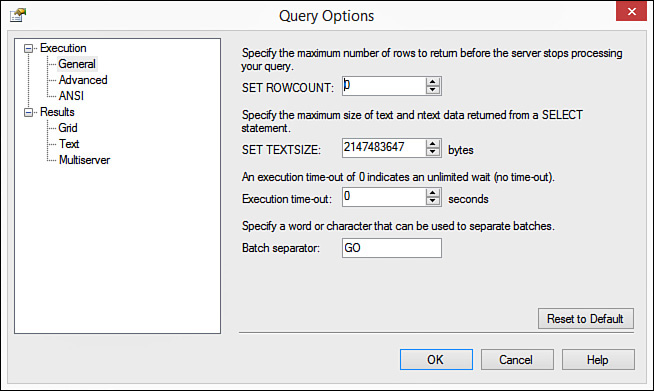
FIGURE 23.15 The Query Options dialog enables you to modify options that affect how your queries process.
2. Using the General page, you can set options, such as determining the maximum number of rows that SQL Server returns before stopping. This valuable setting ensures that you don’t accidentally execute a query that returns millions of rows.
3. Using the Advanced page (see Figure 23.16), you can set additional options. An example is the SET NOCOUNT setting. When turned on, SQL Server refrains from returning the number of rows processed. This improves the performance of your queries.
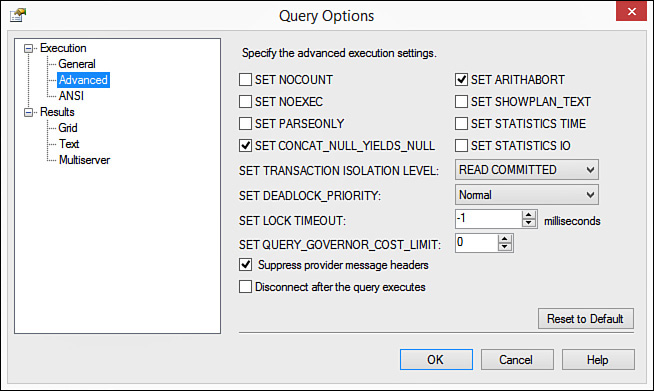
FIGURE 23.16 The Advanced page of the Query Options dialog box enables you to set additional query options.
4. The ANSI page (see Figure 23.17) enables you to set some of the SQL-92 standard query execution behavior. An example is how SQL Server handles nulls.
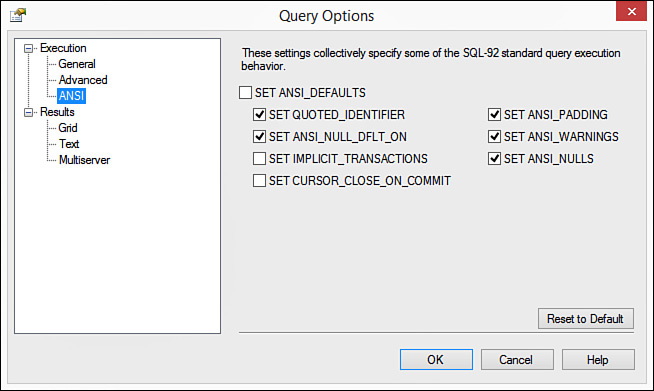
FIGURE 23.17 The ANSI page of the Query Options dialog box enables you to set some of the SQL-92 standard query execution behavior.
5. The Grid page (see Figure 23.18) of the Query Options dialog box enables you to affect how SQL Server displays the output from the query.
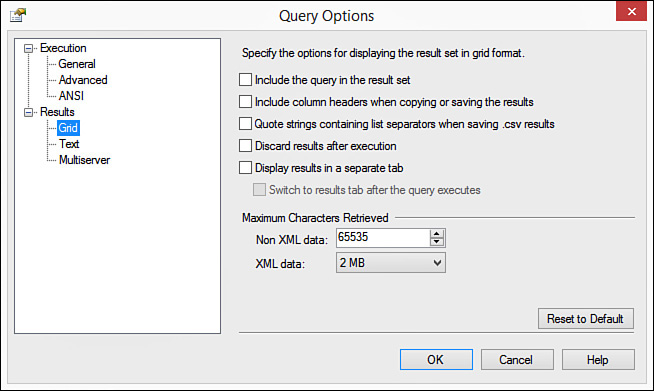
FIGURE 23.18 The Grid page of the Query Options dialog box enables you to affect how SQL Server displays the output from the query.
6. The Text page (see Figure 23.19) of the Query Options dialog enables you to set the options that apply when you opt to display the result set in text format or to redirect it to an output file.
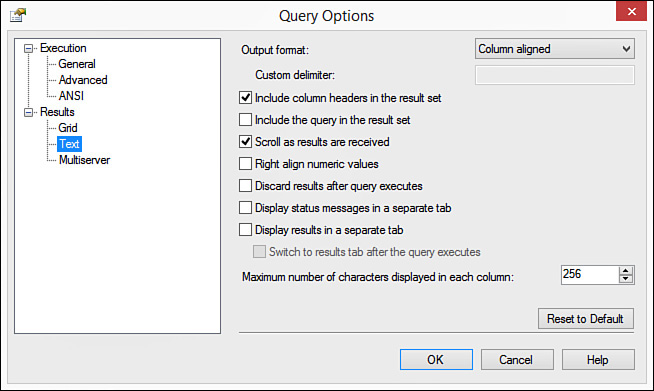
FIGURE 23.19 The Text page of the Query Options dialog enables you to set options that affect you when you display the result set as text.
SQL Server Profiler
A helpful tool when monitoring and analyzing performance is the SQL Server Profiler. Using the SQL Server Profiler, you can monitor the SQL Server environment to determine which SQL statements are negatively affecting performance. The SQL Server Profiler enables you to
![]() Step through problem queries.
Step through problem queries.
![]() Find and diagnose slow-running queries.
Find and diagnose slow-running queries.
![]() Capture a series of SQL statements that are causing a performance bottleneck.
Capture a series of SQL statements that are causing a performance bottleneck.
The steps that follow cover both how to launch the Profiler and how to create a new trace.
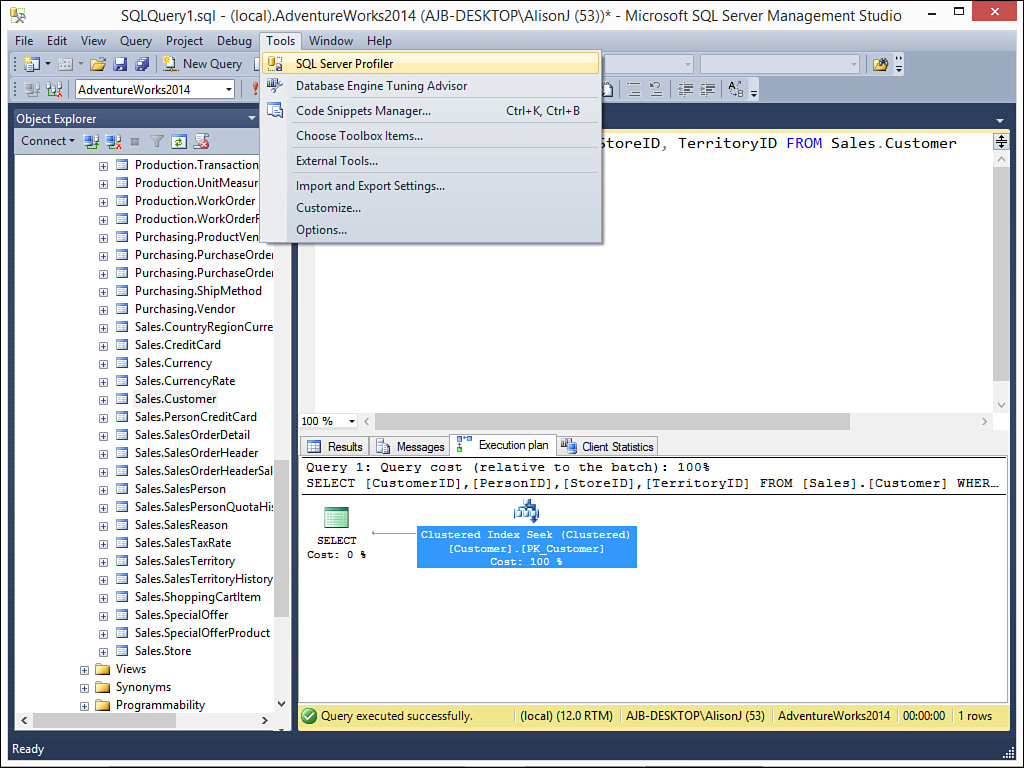
1. To launch the SQL Server Profiler from SQL Server Management Studio, select Tools, SQL Server Profiler (see Figure 23.20). The Profiler opens and prompts you to connect to the server.
2. Enter the required connection information and click Connect. The Profiler appears as in Figure 23.21. You are now ready to designate the properties of the trace you are creating.
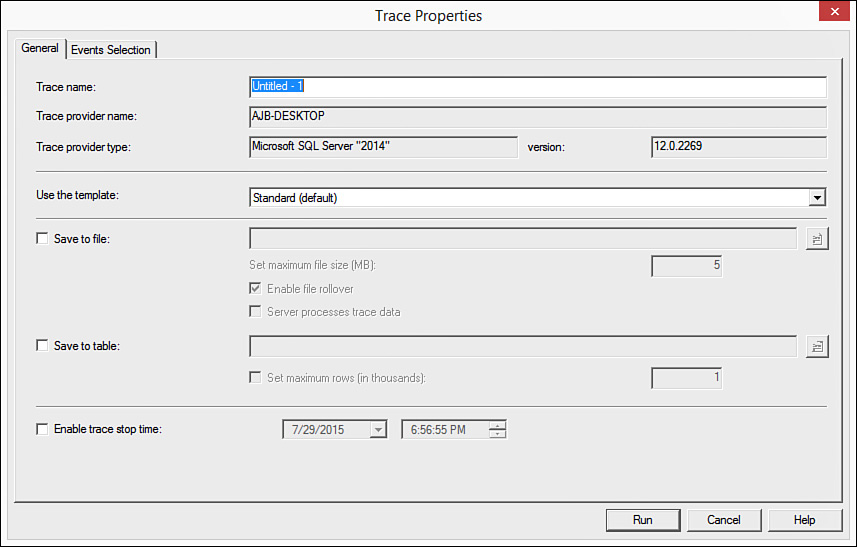
3. Enter a name in the Trace name text box.
4. By default, the trace information displays in a window. You can opt to instead save the trace information to a file or to a table. These options enable you to easily analyze the trace information at a later time.
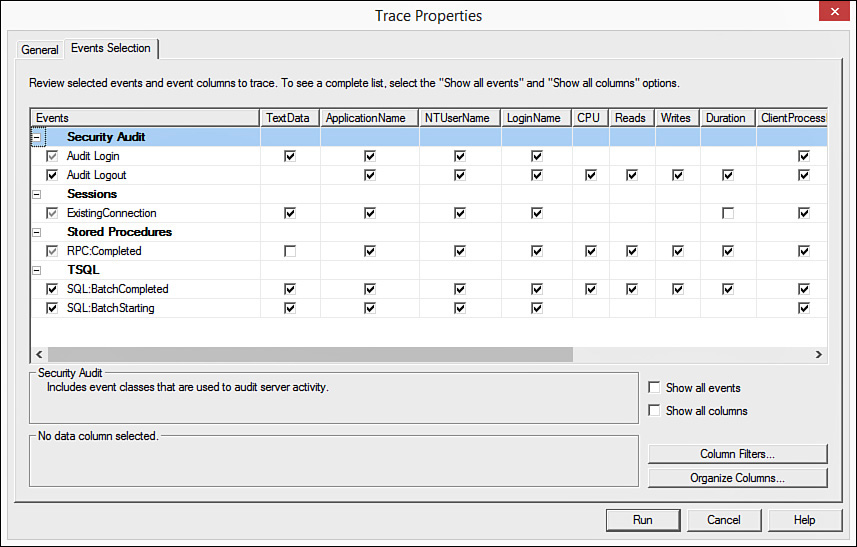
5. Click the Events Selection tab. The Trace Properties dialog box appears as in Figure 23.22. This is where you designate the types of events you want to capture as the trace runs.
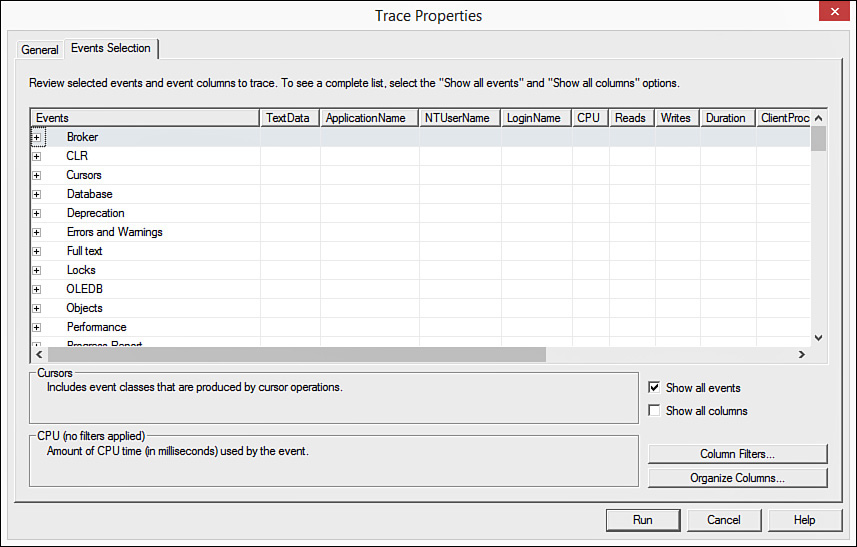
6. The Events listed by default do not include many of the events you will probably want to capture. To show all available events, click the Show All Events check box. The dialog box now appears as in Figure 23.23.
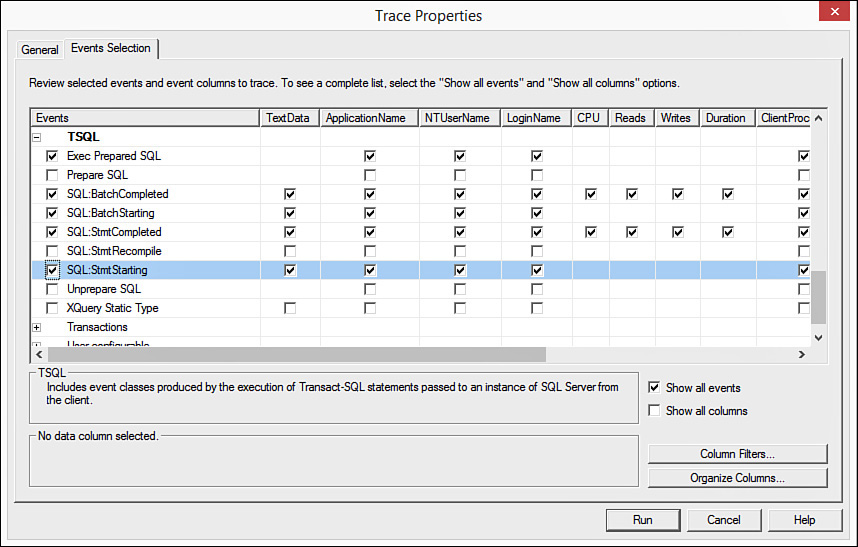
7. Expand and collapse the event groupings to view the various events you want to capture. Figure 23.24 shows the TSQL group expanded with five events selected.
8. Select all the events you want to capture.
9. You will probably want to filter the database whose events you want to trace. To do that, click Show All Columns. The Trace Properties dialog box opens as in Figure 23.25.
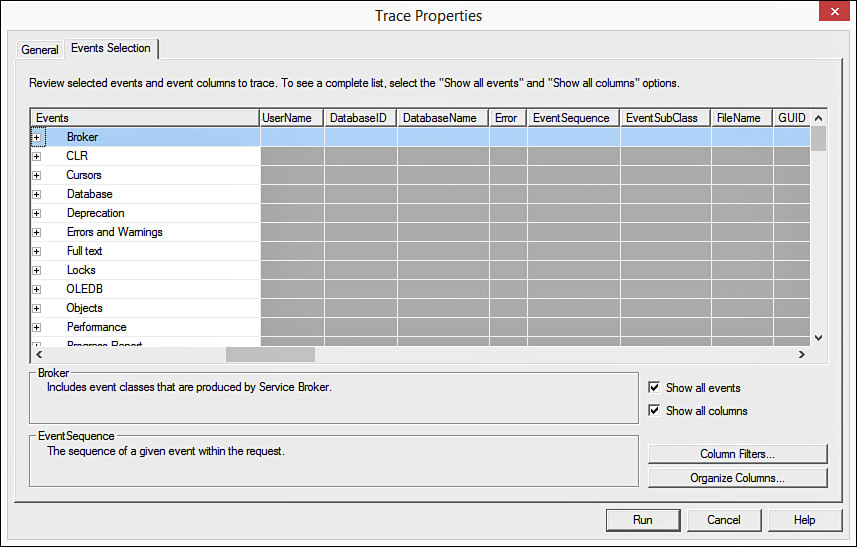
FIGURE 23.25 You must show all columns if you want to filter the trace to activity in a specific database.
10. Click any one of the column headings. The Edit Filter dialog box appears.
11. Click DatabaseName.
12. Enter the name of the database whose events you want to view (see Figure 23.26).
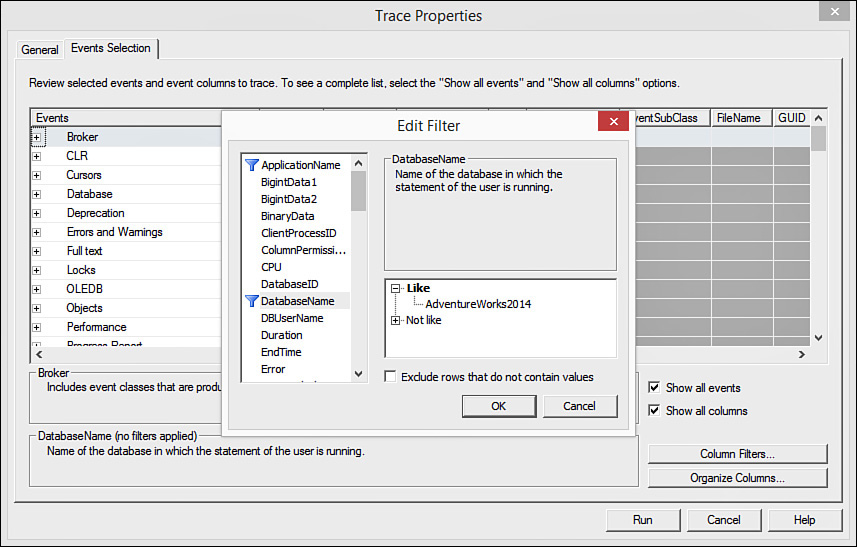
FIGURE 23.26 To filter the trace to activities occurring in a specific database, enter the name of the database.
13. Click OK to close the dialog box.
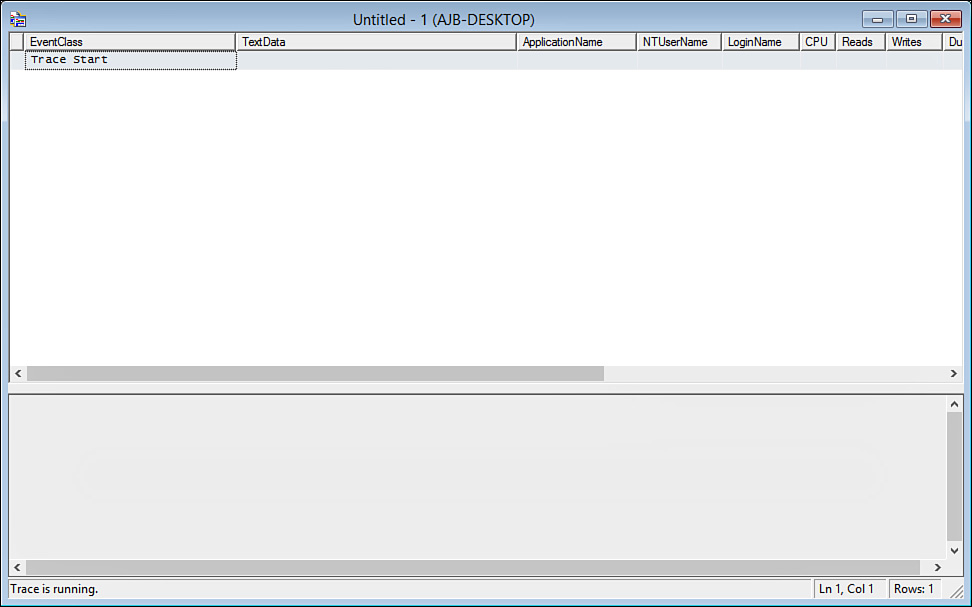
14. When you are ready, click Run to run the trace. The running trace appears as in Figure 23.27.
It is easy to see the effects of the actions you take within your database on the trace output. If, for example, you execute a SQL statement in Management Studio and you have opted to monitor T-SQL events, the results of those events appear in your trace window. Use the following steps to test this out:
1. Create a new query in Management Studio.
2. Enter a SQL statement in the query window.
3. With your trace running, execute the SQL statement (see Figure 23.28).
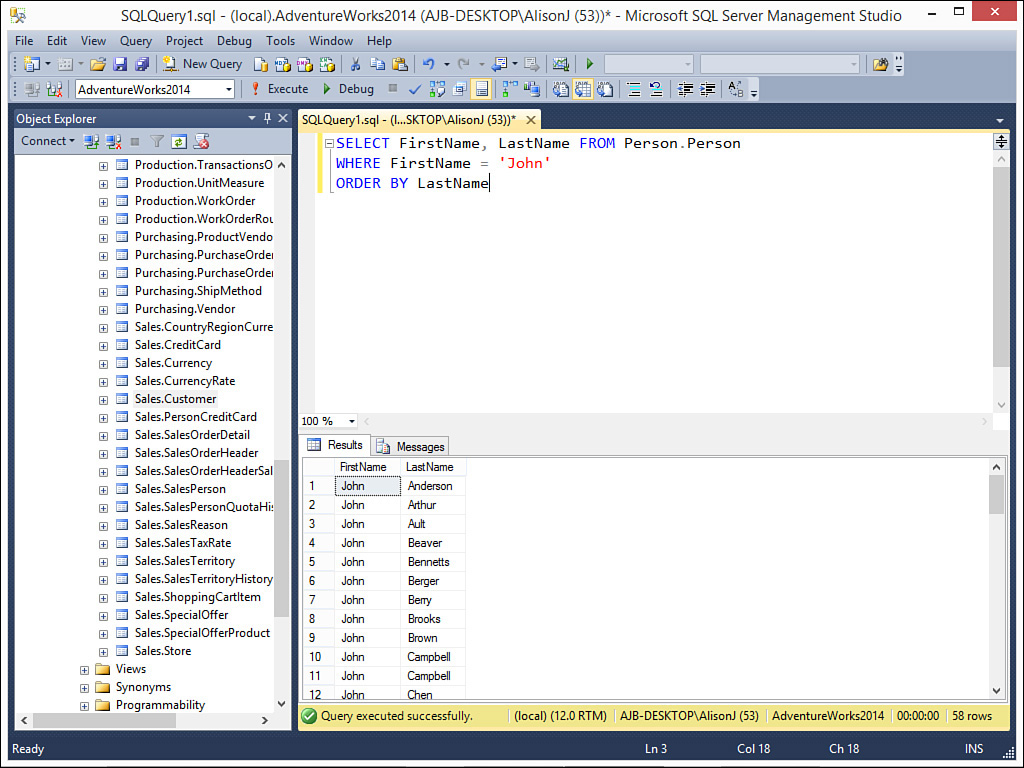
FIGURE 23.28 After you have filtered your events, you must do something that triggers the events you have selected.
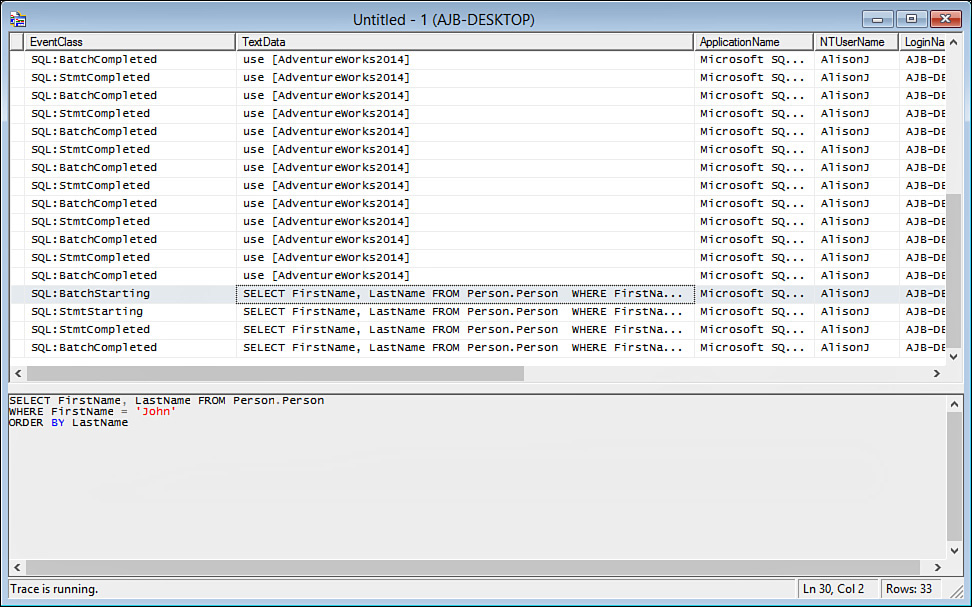
4. Return to the SQL Profiler. The trace window should appear as in Figure 23.29.
5. Click Clear Trace Window at any time to remove all trace information.
6. Click Stop Selected Trace to terminate the trace process.
Summary
Learning how to create queries can be moderately difficult. Learning to create efficient queries is even more difficult. In this lesson, you learned how you can use SQL Server Management Studio to design and test the queries you will include in your stored procedures, triggers, functions, and other objects that use T-SQL. You saw how you can use the tools built into Management Studio to display and analyze the estimated execution plan for a query. You learned how to add indexes to enable queries to execute more efficiently and how to set query options. Finally, you saw how you can use the Query Analyzer to see exactly what is happening when you execute a T-SQL statement.
Q&A
Q. Explain why you will probably want to analyze the queries you include in your stored procedures, functions, and so on.
A. Using the analysis tools built into SQL Server Management Studio, you can analyze your T-SQL statements to ensure that they execute as efficiently as possible. You can modify your queries at will and observe the effect those changes have on performance.
Q. Describe what the SQL Profiler is used for.
A. You use the SQL Profiler to trace selected events that occur when a query, view, stored procedure, or function executes.
Workshop
Quiz
1. Name the tool on the toolbar that enables you to run the query you type into the query window.
2. Name the tool on the toolbar that enables you to view the execution plan each time you run a query.
3. Name the tool on the toolbar that enables you to view client statistics when you run your queries.
4. What is the most important thing you can do to improve query execution?
Quiz Answers
1. New Query
2. Include Actual Execution Plan
3. Include Client Statistics
4. Add indexes
Activities
Build a query based on the Sales.SalesOrderDetail table. Display the SalesOrderID, OrderQty, UnitPrice, and LineTotal, ordering the data by LineTotal. Execute the query. Notice the number of rows affected on the Messages page. Indicate that you want to view both the execution plan and the client statistics. Run the query again. View the results in both the Execution Plan tab and the Client Statistics tab. Add an index based on LineTotal. Finally, re-execute the query, noting the differences in the execution plan and client statistics.