Chapter 2
NX-OS Troubleshooting Tools
This chapter covers the following topics:
Troubleshooting is an art that requires both in-depth knowledge on the subject and the ability to verify operations and isolate the incorrect behavior. If a network problem arises and an engineer has a topology of hundreds or thousands of devices, troubleshooting seems difficult at first glance. When part of the problematic topology is presented, troubleshooting the network issue becomes much easier. Proper tools and the right view of the problematic topology can quickly isolate the problem, thereby reducing large-scale network impact. This chapter focuses on the various tools available on the Nexus platform that can help in troubleshooting and day-to-day operation.
Packet Capture: Network Sniffer
NX-OS provides a command-line interface (CLI) that assists with troubleshooting various complex issues. However, in some scenarios, the show and debug commands do not yield sufficient information to isolate the problematic direction of the packet flow. In such situations, performing a packet capture helps. Forwarding issues require isolating the direction of the problem and understanding whether the packet is actually reaching the far end device. Understanding the packet flow between two directly connected devices requires taking three perspectives:
Determining whether the originating router is transmitting the packet across the network medium
Determining whether the packet is being received on the destination router
Examining packets flowing across the network medium
This is where concept of network sniffing comes into play. Network sniffing is the technique of intercepting the traffic that passes over the transmission medium for the protocol and for deep packet analysis. Not only does packet sniffing help with troubleshooting packet forwarding issues, but security experts also heavily use it to perform deep analysis of the network and find security holes.
Performing a network sniffer capture requires a PC with a packet capture tool, such as Wireshark, attached to the switch. A mirror copy of the relevant traffic is copied and sent to the destination interface, where it is captured by the packet capture tool and is available for analysis. Figure 2-1 shows a Nexus switch connected between two routers and a capture PC that has Wireshark installed to capture the traffic flowing between routers R1 and R2.
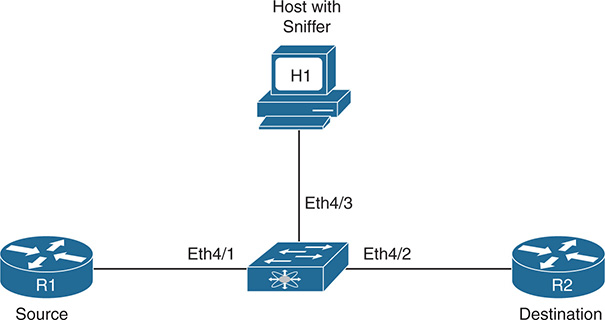
Figure 2-1 Sniffer Setup on Nexus Switch
On Cisco devices, the sniffing capability is called a Switched Port Analyzer (SPAN) feature. The source port is called the monitored port and the destination port is called the monitoring port. The SPAN feature on NX-OS is similar in Cisco IOS, but different Nexus switches have different capabilities, based on the hardware support. The following source interfaces can be used as SPAN source interfaces:
Ethernet
Fabric Expander (FEX) ports/Fabric port-channels
Port-channel
VLAN, or VLAN-based SPAN (VSPAN)
Remote SPAN (RSPAN) VLAN
Inband interfaces to the control plane CPU (on Nexus 7000, this feature is supported only on default virtual device context [VDC])
FCoE ports
Note
These features can vary on each Nexus platform, based on the hardware support. The number of active sessions and the source and destination interfaces per session vary on different Nexus platforms. Be sure to verify relevant Cisco documentation before configuring a SPAN session on any Nexus switch.
To enable a port to forward the spanned traffic to the capture PC, the destination interface is enabled for monitoring with the interface parameter command switchport monitor. The destination ports are either an Ethernet or Port-Channel interface configured in access or trunk mode. The SPAN session is configured using the command monitor session session-number, under which the source interface is specified with the command source interface interface-id [rx|tx|both]. The rx option is used to capture the ingress (incoming) traffic, whereas the tx option is used to capture the egress (outgoing) traffic. By default, the option is set to both, which captures both ingress and egress traffic on the configured source interface. The destination interface is specified with the command destination interface interface-id. By default, the monitor session is in shutdown state and must be manually un-shut for the SPAN session to function.
Note
The SPAN features can vary across different Nexus platforms. For instance, features such as SPAN-on-Drop and SPAN-on-Latency are supported on Nexus 5000 and Nexus 6000 series but not on Nexus 7000 series. Refer to the platform documentation for more about the feature support.
Example 2-1 illustrates a SPAN session configuration on a Nexus switch. Notice that, in this example, the source interface is a range of interfaces, along with the direction of the capture.
Example 2-1 SPAN Configuration on NX-OS
NX-1(config-if)# switchport
NX-1(config-if)# switchport monitor
NX-1(config-if)# no shut
NX-1(config)# monitor session 1
NX-1(config-monitor)# source interface Ethernet4/1-2 both
NX-1(config-monitor)# source interface Ethernet5/1 rx
NX-1(config-monitor)# destination interface Ethernet4/3
NX-1(config-monitor)# no shut
NX-1(config-monitor)# exit
Note
On FCoE ports, the SPAN destination interface is configured with the command switchport mode SD, which is similar to the command switchport monitor.
Example 2-2 displays the status of the monitor session. In this example, the rx, tx, and both fields are populated for interface Eth4/1 and Eth4/2, but the interface Eth5/1 is listed only for the rx direction. There is also an option to filter VLANS under the monitor session using the filter vlan vlan-id command.
Example 2-2 Verifying SPAN Session
session 1
---------------
type : local
state : up
source intf :
rx : Eth4/1 Eth4/2 Eth5/1
tx : Eth4/1 Eth4/2
both : Eth4/1 Eth4/2
source VLANs :
rx :
tx :
both :
filter VLANs : filter not specified
destination ports : Eth4/3
Legend: f = forwarding enabled, l = learning enabled
The default behavior of a SPAN session is to mirror all traffic to the destination port, but NX-OS also provides the capability to perform a filter on the traffic to be mirrored to the destination port. To filter the relevant traffic, an access control list (ACL) is created, to be referenced in the SPAN session configuration by using the filter access-group acl command. Example 2-3 illustrates the filtering configuration on the SPAN session and verification using the show monitor session command.
Note
ACL filtering varies on different Nexus platforms. Refer to the CCO documentation for ACL filtering support on respective Nexus platforms.
Example 2-3 Filtering SPAN Traffic: Configuration and Verification
NX-1(config-acl)# permit ip 100.1.1.0/24 200.1.1.0/24
NX-1(config-)# exit
NX-1(config)# monitor session 1
NX-1(config-monitor)# filter access-group TEST-ACL
NX-1(config-monitor)# exit
NX-1# show monitor session 1
session 1
---------------
type : local
state : up
acl-name : TEST-ACL
source intf :
rx : Eth4/1 Eth4/2 Eth5/1
tx : Eth4/1 Eth4/2
both : Eth4/1 Eth4/2
source VLANs :
rx :
tx :
both :
filter VLANs : filter not specified
destination ports : Eth4/3
Legend: f = forwarding enabled, l = learning enabled
Note
Nexus platforms do not support Remote SPAN (RSPAN).
Encapsulated Remote SPAN
Encapsulated Remote SPAN (ERSPAN) is a SPAN feature in which the SPAN traffic is encapsulated to IP-GRE frame format, to support remote monitoring traffic over an IP network. ERSPAN enables monitoring of multiple remote switches across the network—that is, the ERSPAN spans traffic from source ports across multiple switches to the destination switch, where a network analyzer is connected. An ERSPAN session consists of the following components:
ERSPAN ID
ERSPAN source session
GRE-encapsulated traffic
ERSPAN destination session
The ERSPAN ID is used to distinguish among multiple source devices, sending spanned traffic to one single centralized server.
Figure 2-2 shows a network topology with ERSPAN setup. Two Nexus switches are connected by a routed network. The N6k-1 switch is configured as the ERSPAN-source with a local source SPAN port, and the destination port is located in an IP network on the N7k-1 switch. The GRE-encapsulated packets are transmitted across the IP network toward the destination switch, where they are decapsulated and sent to the traffic analyzer.
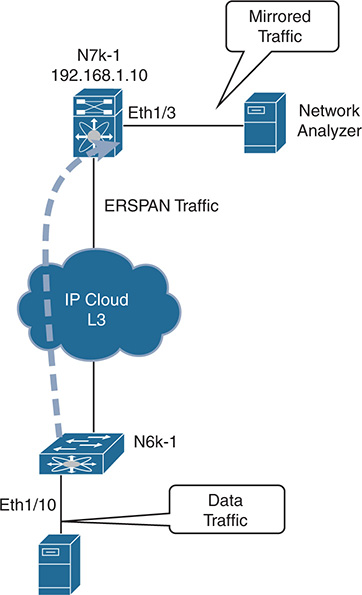
Figure 2-2 ERSPAN Deployment
The source and destination sessions can be configured on different switches separately for the source traffic in ingress, egress, or both directions. The ERSPAN is configured to span traffic on Ethernet ports, VLANs, VSANs, and FEX ports. The destination port remains in monitoring state and does not participate in the spanning tree or any Layer 3 protocols. Example 2-4 illustrates the configuration of both the source ports and destination ports on two different Nexus switches. Note that the ERSPAN-ID should be the same on both switches.
Example 2-4 ERSPAN Configuration
N6k-1(config-erspan-src)# erspan-id 20
N6k-1(config-erspan-src)# vrf default
N6k-1(config-erspan-src)# destination ip 192.168.1.10
N6k-1(config-erspan-src)# source interface ethernet 1/10
N6k-1(config-erspan-src)# no shut
N6k-1(config-erspan-src)# exit
N6k-1(config)# monitor erspan origin ip-address 192.168.1.1 global
N7k-1(config-erspan-dst)# erspan-id 10
N7k-1(config-erspan-dst)# source ip 192.168.1.10
N7k-1(config-erspan-dst)# destination interface e1/3
N7k-1(config-erspan-dst)# no shut
For the ERSPAN source session to come up, the destination IP should be present in the routing table. The ERSPAN session status is verified using the command show monitor session session-id. Example 2-5 demonstrates the verification of both the source and destination ERSPAN sessions.
Example 2-5 ERSPAN Session Verification
session 10
---------------
type : erspan-source
state : up
erspan-id : 20
vrf-name : default
destination-ip : 192.168.1.10
ip-ttl : 255
ip-dscp : 0
acl-name : acl-name not specified
origin-ip : 192.168.1.1 (global)
source intf :
rx : Eth1/10
tx : Eth1/10
both : Eth1/10
source VLANs :
rx :
source VSANs :
rx :
N7k-1# show monitor session 10
session 10
---------------
type : erspan-destination
state : up
erspan-id : 10
source-ip : 192.168.1.10
destination ports : Eth1/3
Legend: f = forwarding enabled, l = learning enabled
Note
Refer to the Cisco documentation before configuring ERSPAN on any Nexus switch, to verify any platform limitations.
SPAN on Latency and Drop
Both SPAN and ERSPAN provide the capability to apply filters to SPAN-specific traffic based on protocol and IP addressing. Often users or applications report high latency or experience traffic drops between the source and destination, making it hard to figure out where the drop is happening. In such instances, gaining visibility of traffic that is impacting users is always helpful during troubleshooting and can both minimize the service impact and speed up the troubleshooting process.
NX-OS provides the capability to span the traffic based on the specified latency thresholds or based on drops noticed in the path. These capabilities are available for both SPAN and ERSPAN.
SPAN-on-Latency
The SPAN-on-Latency (SOL) feature works a bit differently than the regular SPAN session. In SOL, the source port is the egress port on which latency is monitored. The destination port is still the port where the network analyzer is connected on the switch. The latency threshold is defined on the interface that is being monitored using the command packets latency threshold threshold-value. When the packets cross or exceed the specified threshold, the SPAN session is triggered and captures the packets. If the threshold value is not specified under the interface, the value is truncated to the nearest multiple of 8.
Example 2-6 illustrates the SOL configuration, in which packets are sniffed only at the egressing interface Eth1/1 and Eth1/2 for flows that have latency more than 1μs (microsecond). The packet latency threshold configuration is per port for 40G interfaces but if there are 4x10G interfaces, they share the same configuration. For this reason, Example 2-6 displays the log message that interfaces Eth1/1 to Eth1/4 are configured with a latency threshold of 1000 ns.
Example 2-6 SPAN-on-Latency Configuration
N6k-1(config-span-on-latency)# source interface ethernet 1/1-2
N6k-1(config-span-on-latency)# destination interface ethernet 1/3
N6k-1(config-span-on-latency)# no shut
N6k-1(config-span-on-latency)# exit
N6k-1(config)# interface eth1/1-2
N6k-1(config-if-range)# packet latency threshold 1000
Interfaces Eth1/1, Eth1/2, Eth1/3 and Eth1/4 are configured with latency
threshold 1000
The SOL-ERSPAN is configured by specifying the type as span-on-latency-erspan in the monitor session command.
The few limitations with the SOL or SOL-ERSPAN are as follows:
Only the Ethernet source is supported. Port-channel is not supported as the source port.
The source cannot be part of any other session.
The direction of SPAN is not allowed with SOL.
ACL filtering is not supported with SOL.
SPAN-on-Drop
SPAN-on-Drop is a new feature that enables the spanning of packets that were dropped because of unavailable buffer or queue space upon ingress. This feature provides the capability to span packets that would otherwise be dropped because the copy of the spanned traffic is transferred to a specific destination port. A SPAN-on-Drop session is configured by specifying the type as span-on-drop in the monitor session configuration. Example 2-7 demonstrates the SPAN-on-Drop monitor session configuration. The source interface Eth1/1 specified in the configuration is the interface where congestion is present.
Example 2-7 SPAN-on-Drop Configuration
N6k-1(config-span-on-latency)# source interface ethernet 1/1
N6k-1(config-span-on-latency)# destination interface ethernet 1/3
N6k-1(config-span-on-latency)# no shut
N6k-1(config-span-on-latency)# exit
Note
The SPAN-on-Drop feature captures only drops in unicast flows that result from buffer congestion.
Unlike other SPAN features, SPAN-on-Drop does not have any ternary content addressable memory (TCAM) programming involved. Programming for the source side is in the buffer or queue space. Additionally, only one instance of SPAN-on-Drop can be enabled on the switch; enabling a second instance brings down the session with the syslog message “No hardware resource error.” If the SPAN-on-Drop session is up but no packets are spanned, it is vital to verify that the drop is happening in the unicast flow. This is verified by using the command show platform software qd info interface interface-id and checking that the counter IG_RX_SPAN_ON_DROP is incrementing and is nonzero. Example 2-8 shows the output for the counter IG_RX_SPAN_ON_DROP, confirming that no drops are occurring in the unicast flows.
Example 2-8 Verifying Ingress L3 Unicast Flow Drops
BM-INGRESS BM-EGRESS
-------------------------------------------------------------------------------
IG_RX 364763|TX 390032
SP_RX 1491|TX_MCAST 0
LB_RX 15689|CRC_BAD 0
IG_RX_SPAN_ON_DROP 0|CRC_STOMP 0
IG_RX_MCAST 14657|DQ_ABORT_MM_XOFF_DROP 0
LB_RX_SPAN 15689|MTU_VIO 0
IG_FRAME_DROP 0|
SP_FRAME_DROP 0|
LB_FRAME_DROP 0|
IG_FRAME_QS_EARLY_DROP 0|
ERR_IG_MTU_VIO 0|
ERR_SP_MTU_VIO 0|
ERR_LB_MTU_VIO 0|
SPAN-on-Drop ERSPAN is an extension of the SPAN-on-Drop feature in which the dropped frames are spanned and sent to a remote IP where the network analyzer is attached.
Note
At the time of writing, SOL and SPAN-on-Drop are supported only on Nexus 5600 and Nexus 6000 series switches.
Nexus Platform Tools
Nexus switches are among the most powerful data center switches in the industry. This is partly because of the CPU and memory available in the switch, but also because of the wide range of integrated tools that the NX-OS offers. These tools provide the capability to capture packets at different ASIC levels within the switch and help verify both hardware programming and the action taken by the hardware or the software on the packet under investigation. Some of these tools include the following:
Ethanalyzer
Embedded Logic Analyzer Module (ELAM)
Packet Tracer
These tools are capable of performing packet capture for the traffic destined for the CPU or transit hardware-switched traffic. They are helpful in understanding the stages the packet goes through in a switch, which helps narrow down the issue very quickly. The main benefit of these features is that they do not require time to set up an external sniffing device.
Note
The ELAM capture is supported on all Nexus switches, but because it requires deeper understanding of the ASICs and the configuration differs among Nexus platforms, it is outside the scope of this book. Additionally, ELAM is best performed under the supervision of a Cisco Technical Assistance Center (TAC) engineer. ELAM also is not supported on N5000 or N5500 switches.
Ethanalyzer
Ethanalyzer is an NX-OS implementation of TShark, a terminal version of Wireshark. TShark uses the libpcap library, which gives Ethanalyzer the capability to capture and decode packets. It can capture inband and management traffic on all Nexus platforms. Ethanalyzer provides the users with the following capabilities:
Capture packets sent and received by the switch Supervisor CPU
Define the number of packets to be captured
Define the length of the packets to be captured
Display packets with very detailed protocol information or a one-line summary
Open and save captured packet data
Filter packets capture on many criteria (capture filter)
Filter packets to be displayed on many criteria (display filter)
Decode the internal header of control packet
Avoid the requirement of using an external sniffing device to capture the traffic
Ethanalyzer does not allow hardware-switched traffic to be captured between data ports of the switch. For this type of packet capture, SPAN or ELAM is used. When the interfaces are configured with ACLs with ACEs configured with the log option, the hardware-switched flows gets punted to the CPU and thus are captured using Ethanalyzer. However, this should not be tried in production because the packets could get dropped as a result of CoPP policies or the excessive traffic punted to the CPU could impact other services on the device.
Ethanalyzer is configured in three simple steps:
Step 1. Define capture interface.
Step 2. Define Filters: Set the capture filter or display filter.
Step 3. Define the stop criteria.
There are three kinds of capture interfaces:
Mgmt: Captures traffic on the Mgmt0 interface of the switch
Inbound-hi: Captures high-priority control packets on the inband, such as Spanning Tree Protocol (STP), Link Aggregation Control Protocol (LACP), Cisco Discovery Protocol (CDP), Data Center Bridging Exchange (DCBX), Fiber Channel, and Fiber Channel over Ethernet (FCOE)
Inbound-low: Captures low-priority control packets on the inband, such as Internet Group Management Protocol (IGMP), Transmission Control Protocol (TCP), User Datagram Protocol (UDP), Internet Protocol (IP), and Address Resolution Protocol (ARP) traffic
The next step is to set the filters. With a working knowledge of Wireshark, configuring filters for Ethanalyzer is fairly simple. Two kinds of filters can be set up for configuring Ethanalyzer: capture filter and display filter. As the name suggests, when a capture filter is set, only frames that match the filter are captured. The display filter is used to display the packets that match the filter from the captured set of packets. That means Ethanalyzer captures other frames that do not match the display filter but are not displayed in the output. By default, Ethanalyzer supports capturing up to 10 frames and then stops automatically. This value is changed by setting the limit-captured-frames option, where 0 means no limit.
Note
All in-band Ethernet ports that send or receive data to the switch supervisor are captured with the inbound-hi or inbound-low option. However, display or capture filtering can be applied.
Ethanalyzer is part of the software running on the supervisor, so it is important to understand its effects on the supervisor’s CPU. Normally, Ethanalyzer does not have much impact, but sometimes it can increase the CPU utilization up to 5%. Utilization can be reduced by 1% to 2% by saving the capture data in a file using the write option with Ethanalyzer to save the capture in a file.
To start a packet capture with Ethanalyzer, use the command ethanalyzer local interface [inbound-hi | inbound-lo | mgmt] options, with the following options:
Autostop: Capture autostop condition
capture-filter: Filter on Ethanalyzer capture
capture-ring-buffer: Capture ring buffer option
decode-internal: Include internal system header decoding
detail: Display detailed protocol information
display-filter: Display filter on frames captured
limit-captured-frames: Indicates the maximum number of frames to be captured
limit-frame-size: Capture only a subset of a frame
write: Identifies the filename to save capture to
While using Ethanalyzer, specifying the filters is easier for someone who is familiar with Wireshark filters. The syntax for both the capture filter and the display filter is different. Table 2-1 lists some of the common filters and their syntax with the capture-filter and display-filter options.
Table 2-1 Ethanalyzer Capture and Display Filters
|
Capture Filter |
Display Filter |
Operators |
|
And - && Or - || Equal - == Not equal - != |
VLAN |
vlan vlan-id |
vlan.id==vlan-id |
Layer 2 |
ether host 00:AA:BB:CC:DD:EE ether dst 00:AA:BB:CC:DD:EE ether src 00:AA:BB:CC:DD:EE ether broadcast ether multicast ether proto protocol |
eth.addr==00:AA:BB:CC:DD:EE eth.src==00:AA:BB:CC:DD:EE eth.dst==00:AA:BB:CC:DD:EE Match first 2 bytes: eth.src[0:1]==00:AA Filter on manufacturer: eth.src[0:2]==vendor-mac-addr e.g., Cisco: eth.src[0:2]==00.00.0c eth.addr contains aa:bb:cc |
Layer 3 |
ip (filters out lower-level protocols such as ARP and STP) host 192.168.1.1 dst host 192.168.1.1 src host 192.168.1.1
net 192.168.1.0/24 net 192.168.1.0 netmask 24 src net 192.168.1.0/24 dst net 192.168.1.0/24 ip broadcast ip multicast not broadcast not multicast icmp udp tcp ip proto 6 (udp) ip proto 17 (tcp) ip proto 1 (icmp)
Packet length: less length greater length |
IP address: ip.addr==192.168.1.1
Source IP: ip.src==192.168.1.1
Dest IP: ip.dst==192.168.10.1
Subnet: ip.addr==192.168.1.0/24
Fragmentation: Filter on DF bit set (0 = may fragment) ip.flags.df==1
TCP Sequence: tcp.seq==TCP-Seq-Num |
Layer 4 |
udp port 53 udp dst port 53 udp src port 53 tcp port 179 tcp portrange 2000-2100 |
tcp.port==53 udp.port==53 |
FabricPath |
proto 0x8903 |
Dest HMAC/MC destination: cfp.d_hmac==mac cfp.d_hmac_mc==mac
EID/FTAG/IG Bit: cfp.eid== cfp.ftag== cfp.ig==
Source LID/OOO/DL Bit/Source HMAC: cfp.lid== cfp.ooodl== cfp.s_hmac==
Subswitch ID/Switch ID/TTL: cfp.sswid== cfp.swid== cfp.ttl== |
ICMP |
icmp |
icmp==icmp-type
ICMP-Types: icmp-echoreply icmp-unreach icmp-sourcequench icmp-redirect icmp-echo icmp-routeradvert icmp-routersolicit icmp-timxceed icmp-paramprob icmp-tstamp icmp-tstampreply icmp-ireq icmp-ireqreply icmp-maskreq icmp-maskreply |
Example 2-9 illustrates the use of Ethanalyzer to capture all packets hitting the inbound-low as well as inbound-hi queue on Nexus 6000. From the following outputs, notice that the TCP SYN/SYN ACK packets even for a BGP peering are part of the inbound-low queue, but the regular BGP updates and keepalives (such as the TCP packets after the BGP peering is established) and the acknowledgements are part of the inband-hi queue.
Example 2-9 Ethanalyzer Capture
Capturing on inband
2017-05-21 21:26:22.972623 10.162.223.33 -> 10.162.223.34 TCP bgp > 45912 [SYN,
ACK] Seq=0 Ack=0 Win=16616 Len=0 MSS=1460
2017-05-21 21:26:33.214254 10.162.223.33 -> 10.162.223.34 TCP bgp > 14779 [SYN,
ACK] Seq=0 Ack=0 Win=16616 Len=0 MSS=1460
2017-05-21 21:26:44.892236 8c:60:4f:a7:9a:6b -> 01:00:0c:cc:cc:cc CDP Device ID:
N6k-1(FOC1934R1BF) Port ID: Ethernet1/4
2017-05-21 21:26:44.892337 8c:60:4f:a7:9a:68 -> 01:00:0c:cc:cc:cc CDP Device ID:
N6k-1(FOC1934R1BF) Port ID: Ethernet1/1
2017-05-21 21:27:42.965431 00:25:45:e7:d0:00 -> 8c:60:4f:a7:9a:bc ARP 10.162.223
.34 is at 00:25:45:e7:d0:00
Capturing on inband
2017-05-21 21:34:42.821141 10.162.223.34 -> 10.162.223.33 BGP KEEPALIVE Message
2017-05-21 21:34:42.932217 10.162.223.33 -> 10.162.223.34 TCP bgp > 14779 [ACK]
Seq=1 Ack=20 Win=17520 Len=0
2017-05-21 21:34:43.613048 10.162.223.33 -> 10.162.223.34 BGP KEEPALIVE Message
2017-05-21 21:34:43.814804 10.162.223.34 -> 10.162.223.33 TCP 14779 > bgp [ACK]
Seq=20 Ack=20 Win=15339 Len=0
2017-05-21 21:34:46.005039 10.1.12.2 -> 224.0.0.5 OSPF Hello Packet
2017-05-21 21:34:46.919884 10.162.223.34 -> 10.162.223.33 BGP KEEPALIVE Message
2017-05-21 21:34:47.032215 10.162.223.33 -> 10.162.223.34 TCP bgp > 14779 [ACK]
Seq=20 Ack=39 Win=17520 Len=0
As stated earlier, optimal practice is to write the captured frames in a file and then read it after the frames are captured. The saved file in a local bootflash is read using the command ethanalyzer local read location [detail].
Nexus 7000 offers no option for inbound-hi or inbound-low. The CLI supports captures on the mgmt interface or the inband interface. The inband interface captures both high- and low-priority packets. Example 2-10 illustrates how to write and read the saved packet capture data. In this example, Ethanalyzer is run with a capture-filter on STP packets.
Example 2-10 Ethanalyzer Write and Read
bootflash:stp.pcap
Capturing on inband
2017-05-21 23:48:30.216952 5c:fc:66:6c:f3:f6 -> Spanning-tree-(for-bridges)_00
STP 60 RST. Root = 4096/1/50:87:89:4b:bb:42 Cost = 0 Port = 0x9000
2017-05-21 23:48:30.426556 38:ed:18:a2:27:b0 -> Spanning-tree-(for-bridges)_00
STP 60 RST. Root = 4096/1/50:87:89:4b:bb:42 Cost = 1 Port = 0x8201
2017-05-21 23:48:30.426690 38:ed:18:a2:27:b0 -> Spanning-tree-(for-bridges)_00
STP 60 RST. Root = 4096/1/50:87:89:4b:bb:42 Cost = 1 Port = 0x8201
2017-05-21 23:48:30.426714 38:ed:18:a2:17:a6 -> Spanning-tree-(for-bridges)_00
Frame 1: 60 bytes on wire (480 bits), 60 bytes captured (480 bits)
Encapsulation type: Ethernet (1)
Arrival Time: May 21, 2017 23:48:30.216952000 UTC
[Time shift for this packet: 0.000000000 seconds]
Epoch Time: 1495410510.216952000 seconds
[Time delta from previous captured frame: 0.000000000 seconds]
[Time delta from previous displayed frame: 0.000000000 seconds]
[Time since reference or first frame: 0.000000000 seconds]
Frame Number: 1
Frame Length: 60 bytes (480 bits)
Capture Length: 60 bytes (480 bits)
[Frame is marked: False]
[Frame is ignored: False]
[Protocols in frame: eth:llc:stp]
IEEE 802.3 Ethernet
Destination: Spanning-tree-(for-bridges)_00 (01:80:c2:00:00:00)
Address: Spanning-tree-(for-bridges)_00 (01:80:c2:00:00:00)
.... ..0. .... .... .... .... = LG bit: Globally unique address (factory
default)
.... ...1 .... .... .... .... = IG bit: Group address (multicast/broadcast)
Source: 5c:fc:66:6c:f3:f6 (5c:fc:66:6c:f3:f6)
Address: 5c:fc:66:6c:f3:f6 (5c:fc:66:6c:f3:f6)
.... ..0. .... .... .... .... = LG bit: Globally unique address (factory
default)
.... ...0 .... .... .... .... = IG bit: Individual address (unicast)
Length: 39
Padding: 00000000000000
Logical-Link Control
DSAP: Spanning Tree BPDU (0x42)
IG Bit: Individual
SSAP: Spanning Tree BPDU (0x42)
CR Bit: Command
Control field: U, func=UI (0x03)
000. 00.. = Command: Unnumbered Information (0x00)
.... ..11 = Frame type: Unnumbered frame (0x03)
Spanning Tree Protocol
Protocol Identifier: Spanning Tree Protocol (0x0000)
Protocol Version Identifier: Rapid Spanning Tree (2)
BPDU Type: Rapid/Multiple Spanning Tree (0x02)
BPDU flags: 0x3c (Forwarding, Learning, Port Role: Designated)
0... .... = Topology Change Acknowledgment: No
.0.. .... = Agreement: No
.... ..0. = Proposal: No
.... ...0 = Topology Change: No
Root Bridge System ID Extension: 1
Root Bridge System ID: 50:87:89:4b:bb:42 (50:87:89:4b:bb:42)
Root Path Cost: 0
Bridge System ID Extension: 1
Bridge System ID: 50:87:89:4b:bb:42 (50:87:89:4b:bb:42)
Port identifier: 0x9000
Message Age: 0
Max Age: 20
Hello Time: 2
Forward Delay: 15
Version 1 Length: 0
The saved .pcap file can also be transferred to a remote server via File Transfer Protocol (FTP), Trivial File Transfer Protocol (TFTP), Secure Copy Protocol (SCP), Secure FTP (SFTP), and Universal Serial Bus (USB), after which it can be easily analyzed using a packet analyzer tool such as Wireshark.
Note
If multiple VDCs exist on the Nexus 7000, the Ethanalyzer runs only on the admin or default VDC. In addition, starting with Release 7.2 on Nexus 7000, you can use the option to filter on a per-VDC basis.
Packet Tracer
During troubleshooting, it becomes difficult to understand what action the system is taking on a particular packet or flow. For such instances, the packet tracer feature is used. Starting with NX-OS Version 7.0(3)I2(2a), the packet tracer utility was introduced on the Nexus 9000 switch. It is used when intermittent or complete packet loss is observed.
Note
At the time of writing, the packet tracer utility is supported only on the line cards or fabric modules that come with Broadcom Trident II ASICs. More details about the Cisco Nexus 9000 ASICs can be found at http://www.cisco.com.
The packet tracer is configured in two simple steps:
Step 1. Define the filter.
Step 2. Start the packet tracer.
To set up the packet tracer, use the command test packet-tracer [src-ip src-ip | dst-ip dst-ip ] [protocol protocol-num | l4-src-port src-port | l4-dst-port dst-port]. Then start the packet tracer, using the command test packet-tracer start. To view the statistics of the specified traffic and the action on it, use the command test packet-tracer show. Finally, stop the packet tracer using the command test packet-tracer stop. Example 2-11 illustrates the use of the packet tracer to analyze the ICMP statistics between two hosts.
Example 2-11 Packet Tracer Configuration and Verification
Packet-tracer stats
---------------------
Module 1:
Filter 1 installed: src-ip 192.168.2.2 dst-ip 192.168.1.1 protocol 1
ASIC instance 0:
Entry 0: id = 9473, count = 120, active, fp,
Entry 1: id = 9474, count = 0, active, hg,
Filter 2 uninstalled:
Filter 3 uninstalled:
Filter 4 uninstalled:
Filter 5 uninstalled:
Packet-tracer stats
---------------------
Module 1:
Filter 1 installed: src-ip 192.168.2.2 dst-ip 192.168.1.1 protocol 1
ASIC instance 0:
Entry 0: id = 9473, count = 181, active, fp,
Entry 1: id = 9474, count = 0, active, hg,
Filter 2 uninstalled:
Filter 3 uninstalled:
Filter 4 uninstalled:
Filter 5 uninstalled:
Even if the incoming traffic is dropped because of an ACL, the packet tracer helps determine whether the packet is reaching the router incoming interface. To remove all the filters from the packet tracer, use the command test packet-tracer remove-all.
NetFlow
NetFlow is a Cisco feature that provides the capability to collect statistics and information on IP traffic as it enters or exits an interface. NetFlow provides operators with network and security monitoring, network planning, traffic analysis, and IP accounting capabilities. Network traffic is often asymmetrical, even on small networks, whereas probes typically require engineered symmetry. NetFlow does not require engineering the network around the instrumentation; it follows the traffic through the network over its natural path. In addition to traffic rate, NetFlow provides QoS markings, TCP flags, and so on for specific applications, services, and traffic flows at each point in the network. NetFlow assists with validating traffic engineering or policy enforcement at any point in the topology.
Cisco NX-OS supports both traditional NetFlow (Version 5) and Flexible NetFlow (Version 9) export formats, but using flexible NetFlow is recommended on Nexus platforms. With traditional NetFlow, all the keys and fields exported are fixed and it supports only IPv4 flows. By default, a flow is defined by seven unique keys:
Source IP address
Destination IP address
Source port
Destination port
Layer 3 protocol type
TOS byte (DSCP markings)
Input logical interface (ifindex)
The user can select a few other fields, but NetFlow Version 5 has limitations on the details it can provide. Flexible NetFlow (FNF) is standardized on Version 9 NetFlow and gives users more flexibility on defining flows and the exported fields for each flow type. Flexible NetFlow provides support for IPv6 as well as L2 NetFlow records. The NetFlow version is template based, so users can specify what data has to be exported.
The FNF design gives the following levels benefits:
Flexibility to choose the definition of a flow (the key and nonkey fields)
Flexibility to selectively apply different flow definitions to different interfaces
Flexibility to choose the exporter interface
Extensibility to future improvements, such as IPFIX
Network operators and architects often wonder where to attach the NetFlow monitor. For such challenges, answering the following questions can assist:
What type of information are users looking for? MAC fields or IPv4/v6 fields?
What kind of interfaces are present on the box? L3 or L2 interfaces?
Is the box switching packets within VLANs or routing them across VLANs using Switched Virtual Interfaces (SVI)?
NetFlow Configuration
These questions help users make the right choice of applying a Layer 3 or Layer 2 NetFlow configuration. Configuring NetFlow on a Nexus switch consists of following steps:
Step 1. Enable the NetFlow feature.
Step 2. Define a flow record by specifying key and nonkey fields of interest.
Step 3. Define one or many flow exporters by specifying export format, protocol, destination, and other parameters.
Step 4. Define a flow monitor based on the previous flow record and flow exporter(s).
Step 5. Apply the flow monitor to an interface with a sampling method specified.
Enable NetFlow Feature
On NX-OS, the NetFlow feature is enabled using the command feature netflow. When the feature is enabled, the entire NetFlow-related CLI becomes available to the user.
Note
NetFlow consumes hardware resources such as TCAM and CPU. Thus, understanding the resource utilization on the device is recommended before enabling NetFlow.
Define a Flow Record
A flow record is defined by specifying the different match keys and parameters NetFlow uses to identify the packets. A flow record is created using the command flow record name. NX-OS enables the following match fields by default when a flow record is created:
Match interface input
Match interface output
Match flow direction
A flow record also specifies the fields of interest that has to be collected for a flow. The following match keys are supported for identifying flows in NetFlow:
IPv4 source/destination address
IPv6 source/destination address
IPv6 flow label
IPv6 options
ToS field
L4 protocol
L4 source/destination ports
The following match key is provided for Layer 2 NetFlow:
Source/destination MAC address
Ethertype
VLAN
A user has the flexibility to select the collect parameters that can be used in either Version 5 or Version 9, except for IPv6 parameters, which can be used only with Version 9. The following parameters are collected using NetFlow:
Number of L3 bytes (32 bit or 64 bit)
Number of packets (32 bit or 64 bit)
Direction of the flow
Sampler ID used for the flow
Interface info (input and/or output)
Source/destination AS number of the local device or the peer
Next-hop IPv4/IPv6 address
System uptime for the first or last packet
TCP flags
Example 2-12 shows the configuration for a flow record for both Layer 3 and Layer 2 traffic. In this flow record, multiple match entries are created, along parameters to be used for collection.
Example 2-12 NetFlow Flow Record
match ipv4 source address
match ipv4 destination address
match ip protocol
match ip tos
collect timestamp sys-uptime last
collect flow sampler id
collect ip version
match datalink mac source-address
match datalink mac destination-address
match datalink vlan
match datalink ethertype
collect counter packets
collect flow sampler id
Define a Flow Exporter
The next step is to define a flow exporter. NetFlow data is exported to a remote collector using UDP frames. The data is exported periodically upon expiration of a flow timeout that is configurable by the user. The default flow timeout value is 30 minutes. Under the flow export, the following fields are defined:
Collector IPv4/IPv6 address
Source interface
Virtual Routing and Forwarding (VRF)
Version
UDP port number
Example 2-13 demonstrates the configuration of the flow exporter.
Example 2-13 NetFlow Flow Exporter
destination 100.1.1.1 use-vrf management
transport udp 3000
source mgmt0
version 9
Define and Apply the Flow Monitor
After the flow exporter is defined, it is time to bind the flow record and the flow exporter to a flow monitor. When the flow monitor is defined, the flow monitor can be attached to an interface for collecting NetFlow statistics. Example 2-14 displays the configuration of the flow monitor and illustrates enabling NetFlow under the interface. To apply NetFlow for IPv4/IPv6/Layer 2 traffic, use the command [ip | ipv6 | layer2-switched] flow monitor name [input | output].
Example 2-14 NetFlow Flow Monitor and Interface Configuration
record FR_V4
exporter FL_Exp
!
interface Eth3/31-32
ip flow monitor FL_MON input
ip flow monitor FL_MON output
The NetFlow configuration is viewed using the command show run netflow. To validate the NetFlow configuration, use the command show flow [record record-name | exporter exporter-name | monitor monitor-name].
To view the statistics of the flow ingressing and egressing the interface E1/4 as configured in the previous example, use the command show hardware flow [ip | ipv6] [detail]. Example 2-15 displays the statistics of the ingress and egress traffic flowing across the interfaces Eth3/31-32. This example shows both ingress (I) and egress (O) traffic. NetFlow displays the statistics for OSPF and other ICMP traffic, along with the protocol number and packet count.
Example 2-15 NetFlow Statistics
slot 3
=======
D - Direction; L4 Info - Protocol:Source Port:Destination Port
IF - Interface: ()ethernet, (S)vi, (V)lan, (P)ortchannel, (T)unnel
TCP Flags: Ack, Flush, Push, Reset, Syn, Urgent
D IF SrcAddr DstAddr L4 Info PktCnt TCPFlags
-+----------+---------------+---------------+---------------+----------+--------
I 3/31 010.012.001.002 224.000.000.005 089:00000:00000 0000000159 ......
I 3/32 010.013.001.003 224.000.000.005 089:00000:00000 0000000128 ......
I 3/32 003.003.003.003 002.002.002.002 001:00000:00000 0000000100 ......
I 3/31 002.002.002.002 003.003.003.003 001:00000:00000 0000000100 ......
O 3/31 003.003.003.003 002.002.002.002 001:00000:00000 0000000100 ......
O 3/32 002.002.002.002 003.003.003.003 001:00000:00000 0000000100 ......
The statistics in Example 2-15 are collected on the N7k platform, which supports hardware-based flows. However, not all Nexus platforms have support for hardware-based flow matching. Nexus switches such as Nexus 6000 do not support hardware-based flow matching. Thus, a software-based flow matching must be performed. This can be resource consuming and can impact performance, however, so such platforms support only Sampled NetFlow (see the following section).
Note
Nexus 5600 and Nexus 6000 support only ingress NetFlow applied to the interface; Nexus 7000 supports both ingress and egress NetFlow statistics collection.
NetFlow Sampling
NetFlow supports sampling on the data points to reduce the amount of data collected. This implementation of NetFlow is called Sampled NetFlow (SNF). SNF supports M:N packet sampling, where only M packets are sampled out of N packets.
A sampler is configured using the command sampler name. Under the sampler configuration, sampler mode is defined using the command mode sample-number out-of packet-number, where sample-number ranges from 1 to 64 and the packet-number ranges from 1 to 65536 packets). This is defined using the sampler subcommand mode sampler-number out-of packet-number. After the sampler is defined, it is used in conjunction with the flow monitor configuration under the interface in Example 2-16.
Example 2-16 NetFlow Sampler and Interface Configuration
mode 1 out-of 1000
!
interface Eth3/31-32
ip flow monitor FL_MON input sampler NF-SAMPLER1
Users can also define the active and inactive timer for the flows using the command flow timeout [active | inactive] time-in-seconds.
Starting with NX-OS Version 7.3(0)D1(1), NetFlow is also supported on the control plane policing (CoPP) interface. NetFlow on the CoPP interface enables users to monitor and collect statistics of different packets that are destined for the supervisor module on the switch. NX-OS allows an IPv4 flow monitor and a sampler to be attached to the control plane interface in the output direction. Example 2-17 demonstrates the NetFlow configuration under CoPP interface and the relevant NetFlow statistics on the Nexus 7000 platform.
Example 2-17 CoPP NetFlow Configuration and Verification
ip flow monitor FL_MON output sampler NF-SAMPLER1
Note
In case of any problems with NetFlow, collect the output of the command show tech-support netflow during problematic state.
sFlow
Defined in RFC 3176, sFlow is a technology for monitoring traffic using sampling mechanisms that are implemented as part of an sFlow agent in data networks that contain switches and routers. The sFlow agent is a new software feature for the Nexus 9000 and Nexus 3000 platforms. The sFlow agent on these platforms collects the sampled packet from both ingress and egress ports and forwards it to the central collector, known as the sFlow Analyzer. The sFlow agent can periodically sample or poll the counters associated with a data source of the sampled packets.
When sFlow is enabled on an interface, it is enabled for both ingress and egress directions. sFlow can be configured only for Ethernet and port-channel interfaces. sFlow is enabled by configuring the command feature sflow. Various parameters can be defined as part of the configuration (see Table 2-2).
sFlow Parameter Configuration |
Description |
sflow sampling rate rate |
The sampling rate for packets. The default is 4096. A value of 0 implies that sampling is disabled. |
sflow max-sampled-size sampling-size |
The maximum sampling size for packets. The default is 128 bytes. The value ranges from 64 to 256 bytes. |
sflow counter-poll-interval poll-interval |
The polling interval for an interface. The default is 20 seconds. |
sflow max-datagram-size size |
The maximum datagram size. The default is 1400 bytes. |
sflow collector-ip ip-address vrf vrf-context |
The sFlow collector/analyzer IP address. |
sflow collector-port port-number |
The UDP port number of the sFlow analyzer. |
sflow agent-ip ip-address |
The address of the sFlow agent. This is the local and valid IP address on the switch. |
sflow data-source interface interface-type interface-num |
The sFlow sampling data source. |
Example 2-18 illustrates the configuration of sFlow on a Nexus 3000 switch. The running configuration of sFlow is viewed using the command show run sflow.
Example 2-18 sFlow Configuration
sflow sampling-rate 1000
sflow max-sampled-size 200
sflow counter-poll-interval 100
sflow max-datagram-size 2000
sflow collector-ip 172.16.1.100 vrf management
sflow collector-port 2020
sflow agent-ip 170.16.1.130
sflow data-source interface ethernet 1/1-2
To verify the configuration, use the command show sflow. This command output displays all the information that is configured for the sFlow (see Example 2-19).
Example 2-19 show sflow Command Output
sflow sampling-rate : 1000
sflow max-sampled-size : 200
sflow counter-poll-interval : 100
sflow max-datagram-size : 2000
sflow collector-ip : 172.16.1.100 , vrf : management
sflow collector-port : 2020
sflow agent-ip : 172.16.1.130
sflow data-source interface Ethernet1/1
sflow data-source interface Ethernet1/2
When sFlow is configured, the sFlow agent starts collecting the statistics. Although the actual flow is viewed on the sFlow collector tools, you can still see the sFlow statistics on the switch using the command show sflow statistics and also view both internal information about the sFlow and statistics using the command show system internal sflow info. Example 2-20 displays the statistics for the sFlow. Notice that although the total packet count is high, the number of sampled packets is very low. This is because the configuration defines sampling taken per 1000 packets. The system internal command for sFlow also displays the resource utilization and its present state.
Example 2-20 sFlow Statistics and Internal Info
Total Packets : 1053973
N3K-1# show system internal sflow info
sflow probe state -> RUN
sflow inband sflow is valid
sflow inband driver -> UP
sflow IPv4 socket fd 47
number of sflow sampled packets : 11
number of sflow dropped packets : 0
number of sflow datagram sent : 56
number of sflow datagram dropped : 13
sflow process cpu usage 0.86
sflow process cpu limit 50
Note
In case of any problems with sFlow, collect the output of the command by using show tech-support sflow during problematic state.
Network Time Protocol
While troubleshooting, network operators often run through the logs to understand the symptoms of the problem and the timeline of the problem so they can find the relevant trigger of the problem. If the time is not synced on the devices, correlating the event across multiple devices becomes difficult. To overcome this problem, it is recommended to have the clock on the Nexus device synced with NTP throughout the network. NTP is used to synchronize clocks of devices in the network and on the Internet. NTP uses predefined UDP port number 123.
To configure NTP on the devices, enable NTP by using the command feature ntp. The Nexus device is configured for NTP depending on its role in the network (as either an NTP client or an NTP server). An NTP server receives its time from a time source that is attached to a time server and distributes the time across the network. As with distance-vector protocols, NTP uses a stratum value to describe the distance between a network device and an authoritative time source.
An NX-OS device can be configured as an NTP server and also an NTP peer. An NTP peer relationship enables network engineers to designate another host to consider synchronizing the time with in case a failure event occurs on the NTP server. The NTP server or NTP peer is defined using the command ntp [server | peer] [ip-address | ipv6-address] [prefer] [use-vrf vrf-name]. The configured NTP servers and peers are viewed using the command show ntp peers.
Additionally, users can configure a Nexus switch as an authoritative time server using the command ntp master. NX-OS also allows the users to specify the source interface or IP address of the NTP packets on the switch. The source of NTP packets is defined using the commands ntp source ip-address and ntp source-interface interface-id. If the configuration is specified, ensure that the NTP server is reachable via the specified IP address. These configurations are useful especially on a Nexus 7000 switch with multiple VDCs configured. On a multi-VDC Nexus 7000 switch, the hardware clock is synchronized in the default VDC, and a nondefault VDC can get the timing update from the default VDC. The nondefault VDC also acts as the server for other clients in the network after the ntp master command is configured under the VDC.
Example 2-21 demonstrates the NTP configuration on the Nexus device as a server and as a client.
Example 2-21 NTP Configuration
ntp source-interface mgmt0
ntp master 8
ntp server 172.16.1.11 use-vrf management
ntp source-interface mgmt0
When the NTP is configured, the NTP is automatically synchronized on the client from the server. To check the status of the NTP server or peer, use the command show ntp peer-status. The * beside the peer address indicates that the NTP has synchronized with the server. Example 2-22 displays the output from both the server and the client. On the NTP server, notice that the peer address is 127.127.1.0, which means that the device itself is the NTP server. On the client, the * is beside 172.16.1.10, which is configured as the preferred NTP server in the configuration. Note that all the devices in this example are part of the same management subnet.
Example 2-22 NTP Configuration
--------------------------------------------------
Peer IP Address Serv/Peer
--------------------------------------------------
NX-1# show ntp peer-status
Total peers : 2
* - selected for sync, + - peer mode(active),
- - peer mode(passive), = - polled in client mode
remote local st poll reach delay vrf
-----------------------------------------------------------------------------
*127.127.1.0 0.0.0.0 8 16 377 0.00000
+172.16.1.11 0.0.0.0 16 16 0 0.00000 management
Total peers : 2
* - selected for sync, + - peer mode(active),
- - peer mode(passive), = - polled in client mode
remote local st poll reach delay vrf
----------------------------------------------------------------------------
*172.16.1.10 0.0.0.0 9 16 77 0.00197 management =172.16.1.11 0.0.0.0 10 16 0 0.00000 management
After the NTP has been synchronized, the time is verified using the show clock command.
NX-OS also has a built-in proprietary feature known as Cisco Fabric Services (CFS) that can be used to distribute data and configuration changes to all Nexus devices. CFS distributes all local NTP configuration across all the Nexus devices in the network. It applies a network-wide lock for NTP when the NTP configuration is started. When the configuration changes are made, users can discard or commit the changes, and the committed configuration replicates across all Nexus devices. The CFS for NTP is enabled using the command ntp distribute. The configuration is committed to all the Nexus devices by using the ntp commit command and is aborted using the ntp abort command. When either command is executed, CFS releases the lock on NTP across network devices. To check that the fabric distribution is enabled for NTP, use the command show ntp status.
NX-OS also provides a CLI to verify the statistics of the NTP packets. Users can view input-output statistics for NTP packets, local counters maintained by NTP, and memory-related NTP counters (which is useful in case of a memory leak condition by NTP process), and per-peer NTP statistics. If the NTP packets are getting dropped for some reason, those statistics can be viewed from the CLI itself. To view these statistics, use the command show ntp statistics [io | local | memory | peer ipaddr ip-address]. Example 2-23 displays the IO and local statistics for NTP packets. If bad NTP packets or bad authentication requests are received, those counters are viewed under local statistics.
time since reset: 91281
receive buffers: 10
free receive buffers: 9
used receive buffers: 0
low water refills: 1
system uptime: 91294
time since reset: 91294
old version packets: 9195
new version packets: 0
unknown version number: 0
Embedded Event Manager
Embedded Event Manager (EEM) is a powerful device- and system-management technology integrated in NX-OS. EEM helps customers harness the network intelligence intrinsic to Cisco’s software and give them the capability to customize behavior based on the network events as they happen. EEM is an event-driven tool that takes various types of trigger input and enables the user to define what actions can be taken. This includes capturing various show commands or performing actions such as executing a Tool Command Language (TCL) or Python script when the event gets triggered.
An EEM consists of two major components:
Event: Defines the event to be monitored from another NX-OS component
Action: Defines action to be taken when the event is triggered
Another component of EEM is the EEM policy, which is nothing but an event paired with one or more actions to help troubleshoot or recover from an event. Some system-defined policies look out for certain system-level events such as a line card reload or supervisor switchover event and then perform predefined actions based on those events. These system-level policies are viewed using the command show event manager system-policy. The policies are overridable as well and can be verified using the previous command. The system policies help prevent a larger impact on the device or the network. For instance, if a module has gone bad and keeps crashing continuously, it can severely impact services and cause major outages. A system policy for powering down the module after N crashes can reduce the impact.
Example 2-24 lists some of the system policy events and describes the actions on those events. The command show event manager policy-state system-policy-name checks how many times an event has occurred.
Example 2-24 EEM System Policy
Name : __lcm_module_failure
Description : Power-cycle 2 times then power-down
Overridable : Yes
Name : __pfm_fanabsent_any_singlefan
Description : Shutdown if any fanabsent for 5 minute(s)
Overridable : Yes
Name : __pfm_fanbad_any_singlefan
Description : Syslog when fan goes bad
Overridable : Yes
Name : __pfm_power_over_budget
Description : Syslog warning for insufficient power overbudget
Overridable : Yes
Name : __pfm_tempev_major
Description : TempSensor Major Threshold. Action: Shutdown
Overridable : Yes
Name : __pfm_tempev_minor
Description : TempSensor Minor Threshold. Action: Syslog.
Overridable : Yes
NX-1# show event manager policy-state __lcm_module_failure
Policy __lcm_module_failure
Cfg count : 3
Hash Count Policy will trigger if
----------------------------------------------------------------
default 0 3 more event(s) occur
An event can be either a system event or a user-triggered event, such as configuration change. Actions are defined as the workaround or notification that should be triggered in case an event occurs. EEM supports the following actions, which are defined in the action statement:
Executing CLI commands (configuration or show commands)
Updating the counter
Logging exceptions
Reloading devices
Printing a syslog message
Sending an SNMP notification
Setting the default action policy for the system policy
Executing a TCL or Python script
For example, an action can be taken when high CPU utilization is being seen on the router, or logs can be taken when a BGP session has flapped. Example 2-25 shows the EEM configuration on a Nexus platform. The EEM has the trigger event set for the high CPU condition (for instance, the CPU utilization is 70% or higher); the actions include BGP show commands that are captured when the high CPU condition is noticed. The policy is viewed using the command show event manager policy internal policy-name.
Example 2-25 EEM Configuration and Verification
event snmp oid 1.3.6.1.4.1.9.9.109.1.1.1.1.6.1 get-type exact entry-op ge
entry-val 70 exit-val 30 poll-interval 1
action 1.0 syslog msg High CPU hit $_event_pub_time
action 2.0 cli command enable
action 3.0 cli command "show clock >> bootflash:high-cpu.txt"
action 4.0 cli command "show processes cpu sort >> bootflash:high-cpu.txt"
action 5.0 cli command "show bgp vrf all all summary >> bootflash:high-cpu.txt"
action 6.0 cli command "show clock >> bootflash:high-cpu.txt"
action 7.0 cli command "show bgp vrf all all summary >> bootflash:high-cpu.txt"
NX-1# show event manager policy internal HIGH-CPU
Name : HIGH-CPU
Policy Type : applet
action 1.0 syslog msg "High CPU hit $_event_pub_time"
action 1.1 cli command "enable"
action 3.0 cli command "show clock >> bootflash:high-cpu.txt"
action 4.0 cli command "show processes cpu sort >> bootflash:high-cpu.txt"
action 5.0 cli command "show bgp vrf all all summary >> bootflash:high-cpu.txt"
action 6.0 cli command "show clock >> bootflash:high-cpu.txt"
action 7.0 cli command "show bgp vrf all all summary >> bootflash:high-cpu.txt"
In some instances, repetitive configuration or show commands must be issued when an event is triggered. Additionally, using an external script makes it difficult to continuously monitor the device for an event and then trigger the script. For such scenarios, a better solution is to use automation scripts and tools that are available with NX-OS. NX-OS provides the capability to use TCL and Python scripts in the EEM itself, which allows those scripts to be triggered only when an event is triggered.
Consider an example software problem in which any link shutdown on the switch causes the switching to get disabled on all the VLANs present on the switch. Example 2-26 demonstrates triggering the TCL script for a link shutdown. The TCL is saved on the bootflash with the .tcl extension. The TCL file iterates over all the VLAN database and performs a no shutdown under the VLAN configuration mode.
Example 2-26 EEM with TCL Script
while {$i<10} {
cli configure terminal
cli vlan $i
cli no shutdown
cli exit
incr i
}
event cli match "shutdown"
action 1.0 syslog msg "Triggering TCL Script on Module Failure Event"
action 2.0 cli local tclsh EEM.tcl
Similarly, a Python script can be referenced in the EEM script. The Python script is also saved in the bootflash with the .py extension. Example 2-27 illustrates a Python script and its reference in the EEM script. In this example, the EEM script is triggered when the traffic on the interface exceeds the configured storm-control threshold. In such an event, the triggered Python script collects multiple commands.
Example 2-27 Python Script with EEM
import cisco
cisco.cli ("show module >> bootflash:EEM.txt")
cisco.cli ("show redundancy >> bootflash:EEM.txt")
cisco.cli ("show interface >> bootflash:EEM.txt")
event storm-control
action 1.0 syslog msg "Triggering TCL Script on Module Failure Event"
action 2.0 cli local python EEM.py
Note
Refer to the CCO documentation at www.cisco.com for more details on configuring EEM on various Cisco Operating Systems. If any behavioral issues arise with EEM, capture the show tech-support eem output from the device.
Logging
Network issues are hard to troubleshoot and investigate if the device contains no information. For instance, if an OSPF adjacency goes down and no correlating alert exists, determining when the problem happened and what caused the problem is difficult. For these reasons, logging is important. All Cisco routers and switches support logging functionality. Logging capabilities are also available for specific features and protocols. For example, logging can be enabled for BGP session state changes or OSPF adjacency state changes.
Table 2-3 lists the various logging levels that can be configured.
Level Number |
Level Name |
0 |
Emergency |
1 |
Alert |
2 |
Critical |
3 |
Errors |
4 |
Warnings |
5 |
Notifications |
6 |
Informational |
7 |
Debugging |
When the higher value is set, all the lower logging levels are enabled by default. If the logging level is set to 5 (Notifications), for example, all events falling under the category from 0 to 5 (Emergency to Notifications) are logged. For troubleshooting purpose, setting the logging level to 7 (Debugging) is good practice.
Multiple logging options are available on Cisco devices:
Console logging
Buffered logging
Logging to syslog server
Console logging is important when the device is experiencing crashes or a high CPU condition and access to the terminal session via Telnet or Secure Shell (SSH) is not available. However, having console logging enabled when running debugs is not a good practice because some debug outputs are chatty and can flood the device console. As a best practice, console logging should always be disabled when running debugs. Example 2-28 illustrates how to enable console logging on Nexus platforms.
Example 2-28 Configuring Console Logging
<CR>
<0-7> 0-emerg;1-alert;2-crit;3-err;4-warn;5-notif;6-inform;7-debug
NX-1(config)# logging console 6
NX-OS not only provides robust logging, but it also is persistent across reloads. All the buffered logging is present in the /var/log/external/ directory. To view the internal directories, use the command show system internal flash. This command lists all the internal directories that are part of the flash along with their utilization. The buffered log messages are viewed using the command show logging log.
Example 2-29 displays the directories present in the flash and the contents of the /var/log/external/ directory. If the show logging log command does not display output or the logging gets stopped, check the /var/log/ directory to ensure that space is available for that directory.
Example 2-29 Internal Flash Directories
Mount-on 1K-blocks Used Available Use% Filesystem
/ 409600 69476 340124 17 /dev/root
/proc 0 0 0 0 proc
/sys 0 0 0 0 none
/debugfs 0 0 0 0 nodev
/cgroup 0 0 0 0 vdccontrol
/isan 716800 519548 197252 73 none
/etc 5120 1632 3488 32 none
/nxos/tmp 20480 1536 18944 8 none
/var/log 51200 108 51092 1 none
/var/home 5120 0 5120 0 none
/var/tmp 307200 460 306740 1 none
/var/sysmgr 1048576 144 1048432 1 none
/var/sysmgr/ftp 409600 80 409520 1 none
/dev/shm 1048576 353832 694744 34 none
/volatile 204800 0 204800 0 none
/debug 2048 28 2020 2 none
/dev/mqueue 0 0 0 0 none
/mnt/cfg/0 325029 12351 295897 5 /dev/sda5
/mnt/cfg/1 325029 12349 295899 5 /dev/sda6
/mnt/cdrom 350 350 0 100 /dev/scd0
/var/sysmgr/startup-cfg 40960 4192 36768 11 none
/dev/pts 0 0 0 0 devpts
/mnt/pss 325061 8898 299380 3 /dev/sda3
/bootflash 3134728 202048 2773444 7 /dev/sda4
/smack 0 0 0 0 smackfs
NX-1# show system internal dir /var/log/external/
./ 240
../ 300
libfipf.5834 0
l2fm_ut.txt 774
plcmgr.dbg 21
snmp_log 180
libfipf.3884 0
libfipf.3855 0
syslogd_ha_debug 11221
messages 25153
startupdebug 3710
dmesg@ 31
The logging level is also defined for various NX-OS components so that the user can control logging for chatty components or disable certain logging messages for less chatty or less important components. This is achieved by setting the logging level of the component using the command logging level component-name level. Example 2-30 demonstrates setting the logging level of the ARP and Ethpm components to 3 to reduce unwanted log messages.
Example 2-30 NX-OS Component Logging Level
NX-1(config)# logging level ethpm 3
The most persistent form of logging is to use a syslog server to log all the device logs. A syslog server is anything from a text file to a custom application that actively stores device logging information in a database.
Example 2-31 illustrates the syslog logging configuration. Before configuring syslog-based logging on NX-OS, the command logging timestamp [microseconds | milliseconds | seconds] must be enabled for the logging messages so that all log messages have time stamps. This helps when investigating the log messages. Generally, management interfaces are configured with a management VRF. In such cases, the syslog host must be specified using the logging server ip-address use-vrf vrf-name command on NX-OS so that the router knows from which VRF routing table the server is reachable. If the VRF option is not specified, the system does a lookup in default VRF (the global routing table).
Example 2-31 Syslog Logging Configuration
NX-1(config)# logging server 10.1.1.100 7 use-vrf management
Debug Logfiles
NX-OS provides the user with an option to redirect debug output to a file. This is useful when running debugs and segregating debug outputs from regular log messages. Use the debug logfile file-name size size command. Example 2-32 demonstrates using the debug logfile command to capture debugs in a logfile. In this example, a debug logfile named bgp_dbg is created with a size of 10000 bytes. The size of the logfile ranges from 4096 bytes to 4194304 bytes. All the debugs that are enabled are logged under the logfile. To filter the debug output further to capture more precise debug output, use the debug-filter option. In the following example, a BGP update debug is enabled and the update debug logs are filtered for neighbor 10.12.1.2 in a VRF context VPN_A.
Example 2-32 Capturing Debug in a Logfile on NX-OS
NX-1# debug ip bgp updates
NX-1# debug-filter bgp neighbor 10.12.1.2
NX-1# debug-filter bgp vrf VPN_A
The NX-OS software creates the logfile in the log: file system root directory, so all the created logfiles are viewed using dir log:. After the debug logfile is created, the respective debugs are enabled and all the debug outputs are redirected to the debug logfile. To view the contents of the logfile, use the show debug logfile file-name command.
Accounting Log
During troubleshooting, it is important to identify the trigger of the problem, which could be normal show command or a configuration change. For such issues, examining all the configuration and show commands during the time of the problem provides vital information.
NX-OS logs all this information into the accounting logfile, which is readily available to the users. Using the command show accounting log, users capture all the commands executed and configured on the system, along with the time stamp and user information. The accounting logs are persistent across reloads. By default, the accounting logs capture only the configuration commands. To allow the capture of show commands along with configuration commands, configure the command terminal log-all. Example 2-33 displays the output of the accounting log, highlighting the various configuration changes made on the device.
Note
The accounting logs and show logging logfiles are both stored on logflash and are accessible across reloads.
Sun Apr 2 01:09:02 2017:type=update:id=vsh.12412:user=admin:cmd=configure terminal ;
version 6.0(2)U6(9) (SUCCESS)
Sun Apr 2 01:09:03 2017:type=update:id=vsh.12412:user=admin:cmd=interface-vlan
enable
Sun Apr 2 01:09:03 2017:type=update:id=vsh.12412:user=admin:cmd=configure terminal ;
feature interface-vlan (SUCCESS)
Sun Apr 2 01:09:38 2017:type=update:id=vsh.12963:user=admin:cmd=configure terminal ;
control-plane (SUCCESS)
Sun Apr 2 01:09:38 2017:type=update:id=vsh.12963:user=admin:cmd=configure terminal ;
control-plane ; service-policy input copp-system-policy (SUCCESS
)
Sun Apr 2 01:09:38 2017:type=update:id=vsh.12963:user=admin:cmd=configure terminal ;
hardware profile tcam region arpacl 128 (SUCCESS)
Sun Apr 2 01:09:38 2017:type=update:id=vsh.12963:user=admin:cmd=configure terminal ;
hardware profile tcam region ifacl 256 (SUCCESS)
Sun Apr 2 01:09:38 2017:type=update:id=vsh.12963:user=admin:cmd=configure terminal ;
ip ftp source-interface mgmt0 (SUCCESS)
Event-History
NX-OS provides continuous logging for all events that occur in the system for both hardware and software components as event-history logs. The event-history logs are VDC local and are maintained on a per-component basis. These logs reduce the need for running debugs in a live production environment and are useful for investigating a service outage even after the services are restored. The event-history logs are captured in the background for each component and do not have any impact on CPU utilization to perform this task.
The event-history log size is configurable to three sizes:
Large
Medium
Small
The event-history logs are viewed from the CLI of each component. For instance, the event-history is viewed for all ARP events using the command show ip arp internal event-history event. Example 2-34 displays the event-history logs for ARP and shows how to modify the event-history size. Disable the event-history logs by using the disabled keyword while defining the size of the event-history. Disabling event-history is not a recommended practice, however, because it reduces the chances of root causing a problem and understanding the sequence of events that occurred.
Example 2-34 ARP Event-History Logs and Buffer Size
1) Event:E_DEBUG, length:143, at 449547 usecs after Mon May 29 11:11:38 2017
[116] [4201]: Adj info: iod: 2, phy-iod: 2, ip: 172.16.1.11, mac: fa16.3ee2.
b6d3, type: 0, sync: FALSE, suppress-mode: ARP Suppression Disabled
2) Event:E_DEBUG, length:193, at 449514 usecs after Mon May 29 11:11:38 2017
[116] [4201]: Entry added to ARP pt, added to AM for 172.16.1.11, fa16.3ee2.
b6d3, state 2 on interface mgmt0, physical interface mgmt0, ismct 0. R
earp (interval: 0, count: 0), TTL: 1500 seconds
3) Event:E_DEBUG, length:79, at 449432 usecs after Mon May 29 11:11:38 2017
[116] [4201]: arp_add_adj: Updating MAC on interface mgmt0, phy-interface mgmt0
disabled Disabled
*Default value is small
large Large buffer
medium Medium buffer
small Small buffer
NX-1(config)# ip arp event-history event size large
Summary
This chapter focused on various NX-OS tools that can be used to troubleshoot complex problems. It examined various packet capture capabilities with Nexus platforms, including SPAN and ERSPAN. NX-OS provides the following capabilities, which are useful for troubleshooting latency and drops from buffer congestion:
SPAN-on-Latency
SPAN-on-Drop
The chapter explained how to use internal platform tools such as Ethanalyzer and packet tracer; it also described NetFlow and sFlow use cases, deployment, and configuration for collecting statistics and network planning. NTP ensures that all clocks are synchronized across multiple devices, to properly correlate timing of events across devices. EEM scripts are useful for troubleshooting on a daily basis or collecting information after an event. Finally, the chapter looked at the logging methods available with NX-OS, including accounting and event-history logging.
References
RFC 3176, InMon Corporation’s sFlow: A Method for Monitoring Traffic in Switched and Routed Networks. P. Phaal, S. Panchen, and N. McKee. IETF, https://www.ietf.org/rfc/rfc3176.txt, September 2001.
BRKARC-2011, Overview of Packet Capturing Tools, Cisco Live.
Cisco, sFlow Configuration Guide, http://www.cisco.com/c/en/us/td/docs/switches/datacenter/nexus3000/sw/system_mgmt/503_U4_1/b_3k_System_Mgmt_Config_503_u4_1/b_3k_System_Mgmt_Config_503_u4_1_chapter_010010.html.