Chapter 3
Troubleshooting Nexus Platform Issues
This chapter covers the following topics:
Troubleshooting Line Card Issues
Troubleshooting Nexus Fabric
NX-OS
Chapter 1, “Introduction to Nexus Operating System (NX-OS),” explored the various Nexus platforms and the line cards supported on them. In addition to understanding the platform and the architecture, it is vital to understand what system components are present and how to troubleshoot various hardware-level components on the Nexus platforms. This chapter focuses on platform-level troubleshooting.
Troubleshooting Hardware Issues
Nexus is a modular platform that comes in either a single-slot or multiple-slot chassis format. In a single-slot chassis, the Nexus switch has a supervisor card with the physical interfaces integrated into it. A multislot chassis supports supervisor engine cards (SUP cards), line cards, and fabric cards. Each type plays an important role in the Nexus forwarding architecture and makes it a highly available and distributed architecture platform. Trouble with any of these cards leads to service degradation or service loss in part of the network or even within the whole data center. Understanding the platform architecture and isolating the problem within the Nexus device itself is important, to minimize the service impact.
Before delving into troubleshooting for Nexus platform hardware, it is important to know which series of Nexus device is being investigated and what kinds of cards are present in the chassis. The first step is to view the information of all the cards present in the chassis. Use the command show module [module-number] to view all the cards present on the Nexus device; here, module-number is optional for viewing the details of a specific line card. Examine the output of the show module command from Nexus 7009 and Nexus 3548P in Example 3-1. The first section of the output is from Nexus 7000. It shows two SUP cards in both active and standby state, along with three other cards: One is running fine, and the other two are powered down. The command output also shows the software and hardware version for each card and displays the online diagnostic status of those cards. The command output shows the reason the device is in a powered-down state. At the end, the command displays the fabric modules present in the chassis, along with the software and hardware versions and their status.
The second section of the output is from a Nexus 3500 switch that shows only a single SUP card. This is because the Nexus 3548P is a single rack unit (RU) switch. The number of modules present in the chassis depends on the device being used and the kind of cards it supports.
Example 3-1 show module Command Output
N7K1# show module
Mod Ports Module-Type Model Status
--- ----- ----------------------------------- ------------------ ----------
1 0 Supervisor Module-2 N7K-SUP2E active *
2 0 Supervisor Module-2 N7K-SUP2E ha-standby
5 48 10/100/1000 Mbps Ethernet XL Module powered-dn
6 48 1/10 Gbps Ethernet Module N7K-F248XP-25E ok
7 32 10 Gbps Ethernet XL Module powered-dn
Mod Power-Status Reason
--- ------------ ---------------------------
Mod Sw Hw
--- --------------- ------
1 8.0(1) 0.403
2 8.0(1) 1.0
6 8.0(1) 1.2
Mod MAC-Address(es) Serial-Num
--- -------------------------------------- ----------
1 6c-9c-ed-48-0d-9f to 6c-9c-ed-48-0d-b1 JAF1608AAPL
2 84-78-ac-10-99-cf to 84-78-ac-10-99-e1 JAF1710ACHA
5 00-00-00-00-00-00 to 00-00-00-00-00-00 JAF1803AMGR
6 b0-7d-47-da-fb-04 to b0-7d-47-da-fb-37 JAE191908QG
7 00-00-00-00-00-00 to 00-00-00-00-00-00 JAF1553ASRE
Mod Online Diag Status
--- ------------------
1 Pass
2 Pass
6 Pass
Xbar Ports Module-Type Model Status
--- ----- ----------------------------------- ------------------ ----------
1 0 Fabric Module 2 N7K-C7009-FAB-2 ok
2 0 Fabric Module 2 N7K-C7009-FAB-2 ok
3 0 Fabric Module 2 N7K-C7009-FAB-2 ok
4 0 Fabric Module 2 N7K-C7009-FAB-2 ok
5 0 Fabric Module 2 N7K-C7009-FAB-2 ok
Xbar Sw Hw
--- --------------- ------
1 NA 2.0
2 NA 3.0
3 NA 2.0
4 NA 2.0
5 NA 2.0
Xbar MAC-Address(es) Serial-Num
--- -------------------------------------- ----------
1 NA JAF1621BCDA
2 NA JAF1631APEH
3 NA JAF1621BBTF
4 NA JAF1621BCEM
5 NA JAF1621BCFJ
Nexus 3500
N3K1# show module
Mod Ports Module-Type Model Status
--- ----- ----------------------------------- ---------------------- -----------
1 48 48x10GE Supervisor N3K-C3548P-10G-SUP active *
Mod Sw Hw World-Wide-Name(s) (WWN)
--- -------------- ------ ---------------------------------------------------
1 6.0(2)A6(8) 1.1 --
Mod MAC-Address(es) Serial-Num
--- -------------------------------------- ----------
1 f872.ea99.6468 to f872.ea99.64a7 FOC17263D71
Note
A fabric module is not required for all Nexus 7000 chassis types. The Nexus 7004 chassis has no fabric module, for example. However, higher slot chassis types do require fabric modules for the Nexus 7000 switch to function successfully.
One of the most common issues noticed with Nexus 7000/7700 installations or hardware upgrades involves interoperability. For example, the network operator might try to install a line card in a VDC that does not function well in combination with the existing line cards. M3 cards operate only in combination with M2 or F3 cards in the same VDC. Similarly, Nexus Fabric Extender (FEX) cards are not supported in combination with certain line cards. Refer to the compatibility matrix to avoid possible interoperability issues. The show module command output in Example 3-1 for Nexus 7000 switches highlights a similar problem, with two line cards powered down because of incompatibility.
Note
Nexus I/O module compatibility matrix CCO documentation is available at http://www.cisco.com/c/dam/en/us/td/docs/switches/datacenter/nexus7000/sw/matrix/technical/reference/Module_Comparison_Matrix.pdf.
The referenced CCO documentation also lists the compatibility of the FEX modules with different line cards.
The show hardware command is used to get detailed information about both the software and the hardware on the Nexus device. The command displays the status of the Nexus switch, as well as the uptime, the health of the cards (both line cards and fabric cards), and the power supply and fans present in the chassis.
Generic Online Diagnostic Tests
Similar to Cisco 6500 series switches, Nexus devices have support for the Generic Online Diagnostic (GOLD) tool, a platform-independent fault-detective framework that helps in isolating any hardware as well as resource issues on the system both during bootup and at runtime. The diagnostic tests can be either disruptive or nondisruptive. Disruptive tests affect the functionality of the system partially or completely; nondisruptive tests do not affect the functionality of the system while running.
Bootup Diagnostics
Bootup diagnostics detect hardware faults such as soldering errors, loose connections, and faulty module. These tests are run when the system boots up and before the hardware is brought online. Table 3-1 shows some of the bootup diagnostic tests.
Table 3-1 Nexus Bootup Diagnostic Tests
Test Name |
Description |
Attributes |
Hardware |
ASIC Register Test |
Tests access to all the registers in the ASIC |
Disruptive |
SUP and line card |
ASIC Memory Test |
Tests access to all the memory in the ASICs |
Disruptive |
SUP and line card |
EOBC Port Loopback |
Test the loopback of Ethernet out-of-band connection (EOBC) |
Disruptive |
SUP and line card |
Port Loopback Test |
Tests the port in internal loopback and checks the forwarding path by sending and receiving data on the same port |
Disruptive |
Line card |
Boot Read-Only Memory (ROM) Test |
Tests the integrity of the primary and secondary boot devices on the SUP card |
Nondisruptive |
SUP |
Universal Serial Bus (USB) |
Verifies the USB controller initialization on the SUP card |
Nondisruptive |
SUP |
Management Port Loopback Test |
Tests the loopback of the management port on the SUP card |
Disruptive |
SUP |
OBFL |
Tests the integrity of the onboard failure logging (OBFL) flash |
Nondisruptive |
SUP and line card |
Federal Information Processing Standards (FIPS) |
Verifies the security device on the module |
Disruptive |
Line card |
Note
The FIPS test is not supported on the F1 series modules on Nexus 7000.
Bootup diagnostics are configured to be performed and supported at one of the following levels:
None (Bypass): The module is put online without running any bootup diagnostic tests, for faster card bootup.
Complete: The entire bootup diagnostic tests are run for the module. This is the default and the recommended level for bootup diagnostics.
The diagnostic level is configured using the command diagnostic bootup level [bypass | complete] in global configuration mode. The diagnostic level must be configured within individual VDCs, where applicable. The bootup diagnostic level is verified using the command show diagnostic bootup level.
Runtime Diagnostics
The runtime diagnostics are run when the system is in running state (that is, on a live node). These tests help detect runtime hardware errors such as memory errors, resource exhaustion, and hardware faults/degradation. The runtime diagnostics are further be classified into two categories:
Health-monitoring diagnostics
On-demand diagnostics
Health-monitoring (HM) tests are nondisruptive and run in the background on each module. The main aim of these tests is to ensure that the hardware and software components are healthy while the switch is running network traffic. Some specific HM tests, marked as HM-always, start by default when the module goes online. Users can easily enable and disable all HM tests except HM-always tests on any module via the configuration command-line interface (CLI). Additionally, users can change the interval of all HM tests except the fixed-interval tests marked as HM-fixed. Table 3-2 lists the HM tests available across SUP and line card modules.
Table 3-2 Nexus Health-Monitoring Diagnostic Tests
Test Name |
Description |
Attributes |
Hardware |
ASIC Scratch Register Test |
Tests the access to a scratch pad register of the ASICs |
Nondisruptive |
SUP and line card (all ASICs that support scratch pad register) |
RTC Test |
Verifies that the real-time clock (RTC) on the Supervisor is ticking |
Nondisruptive |
SUP |
Nonvolatile Random Access Memory (NVRAM) Sanity Test |
Tests the sanity of NVRAM blocks on the SUP modules |
Nondisruptive |
SUP |
Port Loopback Test |
Tries to loop back a packet to check the forwarding path periodically without disrupting port traffic |
Nondisruptive |
Line card (all front-panel ports on the switch) |
Rewrite Engine Loopback Test |
Tests the integrity of loopback for all ports to the Rewrite Engine ASIC on the module |
Nondisruptive |
Line card |
Primary Boot ROM Test |
Tests the integrity of the primary boot devices on the card |
Nondisruptive |
SUP and line card |
Secondary Boot ROM Test |
Tests the integrity of the secondary boot devices on the card |
Nondisruptive |
SUP and line card |
CompactFlash |
Verifies the access to internal CompactFlash on the SUP card |
Nondisruptive |
SUP |
External CompactFlash |
Verifies the access to external CompactFlash on the SUP card |
Nondisruptive |
SUP |
Power Management Bus Test |
Test the standby power management control bus on the SUP card |
Nondisruptive |
SUP |
Spine Control Bus Test |
Tests and verifies the availability of the standby spine module control bus |
Nondisruptive |
SUP |
Standby Fabric Loopback Test |
Tests the packet path between the standby SUP and fabric |
Nondisruptive |
SUP |
Status Bus (Two Wire) Test |
Checks the two wire interfaces that connect the various modules (including fabric cards) to the SUP module |
Nondisruptive |
SUP |
The interval for HM tests is set using the global configuration command diagnostic monitor interval module slot test [name | test-id | all] hour hour min minutes second sec. Note that the name of the test is case sensitive. To enable or disable an HM test, use the global configuration command [no] diagnostic monitor module slot test [name | test-id | all]. Use the command show diagnostic content module [slot | all] to display the information about the diagnostics and their attributes on a given line card. Example 3-2 illustrates how to view the diagnostics information on a line card on a Nexus 7000 switch and how to disable an HM test. The line card in the output of Example 3-2 is the SUP card, so the test names listed are relevant only for the SUP card, not the line card. For example, with the ExternalCompactFlash test, notice that the attribute in the first output is set to A, which indicates that the test is Active. When the test is disabled from the configuration mode, the output displays the attribute as I, indicating that the test is Inactive.
Example 3-2 show diagnostic content module Command Output
N7K1# show diagnostic content module 1
Diagnostics test suite attributes:
B/C/* - Bypass bootup level test / Complete bootup level test / NA
P/* - Per port test / NA
M/S/* - Only applicable to active / standby unit / NA
D/N/* - Disruptive test / Non-disruptive test / NA
H/O/* - Always enabled monitoring test / Conditionally enabled test / NA
F/* - Fixed monitoring interval test / NA
X/* - Not a health monitoring test / NA
E/* - Sup to line card test / NA
L/* - Exclusively run this test / NA
T/* - Not an ondemand test / NA
Module 1: Supervisor Module-2 (Active)
Testing Interval
ID Name Attributes (hh:mm:ss)
____ __________________________________ ____________ _________________
1) ASICRegisterCheck-------------> ***N******A* 00:00:20
2) USB---------------------------> C**N**X**T** -NA-
3) NVRAM-------------------------> ***N******A* 00:05:00
4) RealTimeClock-----------------> ***N******A* 00:05:00
5) PrimaryBootROM----------------> ***N******A* 00:30:00
6) SecondaryBootROM--------------> ***N******A* 00:30:00
7) CompactFlash------------------> ***N******A* 00:30:00
8) ExternalCompactFlash----------> ***N******A* 00:30:00
9) PwrMgmtBus--------------------> **MN******A* 00:00:30
10) SpineControlBus---------------> ***N******A* 00:00:30
11) SystemMgmtBus-----------------> **MN******A* 00:00:30
12) StatusBus---------------------> **MN******A* 00:00:30
13) PCIeBus-----------------------> ***N******A* 00:00:30
14) StandbyFabricLoopback---------> **SN******A* 00:00:30
15) ManagementPortLoopback--------> C**D**X**T** -NA-
16) EOBCPortLoopback--------------> C**D**X**T** -NA-
17) OBFL--------------------------> C**N**X**T** -NA-
N7K1# config t
N7K1(config)# no diagnostic monitor module 1 test ExternalCompactFlash
N7K1# show diagnostic content module 1
Testing Interval
ID Name Attributes (hh:mm:ss)
____ __________________________________ ____________ _________________
1) ASICRegisterCheck-------------> ***N******A* 00:00:20
2) USB---------------------------> C**N**X**T** -NA-
3) NVRAM-------------------------> ***N******A* 00:05:00
4) RealTimeClock-----------------> ***N******A* 00:05:00
5) PrimaryBootROM----------------> ***N******A* 00:30:00
6) SecondaryBootROM--------------> ***N******A* 00:30:00
7) CompactFlash------------------> ***N******A* 00:30:00
8) ExternalCompactFlash----------> ***N******I* 00:30:00
9) PwrMgmtBus--------------------> **MN******A* 00:00:30
10) SpineControlBus---------------> ***N******A* 00:00:30
11) SystemMgmtBus-----------------> **MN******A* 00:00:30
12) StatusBus---------------------> **MN******A* 00:00:30
13) PCIeBus-----------------------> ***N******A* 00:00:30
14) StandbyFabricLoopback---------> **SN******A* 00:00:30
15) ManagementPortLoopback--------> C**D**X**T** -NA-
16) EOBCPortLoopback--------------> C**D**X**T** -NA-
17) OBFL--------------------------> C**N**X**T** -NA-
The command show diagnostic content module [slot | all] displays not only the HM tests but also the bootup diagnostic tests. In the output of Example 3-2, notice the tests whose attributes begin with C. Those tests are complete bootup-level tests. To view all the test results and statistics, use the command show diagnostic result module [slot | all] [detail]. When verifying the diagnostic results, ensure no test has a Fail (F) or Error (E) result. Example 3-3 displays the diagnostic test results of the SUP card both in brief format and in detailed format. The output shows that the bootup diagnostic level is set to complete. The first output lists all the tests the SUP module went through along with its results, where “.” indicates that the test has passed. The detailed version of the output lists more specific details, such as the error code, the previous execution time, the next execution time, and the reason for failure. This detailed information is useful when issues are observed on the module and investigation is required to isolate a transient issue or a hardware issue.
Example 3-3 Diagnostic Test Results
Current bootup diagnostic level: complete
Module 1: Supervisor Module-2 (Active)
Test results: (. = Pass, F = Fail, I = Incomplete,
U = Untested, A = Abort, E = Error disabled)
1) ASICRegisterCheck-------------> .
2) USB---------------------------> .
3) NVRAM-------------------------> .
4) RealTimeClock-----------------> .
5) PrimaryBootROM----------------> .
6) SecondaryBootROM--------------> .
7) CompactFlash------------------> .
8) ExternalCompactFlash----------> U
9) PwrMgmtBus--------------------> .
10) SpineControlBus---------------> .
11) SystemMgmtBus-----------------> .
12) StatusBus---------------------> .
13) PCIeBus-----------------------> .
14) StandbyFabricLoopback---------> U
15) ManagementPortLoopback--------> .
16) EOBCPortLoopback--------------> .
17) OBFL--------------------------> .
N7K1# show diagnostic result module 1 detail
Current bootup diagnostic level: complete
Module 1: Supervisor Module-2 (Active)
Diagnostic level at card bootup: complete
Test results: (. = Pass, F = Fail, I = Incomplete,
U = Untested, A = Abort, E = Error disabled)
______________________________________________________________________
1) ASICRegisterCheck .
Error code ------------------> DIAG TEST SUCCESS
Total run count -------------> 38807
Last test execution time ----> Thu May 7 18:24:16 2015
First test failure time -----> n/a
Last test failure time ------> n/a
Last test pass time ---------> Thu May 7 18:24:16 2015
Total failure count ---------> 0
Consecutive failure count ---> 0
Last failure reason ---------> No failures yet
Next Execution time ---------> Thu May 7 18:24:36 2015
______________________________________________________________________
2) USB .
Error code ------------------> DIAG TEST SUCCESS
Total run count -------------> 1
Last test execution time ----> Tue Apr 28 18:44:36 2015
First test failure time -----> n/a
Last test failure time ------> n/a
Last test pass time ---------> Tue Apr 28 18:44:36 2015
Total failure count ---------> 0
Consecutive failure count ---> 0
Last failure reason ---------> No failures yet
Next Execution time ---------> n/a
On-demand diagnostics have a different focus. Some tests are not required to be run periodically, but they might be run in response to certain events (such as faults) or in an anticipation of an event (such as exceeded resources). Such on-demand tests are useful in localizing faults and applying fault-containment solutions.
Both disruptive and nondisruptive on-demand diagnostic tests are run from a CLI. An on-demand test is executed using the command diagnostic start module slot test [test-id | name | all | non-disruptive] [port port-number | all]. The test-id variable is the number of tests supported on a given module. The test is also run on a port basis (depending on the kind of test) by specifying the optional keyword port. The command diagnostic stop module slot test [test-id | name | all] is used to stop an on-demand test. The on-demand tests default to single execution, but the number of iterations can be increased using the command diagnostic ondemand iteration number, where number specifies the number of iterations. Be careful when running disruptive on-demand diagnostic tests within production traffic.
Example 3-4 demonstrates an on-demand PortLoopback test on a Nexus 7000 switch module.
Example 3-4 On-Demand Diagnostic Test
N7K1# diagnostic start module 6 test PortLoopback
N7K1# show diagnostic status module 6
<BU>-Bootup Diagnostics, <HM>-Health Monitoring Diagnostics
<OD>-OnDemand Diagnostics, <SCH>-Scheduled Diagnostics
==============================================
Card:(6) 1/10 Gbps Ethernet Module
==============================================
Current running test Run by
PortLoopback OD
Currently Enqueued Test Run by
PortLoopback OD (Remaining Iteration: 2)
N7K1# show diagnostic result module 6 test PortLoopback detail
Current bootup diagnostic level: complete
Module 6: 1/10 Gbps Ethernet Module
Diagnostic level at card bootup: complete
Test results: (. = Pass, F = Fail, I = Incomplete,
U = Untested, A = Abort, E = Error disabled)
______________________________________________________________________
6) PortLoopback:
Port 1 2 3 4 5 6 7 8 9 10 11 12 13 14 15 16
-----------------------------------------------------
U U U U U U U U U U U U U . . .
Port 17 18 19 20 21 22 23 24 25 26 27 28 29 30 31 32
-----------------------------------------------------
U U . . U U U U U U U U U U U U
Port 33 34 35 36 37 38 39 40 41 42 43 44 45 46 47 48
-----------------------------------------------------
U U U U U U U U U U U U U U U U
Error code ------------------> DIAG TEST SUCCESS
Total run count -------------> 879
Last test execution time ----> Thu May 7 21:25:48 2015
First test failure time -----> n/a
Last test failure time ------> n/a
Last test pass time ---------> Thu May 7 21:26:00 2015
Total failure count ---------> 0
Consecutive failure count ---> 0
Last failure reason ---------> No failures yet
Next Execution time ---------> Thu May 7 21:40:48 2015
During troubleshooting, if the number of iterations is set to a higher value and an action needs to be taken if the test fails, use the command diagnostic ondemand action-on-failure [continue failure-count num-fails | stop]. When the continue keyword is used, the failure-count parameter sets the number of failures allowed before stopping the test. This value defaults to 0, which means to never stop the test, even in case of failure. The on-demand diagnostic settings are verified using the command show diagnostic ondemand setting. Example 3-5 illustrates how to set the action upon failure for on-demand diagnostic tests. In this example, the action-on-failure is set to continue until the failure count reaches the value of 2.
Example 3-5 Action-On-Failure for On-Demand Diagnostic Tests
N7K1# show diagnostic ondemand setting
Note
Diagnostic tests are also run in offline mode. Use the command hardware module slot offline to put the module in offline mode, and then use the command diagnostic start module slot test [test-id | name | all] offline to execute the diagnostic test with the offline attribute.
GOLD Test and EEM Support
The diagnostic tests help identify hardware problems on SUP as well as line cards, but corrective actions also need to be taken whenever those problems are encountered. NX-OS provides such a capability by integrating GOLD tests with the Embedded Event Manager (EEM), which takes corrective actions in case diagnostic tests fail. One of the most common use cases for GOLD tests is conducting burn-in testing or staging new equipment before placing the device into a production environment. Burn-in testing is similar to load testing: The device is typically under some load, with investigation into resource utilization, including memory, CPU, and buffers over time. This helps prevent any major outages that result from hardware issues before the device starts processing production traffic.
NX-OS supports corrective actions for the following HM tests:
RewriteEngineLoopback
StandbyFabricLoopback
Internal PortLoopback
SnakeLoopback
On the Supervisor module, if the StandbyFabricLoopback test fails, the system reloads the standby supervisor card. If the standby supervisor card does not come back up online in three retries, the standby supervisor card is powered off. After the reload of the standby supervisor card, the HM diagnostics start by default. The corrective actions are disabled by default and are enabled by configuring the command diagnostic eem action conservative.
Note
The command diagnostic eem action conservative is not configurable on a per-test basis; it applies to all four of the previously mentioned GOLD tests.
Nexus Device Health Checks
In any network environment, the network administrators and operators are required to perform regular device health checks to ensure stability in the network and to capture issues before they cause major network impacts. Health checks are performed either manually or by using automation tools. The command line might vary among Nexus platforms, but a few common points are verified at regular intervals:
Module state and diagnostics
Hardware and process crashes and resets
Packet drops
Interface errors and drops
The previous section covered module state and diagnostics. This section focuses on commands used across different Nexus platforms to perform health checks.
Hardware and Process Crashes
Line card and supervisor card reloads or crashes can cause major outages on a network. The crashes or reloads happen because of either hardware or software issues. NX-OS has a distributed architecture, so crashes can happen even on the processes. In most hardware or process crashes, a core file is generated after the crash. The Cisco Technical Assistance Center (TAC) can use that core file to identify the root cause of the crash. Core files are found using the command show cores vdc-all. On the Nexus 7000 switch, run the show cores vdc-all command from the default VDC. Example 3-6 displays the cores generated on a Nexus 7000 switch. In this example, the core file is generated for VDC 1 module 6 and for the RPM process.
VDC Module Instance Process-name PID Date(Year-Month-Day Time)
--- ------ -------- --------------- -------- -------------------------
1 6 1 rpm 4298 2017-02-08 15:08:48
When the core file is identified, it can be copied to bootflash or any external location, such as a File Transfer Protocol (FTP) or Trivial FTP (TFTP) server. On Nexus 7000, the core files are located in the core: file system. The relevant core files are located by following this URL:
core://<module-number>/<process-id>/<instance-number>
For instance, in Example 3-6, the location for the core files is core://6/4298/1. If the Nexus 7000 switch rebooted or a switchover occurred, the core files would be located in the logflash://[sup-1 | sup-2]/core directory. On other Nexus platforms, such as Nexus 5000, 4000, or 3000, the core files would be located in the volatile: file system instead of the logflash: file system; thus, they can be lost if the device reloads. In newer versions of software for platforms that stores core files in volatile: file system, the capability was added to write the core files to bootflash: or to a remote file location when they occur.
If a process crashed but no core files were generated for the crash, a stack trace might have been generated for the process. But if neither a core file nor a stack trace exists for the crashed service, use the command show processes log vdc-all to identify which processes were impacted. Such crashed processes usually are marked with the N flag. Using the process ID (PID) values from the previous command and using the command show processes log pid pid can identify the reason the service went down. The command output displays the reason the process failed in the Death reason field. Example 3-7 displays using the show processes log and show processes log pid commands to identify crashes on the Nexus platform
Example 3-7 Nexus Process Crash
VDC Process PID Normal-exit Stack Core Log-create-time
--- --------------- ------ ----------- ----- ----- ---------------
1 ascii-cfg 5656 N Y N Thu Feb 23 17:10:43 2017
1 ascii_cfg_serve 7811 N N N Thu Feb 23 17:10:43 2017
1 installer 23457 N N N Tue May 23 02:00:00 2017
1 installer 25885 N N N Tue May 23 02:28:23 2017
1 installer 26212 N N N Tue May 23 15:51:19 2017
======================================================
Service: ascii-cfg
Description: Ascii Cfg Server
Executable: /isan/bin/ascii_cfg_server
Started at Thu Feb 23 17:06:20 2017 (155074 us)
Stopped at Thu Feb 23 17:10:43 2017 (738171 us)
Uptime: 4 minutes 23 seconds
Start type: SRV_OPTION_RESTART_STATELESS (23)
RLIMIT_AS: 1936268083
System image name: n7000-s2-dk9.7.3.1.D1.1.bin
System image version: 7.3(1)D1(1) S19
cgroup: 1:devices,memory,cpuacct,cpu:/1
CWD: /var/sysmgr/work
RLIMIT_AS: 1936268083
For quick verification of the last reset reason, use the show system reset-reason command. Additional commands to capture and identify the reset reason when core files were not generated follow:
show system exception-info
show module internal exceptionlog module slot
show logging onboard [module slot]
show process log details
Packet Loss
Packet loss is a complex issue to troubleshoot in any environment. Packet happens because of multiple reasons:
Bad hardware
Drops on a platform
A routing or switching issue
The packet drops that result from routing and switching issues can be fixed by rectifying the configuration. Bad hardware, on the other hand, impacts all traffic on a partial port or on the whole line card. Nexus platforms provide various counters that can be viewed to determine the reason for packet loss on the device (see the following sections).
Interface Errors and Drops
Apart from platform or hardware drops, interface issues can lead to packet loss and service degradation in a data center environment. Issues such as flapping links, links not coming up, interface errors, and input or output discards are just a few of the scenarios that can have a major impact on the services. Deciphering fault on the link can be difficult on a switch, but NX-OS provides CLI and internal platform commands that can help.
The show interface interface-number command displays detailed information regarding the interface, such as interface traffic rate, input and output statistics, and error counters for input/output errors, CRC errors, overrun counters, and more. The NX-OS CLI also provides different command options (including the show interface command) that are useful for verifying interface capabilities, transceiver information, counters, flow control, MAC address information, and switchport and trunk information. Example 3-8 displays the output of the show interface command, with various fields highlighting the information to be verified on an interface. The second part of the output displays on information on the various capabilities of the interface.
Example 3-8 Nexus Interface Details and Capabilities
Hardware: 40000 Ethernet, address: 1005.ca57.287f (bia 88f0.31f9.5710)
full-duplex, 40 Gb/s, media type is 40G
Beacon is turned off
Auto-Negotiation is turned on
Rate mode is dedicated
EEE (efficient-ethernet) : n/a
Last link flapped 2d01h
Last clearing of "show interface" counters never
2 interface resets
input rate 32 bps, 0 pps; output rate 32 bps, 0 pps
1296199 input packets 121222244 bytes
0 jumbo packets 0 storm suppression packets
0 runts 0 giants 0 CRC 0 no buffer
0 input error 0 short frame 0 overrun 0 underrun 0 ignored
0 watchdog 0 bad etype drop 0 bad proto drop 0 if down drop
0 input with dribble 0 input discard
0 Rx pause
3901598 output packets 396283422 bytes
0 jumbo packets
0 output error 0 collision 0 deferred 0 late collision
0 lost carrier 0 no carrier 0 babble 0 output discard
0 Tx pause
N9k-1# show interface Eth2/1 capabilities
Ethernet2/1
Model: N9K-X9636PQ
Type (SFP capable): QSFP-40G-CR4
Speed: 40000
Duplex: full
Trunk encap. type: 802.1Q
FabricPath capable: no
Channel: yes
Broadcast suppression: percentage(0-100)
Flowcontrol: rx-(off/on/desired),tx-(off/on/desired)
Rate mode: dedicated
Port mode: Routed,Switched
QOS scheduling: rx-(none),tx-(4q)
CoS rewrite: yes
ToS rewrite: yes
SPAN: yes
UDLD: yes
MDIX: no
TDR capable: no
Link Debounce: yes
Link Debounce Time: yes
FEX Fabric: yes
dot1Q-tunnel mode: yes
Pvlan Trunk capable: yes
Port Group Members: 1
EEE (efficient-eth): no
PFC capable: yes
Buffer Boost capable: no
Speed group capable: yes
To view just the various counters on the interfaces, use the command show interface counters errors. The counters errors option is also used with the specific show interface interface-number command. Example 3-9 displays the error counters for the interface. If any counter is increasing, the interface needs further troubleshooting, based on the kind of errors received. The error can point to Layer 1 issues, a bad port issue, or even buffer issues. Some counters indicated in the output are not errors, but instead indicate a different problem: The Giants counter, for instance, indicates that packets are being received with a higher MTU size than the one configured on the interface.
Example 3-9 Interface Error Counters
--------------------------------------------------------------------------------
Port Align-Err FCS-Err Xmit-Err Rcv-Err UnderSize OutDiscards
--------------------------------------------------------------------------------
Eth2/1 0 0 0 0 0 0
--------------------------------------------------------------------------------
Port Single-Col Multi-Col Late-Col Exces-Col Carri-Sen Runts
--------------------------------------------------------------------------------
Eth2/1 0 0 0 0 0 0
--------------------------------------------------------------------------------
Port Giants SQETest-Err Deferred-Tx IntMacTx-Er IntMacRx-Er Symbol-Err
--------------------------------------------------------------------------------
Eth2/1 0 -- 0 0 0 0
To view the details of the hardware interface resources and utilization, use the command show hardware capacity interface. This command displays not only buffer information but also any drops in both the ingress and egress directions on multiple ports across each line card. The output varies a bit among Nexus platforms, such as between the Nexus 7000 and the Nexus 9000, but this command is useful for identifying interfaces with the highest drops on the switch. Example 3-10 displays the hardware interface resources on the Nexus 7000 switch.
Example 3-10 Hardware Interface Resources and Drops
Interface Resources
Interface drops:
Module Total drops Highest drop ports
3 Tx: 0 -
Interface buffer sizes:
Module Bytes: Tx buffer Rx buffer
3 705024 1572864
4 705024 1572864
One of the most common problems on an interface is input and output discards. These errors usually take place when congestion occurs on the ports. The previous interface commands and the show hardware internal errors [module slot] command are useful in identifying input or output discards. If input discards are identified, you must try to discover congestion on the egress ports. Input discards can be a problem even if SPAN is configured on the device if oversubscription on egress ports is taking place. Thus, ensure that SPAN is not configured on the device unless it is required for performing SPAN captured; in that case, remove it afterward. If the egress-congested port is a Gig port, the problem could result from a many-to-one unicast traffic flow causing congestion. This issue can be overcome by upgrading the port to a 10-Gig port or by bundling multiple Gig ports into a port-channel interface.
The output discards are usually caused by drops in the queuing policy on the interface. This is verified using the command show system internal qos queueing stats interface interface-id. The queueing policy configuration information is viewed using the command show queueing interface interface-id or show policy-map interface interface-id [input | output]. Tweaking the QoS policy prevents the output discards or drops. Example 3-11 displays the queueing statistics for interface Ethernet1/5, indicating drops in various queues on the interface.
Example 3-11 Interface Queueing Statistics
Interface Ethernet1/5 statistics
Transmit queues
----------------------------------------
Queue 1p7q4t-out-q-default
Total bytes 0
Total packets 0
Current depth in bytes 0
Min pg drops 0
No desc drops 0
WRED drops 0
Taildrop drops 0
Queue 1p7q4t-out-q2
Total bytes 0
Total packets 0
Current depth in bytes 0
Min pg drops 0
No desc drops 0
WRED drops 0
Taildrop drops 0
Queue 1p7q4t-out-q3
Total bytes 0
Total packets 0
Current depth in bytes 0
Min pg drops 0
No desc drops 0
WRED drops 0
Taildrop drops 0
Queue 1p7q4t-out-q4
Total bytes 0
Total packets 0
Current depth in bytes 0
Min pg drops 0
No desc drops 0
WRED drops 0
Total bytes 0
Min pg drops 0
No desc drops 0
WRED drops 0
Total bytes 0
Total packets 0
Current depth in bytes 0
Min pg drops 0
No desc drops 0
WRED drops 0
Total bytes 0
Total packets 0
Current depth in bytes 0
Min pg drops 0
No desc drops 0
WRED drops 0
Total bytes 0
Total packets 0
Current depth in bytes 0
Min pg drops 0
No desc drops 0
WRED drops 0
Taildrop drops 0
Platform-Specific Drops
Nexus platforms provide in-depth information on various platform-level counters to identify problems with hardware and software components. If packet loss is noticed on a particular interface or line card, the platform-level commands provide information on what is causing the packets to be dropped. For instance, on the Nexus 7000 switch, the command show hardware internal statistics [module slot | module-all] pktflow dropped is used to identify the reason for packet drops. This command details the information per line card module and packet drops across all interfaces on the line card. Example 3-12 displays the packet drops across various ports on the line card in slot 3. The command output displays packet drops resulting from bad packet length, error packets from Media Access Control (MAC), a bad cyclic redundancy check (CRC), and so on. Using the diff keyword along with the command helps identify drops that are increasing on particular interfaces and that result from specific reasons, for further troubleshooting.
Example 3-12 Nexus 7000 Packet Flow Drop Counters
|---------------------------------------|
|Executed at : 2017-06-02 10:09:16.914 |
|---------------------------------------|
Hardware statistics on module 03:
|------------------------------------------------------------------------|
| Device:Flanker Eth Mac Driver Role:MAC Mod: 3 |
| Last cleared @ Fri Jun 2 00:28:46 2017
|------------------------------------------------------------------------|
Instance:0
Cntr Name Value Ports
----- ----- ----- -----
0 igr in upm: pkts rcvd, len(>= 64B, <= mtu) with bad crc 0000000000000001
3 -
1 igr rx pl: received error pkts from mac 0000000000000001 3 -
2 igr rx pl: EM-IPL i/f dropped pkts cnt 0000000000000004 3 -
3 igr rx pl: cbl drops 0000000000002818 3 -
4 igr rx pl: EM-IPL i/f dropped pkts cnt 0000000000000002 4 -
Instance:1
Cntr Name Value Ports
----- ----- ----- -----
5 igr in upm: pkts rcvd, len > MTU with bad CRC 0000000000000001 10 -
6 igr in upm: pkts rcvd, len > MTU with bad CRC 0000000000000001 11 -
7 igr rx pl: EM-IPL i/f dropped pkts cnt 0000000000000002 9 -
8 igr rx pl: EM-IPL i/f dropped pkts cnt 0000000000000011 10 -
9 igr rx pl: cbl drops 0000000000000004 10 -
10 igr rx pl: received error pkts from mac 0000000000000001 11 -
11 igr rx pl: EM-IPL i/f dropped pkts cnt 0000000000000017 11 -
12 igr rx pl: cbl drops 0000000000002812 11 -
Instance:3
Cntr Name Value Ports
----- ----- ----- -----
13 igr rx pl: EM-IPL i/f dropped pkts cnt 0000000000000003 26 -
14 igr rx pl: cbl drops 0000000000000008 26 -
15 igr rx pl: EM-IPL i/f dropped pkts cnt 0000000000000001 31 -
Instance:4
Cntr Name Value Ports
----- ----- ----- -----
16 igr in upm: pkts rcvd, len > MTU with bad CRC 0000000000000027 35 -
17 igr in upm: pkts rcvd, len > MTU with bad CRC 0000000000000044 36 -
18 igr in upm: pkts rcvd, len(>= 64B, <= mtu) with bad crc 0000000000000001
36 -
21 igr rx pl: EM-IPL i/f dropped pkts cnt 0000000000000008 33 -
22 igr rx pl: cbl drops 0000000000002801 33 -
23 igr rx pl: EM-IPL i/f dropped pkts cnt 0000000000000004 34 -
24 egr out pl: total pkts dropped due to cbl 0000000000001769 34 -
29 igr rx pl: received error pkts from mac 0000000000000093 36 -
30 igr rx pl: EM-IPL i/f dropped pkts cnt 0000000000002515 36 -
31 igr rx pl: cbl drops 0000000000002894 36 -
32 igr rx pl: dropped pkts cnt 0000000000000166 36 -
35 igr rx pl: EM-IPL i/f dropped pkts cnt 0000000000000212 38 -
36 igr rx pl: dropped pkts cnt 0000000000000012 38 -
| Device:Flanker Xbar Driver Role:XBR-INTF Mod: 3 |
| Last cleared @ Fri Jun 2 00:28:46 2017
|------------------------------------------------------------------------|
|------------------------------------------------------------------------|
| Device:Flanker Queue Driver Role:QUE Mod: 3 |
| Last cleared @ Fri Jun 2 00:28:46 2017
|------------------------------------------------------------------------|
Instance:4
Cntr Name Value Ports
----- ----- ----- -----
0 igr ib_500: pkt drops 0000000000000003 35 -
1 igr ib_500: pkt drops 0000000000000010 36 -
2 igr ib_500: vq ib pkt drops 0000000000000013 33-40 -
3 igr vq: l2 pkt drop count 0000000000000013 33-40 -
4 igr vq: total pkts dropped 0000000000000013 33-40 -
Instance:5
Cntr Name Value Ports
----- ----- ----- -----
5 igr ib_500: de drops, shared by parser and de 0000000000000004 41-48 -
6 igr ib_500: vq ib pkt drops 0000000000000004 41-48 -
7 igr vq: l2 pkt drop count 0000000000000004 41-48 -
8 igr vq: total pkts dropped 0000000000000004 41-48 -
|------------------------------------------------------------------------|
| Device:Lightning Role:ARB-MUX Mod: 3 |
| Last cleared @ Fri Jun 2 00:28:46 2017
|------------------------------------------------------------------------|
Communication among the supervisor card, line card, and fabric cards occurs over the Ethernet out-of-band channel (EOBC). If errors occur on the EOBC channel, the Nexus switch can experience packet loss and major service loss. EOBC errors are verified using the command show hardware internal cpu-mac eobc stats. The Error Counters section displays a list of errors that occur on the EOBC interface. In most instances, physically reseating the line card fixes the EOBC errors. Example 3-13 displays the EOBC stats for Error Counters on a Nexus 7000 switch. Filter the output for checking just the error counters by using the grep keyword (see Example 3-13).
Example 3-13 EOBC Stats and Error Counters
Error counters
--------------------------------+--
CRC errors ..................... 0
Alignment errors ............... 0
Symbol errors .................. 0
Sequence errors ................ 0
RX errors ...................... 0
Missed packets (FIFO overflow) 0
Single collisions .............. 0
Excessive collisions ........... 0
Multiple collisions ............ 0
Late collisions ................ 0
Collisions ..................... 0
Defers ......................... 0
Tx no CRS ..................... 0
Carrier extension errors ....... 0
Rx length errors ............... 0
FC Rx unsupported .............. 0
Rx no buffers .................. 0
Rx undersize ................... 0
Rx fragments ................... 0
Rx oversize .................... 0
Rx jabbers ..................... 0
Rx management packets dropped .. 0
Tx TCP segmentation context .... 0
Tx TCP segmentation context fail 0
Nexus platforms also provide in-band stats for packets that the central processing unit (CPU) processes. If an error counter shows the inband stats increasing frequently, it could indicate a problem with the supervisor card and might lead to packet loss. To view the CPU in-band statistics, use the command show hardware internal cpu-mac inband stats. This command displays various statistics on packets and length of packets received by or sent from the CPU, interrupt counters, error counters, and present and maximum punt statistics. Example 3-14 displays the output of the in-band stats on the Nexus 7000 switch. This command is also available on the Nexus 9000 switch, as the second output shows.
Example 3-14 Nexus 7000/Nexus 9000 In-Band Stats
RMON counters Rx Tx
----------------------+--------------------+--------------------
total packets 1154193 995903
good packets 1154193 995903
64 bytes packets 0 0
65-127 bytes packets 432847 656132
128-255 bytes packets 429319 8775
256-511 bytes packets 236194 328244
512-1023 bytes packets 619 18
1024-max bytes packets 55214 2734
broadcast packets 0 0
multicast packets 0 0
good octets 262167681 201434260
total octets 0 0
XON packets 0 0
XOFF packets 0 0
management packets 0 0
Interrupt counters
-------------------+--
Assertions 1176322
Rx packet timer 1154193
Rx absolute timer 0
Rx overrun 0
Rx descr min thresh 0
Tx packet timer 0
Tx absolute timer 1154193
Tx queue empty 995903
Tx descr thresh low 0
CRC errors ..................... 0
Alignment errors ............... 0
Symbol errors .................. 0
Sequence errors ................ 0
RX errors ...................... 0
Missed packets (FIFO overflow) 0
Single collisions .............. 0
Excessive collisions ........... 0
Multiple collisions ............ 0
Late collisions ................ 0
Collisions ..................... 0
Defers ......................... 0
Tx no CRS ..................... 0
Carrier extension errors ....... 0
Rx length errors ............... 0
FC Rx unsupported .............. 0
Rx no buffers .................. 0
Rx undersize ................... 0
Rx fragments ................... 0
Rx oversize .................... 0
Rx jabbers ..................... 0
Rx management packets dropped .. 0
Tx TCP segmentation context .... 0
Tx TCP segmentation context fail 0
Throttle statistics
-----------------------------+---------
Throttle interval ........... 2 * 100ms
Packet rate limit ........... 64000 pps
Rate limit reached counter .. 0
Tick counter ................ 193078
Active ...................... 0
Rx packet rate (current/max) 3 / 182 pps
Tx packet rate (current/max) 2 / 396 pps
NAPI statistics
----------------+---------
Weight Queue 0 ......... 512
Weight Queue 1 ......... 256
Weight Queue 2 ......... 128
Weight Queue 3 ......... 16
Weight Queue 4 ......... 64
Weight Queue 5 ......... 64
Weight Queue 6 ......... 64
Weight Queue 7 ......... 64
Poll scheduled . 1176329
Poll rescheduled 0
Poll invoked ... 1176329
Weight reached . 0
Tx packets ..... 995903
Rx packets ..... 1154193
Rx congested ... 0
Rx redelivered . 0
qdisc stats:
----------------+---------
Tx queue depth . 10000
qlen ........... 0
packets ........ 995903
bytes .......... 197450648
drops .......... 0
Inband stats
----------------+---------
Tx src_p stamp . 0
N9396PX-5# show hardware internal cpu-mac inband stats
================ Packet Statistics ======================
Packets received: 58021524
Bytes received: 412371530221
Packets sent: 57160641
Bytes sent: 409590752550
Rx packet rate (current/peak): 0 / 281 pps
Peak rx rate time: 2017-03-08 19:03:21
Tx packet rate (current/peak): 0 / 289 pps
Peak tx rate time: 2017-04-24 14:26:36
Note
The output varies among Nexus platforms. For instance, the previous output is brief and comes from the Nexus 9396 PX switch. The same command output on the Nexus 9508 switch is similar to the output displayed for the Nexus 7000 switch. This command is available on all Nexus platforms.
In the previous output, the in-band stats command on Nexus 9396, though brief, displays the time when the traffic hit the peak rate; such information is not available on the command for the Nexus 7000 switch. Nexus 7000 provides the show hardware internal cpu-mac inband events command, which displays the event history of the traffic rate in the ingress (Rx) or egress (Tx) direction of the CPU, including the peak rate. Example 3-15 displays the in-band events history for the traffic rate in the ingress or egress direction of the CPU. The time stamp of the peak traffic rate is useful when investigating high CPU or packet loss on the Nexus 7000 switches.
Example 3-15 Nexus 7000 In-Band Events
1) Event:TX_PPS_MAX, length:4, at 546891 usecs after Fri Jun 2 01:34:38 2017
new maximum = 396
2) Event:TX_PPS_MAX, length:4, at 526888 usecs after Fri Jun 2 01:31:57 2017
new maximum = 219
3) Event:TX_PPS_MAX, length:4, at 866931 usecs after Fri Jun 2 00:31:30 2017
new maximum = 180
4) Event:RX_PPS_MAX, length:4, at 866930 usecs after Fri Jun 2 00:31:30 2017
new maximum = 182
5) Event:TX_PPS_MAX, length:4, at 826891 usecs after Fri Jun 2 00:30:47 2017
new maximum = 151
6) Event:RX_PPS_MAX, length:4, at 826890 usecs after Fri Jun 2 00:30:47 2017
new maximum = 152
NX-OS also provides with a brief in-band counters CLI that displays the number of in-band packets in both ingress (Rx) and egress (Tx) directions, errors, dropped counters, overruns, and more. These are used to quickly determine whether the in-band traffic is getting dropped. Example 3-16 displays the output of the command show hardware internal cpu-mac inband counters. If nonzero counters appear for errors, drops, or overruns, use the diff keyword to determine whether they are increasing frequently. This command is available on all platforms.
Example 3-16 Nexus In-Band Counters
eth0 Link encap:Ethernet HWaddr 00:0E:0C:FF:FF:FF
inet addr:127.5.1.5 Bcast:127.5.1.255 Mask:255.255.255.0
inet6 addr: fe80::20e:cff:feff:ffff/64 Scope:Link
UP BROADCAST RUNNING PROMISC MULTICAST MTU:9338 Metric:1
RX packets:2475891 errors:0 dropped:0 overruns:0 frame:0
TX packets:5678434 errors:0 dropped:0 overruns:0 carrier:0
collisions:0 txqueuelen:10000
RX bytes:799218439 (762.1 MiB) TX bytes:1099385202 (1.0 GiB)
Packet drops on the Nexus switch happen because of various errors in the hardware. The drops happen either at the line card or on the supervisor module itself. To view the various errors and their counters across all the modules on a Nexus switch, use the command show hardware internal errors [all | module slot]. Example 3-17 displays the hardware internal errors on the Nexus 7000 switch. Note that the command is applicable for all Nexus platforms.
Example 3-17 Hardware Internal Errors
|------------------------------------------------------------------------|
| Device:Clipper MAC Role:MAC Mod: 1 |
| Last cleared @ Wed May 31 12:59:42 2017
| Device Statistics Category :: ERROR
|------------------------------------------------------------------------|
Instance:0
Cntr Name Value Ports
----- ---- ----- -----
148 GD GMAC rx_config_word change interrupt 0000000000000001 - I1
2196 GD GMAC rx_config_word change interrupt 0000000000000003 - I2
2202 GD GMAC symbol error interrupt 0000000000000002 - I2
2203 GD GMAC sequence error interrupt 0000000000000002 - I2
2207 GD GMAC transition from sync to nosync int 0000000000000002 - I2
|------------------------------------------------------------------------|
| Device:Clipper XBAR Role:QUE Mod: 1 |
| Last cleared @ Wed May 31 12:59:42 2017
| Device Statistics Category :: ERROR
|------------------------------------------------------------------------|
|------------------------------------------------------------------------|
| Device:Clipper FWD Role:L2 Mod: 1 |
| Last cleared @ Wed May 31 12:59:42 2017
| Device Statistics Category :: ERROR
|------------------------------------------------------------------------|
Note
Each Nexus platform has different ASICs where errors or drops are observed. However, these are outside the scope of this book. It is recommended to capture show tech-support detail and tac-pac command output during problematic states, to identify the platform-level problems leading to packet loss.
Nexus Fabric Extenders
Fabric Extender (FEX) is a 1RU fixed-configuration chassis designed to provide top-of-rack connectivity for servers. As the name suggests, FEX does not function on its own. It is specifically designed to extend the architecture and functionality of the Nexus switches. FEX is connected to Nexus 9000, 7000, 6000, and 5000 series parent switches. The uplink ports connecting the FEX to the parent switch are called the Fabric ports or network-facing interface (NIF) ports; the ports on the FEX module that connect the servers (front-panel ports) are called the satellite ports or host-facing interface (HFI) ports. Cisco released FEX models in three categories, according to their capabilities and capacity:
1 GE Fabric Extender
N2224TP, 24 port
N2248TP, 48 port
N2248TP-E, 48 port
10GBASE-T Fabric Extender
N2332TQ, 32 port
N2348TQ, 48 port
N2348TQ-E, 48 port
N2232TM, 32 port
N2232TM-E, 32 port
10G SFP+ Fabric Extender
N2348UPQ, 48 port
N2248PQ, 48 port
N2232PP, 48 port
Note
Compatibility between an FEX and its parent switch is based on the software release notes of the software version being used on the Nexus switch.
Connectivity between the parent switch and an FEX occurs in three different modes:
Pinning: In pinning mode, a one-to-one mapping takes place between HIF ports and uplink ports. Thus, traffic from a specific HIF port can traverse only a specific uplink. Failures on uplink ports bring down the mapped HIF ports.
Port-channeling: In this mode, the uplink is treated as one logical interface. All the traffic between the parent switch and FEX is hashed across the different links of the port-channel.
Hybrid: This mode is a combination of the pinning and port-channeling modes. The uplink ports are split into two port-channels and the HIF ports are pinned to a specific uplink port-channel.
Note
Chapter 4, “Nexus Switching,” has more details on the FEX supported and nonsupported designs.
To enable FEX, NX-OS first requires installing the feature set using the command install feature-set fex. Then the feature set for FEX must be installed using the command feature-set fex. If the FEX is being enabled on the Nexus 7000, the FEX feature set is installed in the default VDC along with the command no hardware ip verify address reserved; the feature-set fex then is configured under the relevant VDC. The command no hardware ip verify address reserved is required only when the intrusion detection system (IDS) reserved address check is enabled. This is verified using the command show hardware ip verify. If the check is already disabled, the command no hardware ip verify address reserved is not required to be configured.
When the feature-set fex is enabled, interfaces are enabled as FEX fabric using the command switchport mode fex-fabric. The next step is to assign an ID for the FEX, which is further used to distinguish an FEX on the switch. Example 3-18 illustrates the configuration on the Nexus switch for connecting to an FEX.
Example 3-18 FEX Configuration
N9k-1(config)# feature-set fex
N9k-1(config)# interface Eth3/41-44
N9k-1(config-if)# channel-group 1
N9k-1(config-if)# no shutdown
N9k-1(config-if)# exit
N9k-1(config)# interface port-channel1
N9k-1(config-if)# switchport
N9k-1(config-if)# switchport mode fex-fabric
N9k-1(config-if)# fex associate 101
N9k-1(config-if)# no shutdown
When FEX configuration is complete, the FEX is accessible on the parent switch and its interfaces are available for further configuration. To verify the status of the FEX, use the command show fex. This command shows the status of the FEX, along with the FEX module number and the ID associated by the parent switch. To determine which FEX interfaces are accessible on the parent switch, use the command show interface interface-id fex-intf. Note that the interface-id in this command is the NIF port-channel interface. Example 3-19 examines the output of the show fex and the show interface fex-intf commands to verify the FEX status and its interfaces.
FEX FEX FEX FEX
Number Description State Model Serial
------------------------------------------------------------------------
101 FEX0101 Online N2K-C2248TP-1GE JAF1424AARL
Leaf1# show interface port-channel 1 fex-intf
Fabric FEX
Interface Interfaces
---------------------------------------------------
Po1 Eth101/1/48 Eth101/1/47 Eth101/1/46 Eth101/1/45
Eth101/1/44 Eth101/1/43 Eth101/1/42 Eth101/1/41
Eth101/1/40 Eth101/1/39 Eth101/1/38 Eth101/1/37
Eth101/1/36 Eth101/1/35 Eth101/1/34 Eth101/1/33
Eth101/1/32 Eth101/1/31 Eth101/1/30 Eth101/1/29
Eth101/1/28 Eth101/1/27 Eth101/1/26 Eth101/1/25
Eth101/1/24 Eth101/1/23 Eth101/1/22 Eth101/1/21
Eth101/1/20 Eth101/1/19 Eth101/1/18 Eth101/1/17
Eth101/1/16 Eth101/1/15 Eth101/1/14 Eth101/1/13
Eth101/1/12 Eth101/1/11 Eth101/1/10 Eth101/1/9
Eth101/1/8 Eth101/1/7 Eth101/1/6 Eth101/1/5
Eth101/1/4 Eth101/1/3 Eth101/1/2 Eth101/1/1
Further details on the FEX are viewed using the command show fex fex-number detail. This command displays the status of the FEX and all the FEX interfaces. Additionally, it displays the details of pinning mode and information regarding the FEX fabric ports. Example 3-20 displays the detailed output of the FEX 101.
FEX: 101 Description: FEX0101 state: Online
FEX version: 6.2(12) [Switch version: 6.2(12)]
FEX Interim version: (12)FH_0_171
Switch Interim version: 6.2(12)
Extender Serial: FOC1710R0JF
Extender Model: N2K-C2248PQ-10GE, Part No: 73-14775-03
Card Id: 207, Mac Addr: f0:29:29:ff:8e:c2, Num Macs: 64
Module Sw Gen: 21 [Switch Sw Gen: 21]
Pinning-mode: static Max-links: 1
Fabric port for control traffic: Eth3/41
FCoE Admin: false
FCoE Oper: false
FCoE FEX AA Configured: false
Fabric interface state:
Po1 - Interface Up. State: Active
Eth3/41 - Interface Up. State: Active
Eth3/42 - Interface Up. State: Active
Eth3/43 - Interface Up. State: Active
Eth3/44 - Interface Up. State: Active
Fex Port State Fabric Port
Eth101/1/1 Down Po1
Eth101/1/2 Up Po1
Eth101/1/3 Down Po1
Eth101/1/4 Down Po1
Eth101/1/5 Down Po1
Eth101/1/6 Down Po1
Eth101/1/7 Down Po1
Eth101/1/8 Down Po1
Eth101/1/9 Down Po1
Eth101/1/10 Down Po1
When the FEX satellite ports are available, use them to configure these ports as either Layer 2 or Layer 3 ports; they also can act as active-active ports by making them part of the vPC configuration.
If issues arise with the fabric ports or the satellite ports, the state change information is viewed using the command show system internal fex info fport [all | interface-number] or show system internal fex info satport [all | interface-number]. Example 3-21 displays the internal information of both the satellite and fabric ports on the Nexus 7000 switch. In the first section of the output, the command displays a list of events that the system goes through to bring up the FEX. It lists all the finite state machine events, which is useful while troubleshooting in case the FEX does not come up and gets stuck in one of the states. The second section of the output displays information about the satellite ports and their status information.
Example 3-21 FEX Internal Information
intf ifindex Oper chass module-id Sdp Rx Sdp Tx State AA mode
Po1 0x16000000 Up 101 0x000000000000 0 0 Active 0
Interface : Po1 - 0x16000000 Up Remote chassis: 101
satellite: 0x0, SDP state Init, Rx:0, Tx:0
Not Fabric mode. satellite Not Bound. Fport state: Active
fabric slot:33, SDP module id:0x0, rlink: 0x0
parent:0x0 num mem: 4 num mem up: 4
Fcot: Not checked, Not valid, Not present
Fex AA Mode: 0
Err disable Mode: 0
Oper fabric mode: 0
Logs:
06/04/2017 15:30:19.553797: Remote-chassis configured
Eth3/41 0x1a128000 Up 101 0xc08eff2929f0 169 175 Active 0
Interface : Eth3/41 - 0x1a128000 Up Remote chassis: 101
satellite: 0xc08eff2929f0, SDP state Active, Rx:169, Tx:175
Fabric mode. satellite Bound. Fport state: Active
fabric slot:33, SDP module id:0xc08eff2929f0, rlink: 0x20000000
parent:0x16000000 num mem: 0 num mem up: 0
Active members(0):
Flags: , Bundle membup rcvd, , Switchport fabric,
Fcot: Checked, Valid, Present
Fex AA Mode: 0
Err disable Mode: 0
Oper fabric mode: 2
06/04/2017 15:29:32.777929: Interface Up
06/04/2017 15:29:32.908528: Fcot message sent to Ethpm
06/04/2017 15:29:32.908649: Satellite discovered msg sent
06/04/2017 15:29:32.908744: State changed to: Discovered
06/04/2017 15:29:32.909163: Fcot response received. SFP valid
06/04/2017 15:29:38.931664: Interface Down
06/04/2017 15:29:38.931787: State changed to: Created
06/04/2017 15:29:40.852076: Interface Up
06/04/2017 15:29:42.967594: Fcot message sent to Ethpm
06/04/2017 15:29:42.967661: Satellite discovered msg sent
06/04/2017 15:29:42.967930: State changed to: Discovered
06/04/2017 15:29:42.968363: Fcot response received. SFP valid
06/04/2017 15:29:45.306713: Interface Down
06/04/2017 15:29:45.306852: State changed to: Created
06/04/2017 15:29:45.462260: pre config: is not a port-channel member
06/04/2017 15:30:15.798370: Interface Up
06/04/2017 15:30:15.801215: Port Bringup rcvd
06/04/2017 15:30:15.802072: Suspending Fabric port. reason: Fex not configured
06/04/2017 15:30:15.802106: fport bringup retry end: sending out resp
06/04/2017 15:30:17.413620: Fcot message sent to Ethpm
06/04/2017 15:30:17.413687: Satellite discovered msg sent
06/04/2017 15:30:17.413938: State changed to: Discovered
06/04/2017 15:30:17.414382: Fcot response received. SFP valid
06/04/2017 15:30:19.554112: Port added to port-channel
06/04/2017 15:30:19.554266: State changed to: Configured
06/04/2017 15:30:19.554874: Remote-chassis configured
06/04/2017 15:30:19.568677: Interface Down
06/04/2017 15:30:19.685945: Port removed from port-channel
06/04/2017 15:30:19.686854: fport phy cleanup retry end: sending out resp
06/04/2017 15:30:19.689911: pre config: is a port-channel member
06/04/2017 15:30:19.689944: Port added to port-channel
06/04/2017 15:30:19.690170: Remote-chassis configured
06/04/2017 15:30:19.690383: Port changed to fabric mode
06/04/2017 15:30:19.817093: Interface Up
06/04/2017 15:30:19.817438: Started SDP
06/04/2017 15:30:19.817495: State changed to: Fabric Up
06/04/2017 15:30:19.817991: Port Bringup rcvd
06/04/2017 15:30:19.923327: Fcot message sent to Ethpm
06/04/2017 15:30:19.923502: Fcot response received. SFP valid
06/04/2017 15:30:19.923793: Advertizing Vntag
06/04/2017 15:30:19.924329: State changed to: Connecting
06/04/2017 15:30:21.531270: Satellite connected. Bind msg sent
06/04/2017 15:30:21.532110: fport bringup retry end: sending out resp
06/04/2017 15:30:21.534074: State changed to: Active
06/04/2017 15:30:21.640543: Bundle member bringup rcvd
Interface-Name ifindex State Fabric-if Pri-fabric Expl-Pinned
Note
If any issues arise with the FEX, it is useful to collect show tech-support fex fex-number during the problematic state. The issue might also result from the Ethpm component on Nexus as the FEX sends state change messages to Ethpm. Thus, capturing the show tech-support ethpm output during problematic state could be relevant. Ethpm is discussed later in this chapter.
Virtual Device Context
Virtual Device Contexts (VDC) are logical partitions of a physical device that provide software fault isolation and the capability to manage each partition independently. Each VDC instance runs its own instance of routing protocol services, resulting in better utilization of system resources. Following are the few points to remember before creating VDCs:
Only users with the network-admin role can create a VDC and allocate resources it.
VDC1 (default VDC) is always active and cannot be deleted.
The name of the VDC is not case sensitive.
VDC is supported only on Nexus 7000 or 7700 series switches.
Supervisor 1 and Supervisor 2 support a maximum of four VDCs; Supervisor 2E supports a maximum of eight VDCs.
Nexus switches running Supervisor 2 or 2E cards and beginning with NX-OS version 6.1(1) support the Admin VDC.
Three primary kinds of VDCs are supported on the Nexus 7000 platform:
Ethernet: Supports traditional L2/L3 protocols.
Storage: Supports Fibre Channel over Ethernet (FCoE)–specific protocols, such as FCoE Initialization Protocol (FIP).
Admin: Provides administrative control to the complete system and helps manage other VDCs configured on the system.
VDC Resource Template
A VDC resource template enables users to assign resources to a VDC with the same resource requirements. Unless the resource templates are assigned to a VDC, these templates do not take effect. Using resource templates minimizes the configurations and, at the same time, eases manageability on a Nexus platform. Limit the following resources in each VDC resource template with the following:
Monitor-session: Number of span sessions
Port-channel: Number of port-channels
U4route-mem: IPv4 route memory limit
U6route-mem: IPv6 route memory limit
M4route-mem: IPv4 multicast memory limit
M6route-mem: IPv6 multicast memory limit
Vlan: Number of VLANs
Vrf: Number of Virtual Routing and Forwarding (VRF) instances
The VDC resource template is configured using the command vdc resource template name. This puts you in resource template configuration mode, where you can limit the resources previously mentioned by using the command limit-resource resource minimum value maximum value, where resource can be any of the six listed resources. To view the configured resources within a template, use the command show vdc resource template [vdc-default | name], where vdc-default is for the default VDC template. Example 3-22 demonstrates configuration of a VDC template and the show vdc resource template command output displaying the configured resources within the template.
Example 3-22 VDC Resource Template
Resource Min Max
---------- ----- -----
monitor-rbs-product 0 12
monitor-rbs-filter 0 12
monitor-session-extended 0 12
monitor-session-mx-exception-src 0 1
monitor-session-inband-src 0 1
port-channel 0 768
monitor-session-erspan-dst 0 23
monitor-session 0 2
vlan 16 4094
anycast_bundleid 0 16
m6route-mem 5 20
m4route-mem 8 90
u6route-mem 4 4
u4route-mem 8 8
vrf 2 4096
N7K-1(config)# vdc resource template DEMO-TEMPLATE
N7K-1(config-vdc-template)# limit-resource port-channel minimum 1 maximum 4
N7K-1(config-vdc-template)# limit-resource vrf minimum 5 maximum 100
N7K-1(config-vdc-template)# limit-resource vlan minimum 20 maximum 200
N7K-1# show vdc resource template DEMO-TEMPLATE
Resource Min Max
---------- ----- -----
vlan 20 200
vrf 5 100
port-channel 1 4
If the network requires all the VDCs on Nexus to be performing different tasks and have different kind of resources allocated to them, it is better not to have VDC templates configured. Limit the VDC resources using the limit-resource command under vdc configuration mode.
Configuring VDC
VDC creation is broken down into four simple steps:
Step 1. Define a VDC. A VDC is defined using the command vdc name [id id] [type Ethernet | storage]. By default, a VDC is created as an Ethernet VDC.
Step 2. Allocate interfaces. Single or multiple interfaces are allocated to a VDC. The interfaces are allocated using the command allocate interface interface-id. Note that the allocate interface configuration is mandatory; the interface allocation cannot be negated. Interfaces are allocated only from one VDC to another and cannot be released back to the default VDC. If the user deletes the VDC, the interfaces also get unallocated and are then made part of VDC ID 0.
For the 10G interface, some modules require all the ports tied to the port-ASIC to be moved together. This is done so as to retain the integrity where each port group can switch between dedicated and shared mode. An error message is displayed if not all members of the same port group are allocated together. Beginning with NX-OS Release 5.2(1), all members of a port group are automatically allocated to the VDC when only a member of the port group is being added to the VDC.
Step 3. Define the HA policy. The high availability (HA) policy is determined based on whether Nexus is running on a single supervisor or a dual supervisor card. The HA policy is configured using the command ha-policy [single-sup | dual-sup] policy under the VDC configuration. Table 3-3 lists the different HA policies based on single or dual supervisor cards.
Single SUP |
Dual SUP |
Bringdown |
Bringdown |
Restart (default) |
Restart |
Reset |
Switchover (default) |
Step 4. Limit resources. Limiting resources on VDC is done by either applying a VDC resource template or manually assigning the resource using the limit-resource command. Certain resources cannot be assigned as part of the template; thus, the limit-resource command is required. The limit-resource command also enables you to define the type of modules that are supported in the VDC. When the VDC is initialized, its resources are modified only by using the limit-resource command. The template option then becomes invalid.
Example 3-23 demonstrates the configuration of creating an Ethernet VDC. Notice that if a particular interface is added to the VDC and other members of the port-group are not part of the list, NX-OS automatically tries to add the remaining ports to the VDC. The VDC defined in Example 3-23 limits only for F3 series modules; for instance, adding ports from an F2 or M2 series module would result in an error.
Example 3-23 VDC Configuration
logflash until logflash is online
N7K-1(config-vdc)#
N7K-1(config-vdc)# limit-resource module-type f3
This will cause all ports of unallowed types to be removed from this vdc. Continue
(y/n)? [yes] yes
N7K-1(config-vdc)# allocate interface ethernet 3/1
Entire port-group is not present in the command. Missing ports will be included
automatically
Additional Interfaces Included are :
Ethernet3/2
Ethernet3/3
Ethernet3/4
Ethernet3/5
Ethernet3/6
Ethernet3/7
Ethernet3/8
Moving ports will cause all config associated to them in source vdc to be removed.
Are you sure you want to move the ports (y/n)? [yes] yes
N7K-1(config-vdc)# ha-policy dual-sup ?
bringdown Bring down the vdc
restart Bring down the vdc, then bring the vdc back up
switchover Switchover the supervisor
N7K-1(config-vdc)# ha-policy dual-sup restart
N7K-1(config-vdc)# ha-policy single-sup bringdown
N7K-1(config-vdc)# limit-resource port-channel minimum 3 maximum 5
N7K-1(config-vdc)# limit-resource vlan minimum 20 maximum 100
N7K-1(config-vdc)# limit-resource vrf minimum 5 maximum 10
VDC Initialization
VDC is initialized before VDC-specific configuration is applied. Before VDC initialization, perform a copy run start after the VDC is created so that the newly created VDC is part of the startup configuration. The VDC is initialized using the switchto vdc name command from the default or admin VDC (see Example 3-24). The initialization process of the VDC has steps similar to when a new Nexus switch is brought up. It prompts for the admin password and then the basic configuration dialog. Use this option to perform basic configuration setups for the VDC using this method, or follow manual configuration by replying with no for the basic configuration dialog. The command switchback is used to switch back to default or admin VDC.
Example 3-24 VDC Initialization
---- System Admin Account Setup ----
Enter the password for "admin":
Confirm the password for "admin":
---- Basic System Configuration Dialog VDC: 2 ----
This setup utility will guide you through the basic configuration of
the system. Setup configures only enough connectivity for management
of the system.
Please register Cisco Nexus7000 Family devices promptly with your
supplier. Failure to register may affect response times for initial
service calls. Nexus7000 devices must be registered to receive
entitled support services.
Press Enter at anytime to skip a dialog. Use ctrl-c at anytime
to skip the remaining dialogs.
Would you like to enter the basic configuration dialog (yes/no): yes
Create another login account (yes/no) [n]:
Configure read-only SNMP community string (yes/no) [n]:
Configure read-write SNMP community string (yes/no) [n]:
Enter the switch name : N7k-2
Continue with Out-of-band (mgmt0) management configuration? (yes/no) [y]:
Mgmt0 IPv4 address : 192.168.1.10
Mgmt0 IPv4 netmask : 255.255.255.0
Configure the default gateway? (yes/no) [y]:
IPv4 address of the default gateway : 192.168.1.1
Configure advanced IP options? (yes/no) [n]:
Enable the telnet service? (yes/no) [n]: yes
Enable the ssh service? (yes/no) [y]: yes
Type of ssh key you would like to generate (dsa/rsa) [rsa]:
Number of rsa key bits <1024-2048> [1024]:
Configure default interface layer (L3/L2) [L3]:
Configure default switchport interface state (shut/noshut) [shut]:
The following configuration will be applied:
password strength-check
switchname N7k-2
vrf context management
ip route 0.0.0.0/0 192.168.1.100
exit
feature telnet
ssh key rsa 1024 force
feature ssh
no system default switchport
system default switchport shutdown
interface mgmt0
ip address 192.168.1.1 255.255.255.0
no shutdown
Would you like to edit the configuration? (yes/no) [n]:
Use this configuration and save it? (yes/no) [y]:
N7k-1-N7k-2# switchback
N7k-1#
In Example 3-24, after the VDC is initialized, the host name of the VDC is seen as N7k-1-N7k-2—that is, the hostnames of both the default VDC and the new VDC are concatenated. To avoid this behavior, configure the command no vdc combined-hostname in default or admin VDC.
Out-of-Band and In-Band Management
The Cisco NX-OS software provides a virtual management interface for out-of-band management for each VDC. Each virtual management interface is configured with a separate IP address that is accessed through the physical mgmt0 interface. Using the virtual management interface enables you to use only one management network, which shares the AAA servers and syslog servers among the VDCs.
VDCs also support in-band management. VDC is accessed using one of the Ethernet interfaces that are allocated to the VDC. Using in-band management involves using only separate management networks, which ensures separation of the AAA servers and syslog servers among the VDCs.
VDC Management
NX-OS software provides a CLI to easily manage the VDCs when troubleshooting problems. The VDC configuration of all the VDCs is seen from default or admin VDC. Use the command show run vdc to view all the VDC-related configuration. Additionally, when saving the configuration, use the command copy run start vdc-all to copy the configuration done on all VDCs.
NX-OS provides a CLI to view further details of the VDC without looking at the configuration. Use the command show vdc [detail] to view the details of each VDC. The show vdc detail command displays various lists of information for each VDC, such as ID, name, state, HA policy, CPU share, creation time and uptime of the VDC, VDC type, and line cards supported by each VDC (see Example 3-25). On a Nexus 7000 switch, some VDCs might be running critical services. By default, NX-OS allocates an equal CPU share (CPU resources) to all the VDCs. On SUP2 and SUP2E supervisor cards, NX-OS allows users to allocate a specific amount of the switch’s CPU, to prioritize more critical VDCs.
Example 3-25 show vdc detail Command Output
Switchwide mode is m1 f1 m1xl f2 m2xl f2e f3 m3
vdc state: active
vdc mac address: 50:87:89:4b:c0:c1
CPU Share: 5
vdc restart time: Fri Apr 21 05:57:30 2017
vdc state: active
vdc mac address: 50:87:89:4b:c0:c2
CPU Share: 5
vdc restart time: Sat Apr 22 05:05:59 2017
To further view the details of resources allocated to each VDC, use the command show vdc resource [detail]. This command displays the configured minimum and maximum value and the used, unused, and available values for each resource. The output is run for individual VDCs using the command show vdc name resource [detail]. Example 3-26 displays the resource configuration and utilization for each VDC on the Nexus 7000 chassis running two VDCs (for instance, N7k-1 and N7k-2).
Example 3-26 show vdc resource detail Command Output
vlan 34 used 8 unused 16349 free 16341 avail 16383 total
------
Vdc Min Max Used Unused Avail
--- --- --- ---- ------ -----
N7k-1 16 4094 26 0 4068
N7k-2 16 4094 8 8 4086
monitor-session 0 used 0 unused 2 free 2 avail 2 total
-----------------
Vdc Min Max Used Unused Avail
--- --- --- ---- ------ -----
N7k-1 0 2 0 0 2
N7k-2 0 2 0 0 2
vrf 5 used 0 unused 4091 free 4091 avail 4096 total
-----
Vdc Min Max Used Unused Avail
--- --- --- ---- ------ -----
N7k-1 2 4096 3 0 4091
N7k-2 2 4096 2 0 4091
port-channel 5 used 0 unused 763 free 763 avail 768 total
--------------
Vdc Min Max Used Unused Avail
--- --- --- ---- ------ -----
N7k-1 0 768 5 0 763
N7k-2 0 768 0 0 763
u4route-mem 2 used 102 unused 514 free 412 avail 516 total
-------------
Vdc Min Max Used Unused Avail
--- --- --- ---- ------ -----
N7k-1 96 96 1 95 95
N7k-2 8 8 1 7 7
Based on the kind of line cards the VDC supports, interfaces are allocated to each VDC. To view the member interfaces of each VDC, use the command show vdc membership. Example 3-27 displays the output of the show vdc membership command. In Example 3-27, notice the various interfaces that are part of VDC 1 (N7k-1) and VDC 2 (N7k-2). If a particular VDC is deleted, the interfaces become unallocated and are thus shown under the VDC ID 0.
Example 3-27 R1 Routing Table with GRE Tunnel
Flags : b - breakout port
---------------------------------
vdc_id: 0 vdc_name: Unallocated interfaces:
vdc_id: 1 vdc_name: N7k-1 interfaces:
Ethernet3/9 Ethernet3/10 Ethernet3/11
Ethernet3/12 Ethernet3/13 Ethernet3/14
Ethernet3/15 Ethernet3/16 Ethernet3/17
Ethernet3/18 Ethernet3/19 Ethernet3/20
Ethernet3/21 Ethernet3/22 Ethernet3/23
Ethernet3/24 Ethernet3/25 Ethernet3/26
Ethernet3/27 Ethernet3/28 Ethernet3/29
Ethernet3/30 Ethernet3/31 Ethernet3/32
Ethernet3/33 Ethernet3/34 Ethernet3/35
Ethernet3/36 Ethernet3/37 Ethernet3/38
Ethernet3/39 Ethernet3/40 Ethernet3/41
Ethernet3/42 Ethernet3/43 Ethernet3/44
Ethernet3/45 Ethernet3/46 Ethernet3/47
Ethernet3/48
vdc_id: 2 vdc_name: N7k-2 interfaces:
Ethernet3/1 Ethernet3/2 Ethernet3/3
Ethernet3/4 Ethernet3/5 Ethernet3/6
Ethernet3/7 Ethernet3/8
NX-OS also provides internal event history logs to view errors or messages related to a VDC. Use the command show vdc internal event-history [errors | msgs | vdc_id id] to view the debugging information related to VDCs. Example 3-28 demonstrates creating a new VDC (N7k-3) and shows relevant event history logs that display events the VDC creation process goes through before the VDC is created and active for use. The events in Example 3-28 show the VDC creation in progress and then show that it becomes active.
Example 3-28 VDC Internal Event History Logs
Note: Creating VDC, one moment please ...
2017 Apr 25 04:19:03 %$ VDC-3 %$ %SYSLOG-2-SYSTEM_MSG : Syslogs wont be logged into
logflash until logflash is online
N7k-1(config-vdc)#
N7k-1# show vdc internal event-history vdc_id 3
1) Event:VDC_SEQ_CONFIG, length:170, at 74647 usecs after Tue Apr 25 04:20:31 2017
2) Event:VDC_SEQ_CONFIG, length:170, at 74200 usecs after Tue Apr 25 04:20:31 2017
3) Event:VDC_SEQ_PORT_CONFIG, length:216, at 74130 usecs after Tue Apr 25 04:20:31
2017
4) Event:E_MTS_RX, length:48, at 73920 usecs after Tue Apr 25 04:20:31 2017
[RSP] Opc:MTS_OPC_VDC_PRE_CREATE(20491), Id:0X0047D41A, Ret:SUCCESS
Src:0x00000101/179, Dst:0x00000101/357, Flags:None
HA_SEQNO:0X00000000, RRtoken:0x0047D40D, Sync:UNKNOWN, Payloadsize:4
Payload:
0x0000: 00 00 00 00
5) Event:E_MTS_TX, length:50, at 36406 usecs after Tue Apr 25 04:20:31 2017
[REQ] Opc:MTS_OPC_VDC_PRE_CREATE(20491), Id:0X0047D40D, Ret:SUCCESS
Src:0x00000101/357, Dst:0x00000101/179, Flags:None
HA_SEQNO:0X00000000, RRtoken:0x0047D40D, Sync:UNKNOWN, Payloadsize:6
Payload:
0x0000: 00 03 00 00 00 05
Note
If a problem arises with a VDC, collect the show tech-support vdc and show tech-support detail command output during problematic state to open a TAC case.
Line Card Interop Limitations
Creating VDCs is simple. The challenge arises when interfaces are allocated from different module types present in the chassis. The operating modes of the line cards change with the different combination of line cards present in the chassis. While limiting the module-type resource for the VDC, be careful of the compatibility between M series line cards and F series line cards. Also keep the following guidelines in mind when both F and M series line cards are present in the chassis:
Interfaces from F2E and M3 series line cards cannot coexist.
If M2 module interfaces are working with M3 module interfaces, interfaces from the M2 module cannot be allocated to the other VDC.
If interfaces from both M2 and M3 series line cards are present in the VDC, the M2 module must operate in M2-M3 interop mode.
If interfaces from both F2E and M2 series line cards are present in the VDC, the M2 module must operate in M2-F2E mode.
The M2 module must be in M2-F2E mode to operate in the other VDC.
The M2 series line cards support both M2-F2E and M2-M3 interop modes, with the default being M2-F2E mode. M3 series line cards, on the other hand, support M2-M3 interop mode only. To allocate interfaces from both M2 and M3 modules that are part of same VDC, use the command system interop-mode m2-m3 module slot to change the operating mode of M2 line cards to M2-M3. Use the no option to disable M2-M3 mode and fall back to the default M2-F2E mode on the M2 line card.
To support both M and F2E series modules in the same VDC, F2E series modules operate in proxy mode. In this mode, all Layer 3 traffic is sent to the M series line card in the same VDC.
Table 3-4 reinforces which module type mix is supported on Ethernet VDCs.
Table 3-4 Module Type Supported Combinations on Ethernet VDC
Module |
M1 |
F1 |
M1XL |
M2 |
M3 |
F2 |
F2e |
F3 |
M1 |
Yes |
Yes |
Yes |
Yes |
No |
No |
Yes |
No |
F1 |
Yes |
Yes |
Yes |
Yes |
No |
No |
No |
No |
M1XL |
Yes |
Yes |
Yes |
Yes |
No |
No |
Yes |
No |
M2 |
Yes |
Yes |
Yes |
Yes |
Yes |
No |
Yes |
Yes |
M3 |
No |
No |
No |
Yes |
Yes |
No |
No |
Yes |
F2 |
No |
No |
No |
No |
No |
Yes |
Yes |
Yes |
F2e |
Yes |
No |
Yes |
Yes |
No |
Yes |
Yes |
Yes |
F3 |
No |
No |
No |
Yes |
Yes |
Yes |
Yes |
Yes |
Note
For more details on supported module combinations and the behavior of modules running in different modes, refer to the CCO documentation listed in the “References” section, at the end of the chapter.
Troubleshooting NX-OS System Components
Nexus is a distributed architecture platform, so it runs features that are both platform independent (PI) and platform dependent (PD). In troubleshooting PI features such as the routing protocol control plane, knowing the feature helps in easily isolating the problem; for features in which PD troubleshooting is required, however, understanding the NX-OS system components helps.
Troubleshooting PD issues requires having knowledge about not only various system components but also dependent services or components. For instance, Route Policy Manager (RPM) is a process that is dependent on the Address Resolution Protocol (ARP) and Netstack processes (see Example 3-29). These processes are further dependent on other processes. The hierarchy of dependency is viewed using the command show system internal sysmgr service dependency srvname name.
Example 3-29 Feature Dependancy Hierarchy
"rpm"
|_______ "arp"
|_______ "adjmgr"
|_______ "l3vm"
|_______ "res_mgr"
|_______ "netstack"
|_______ "adjmgr"
|_______ "l3vm"
|_______ "res_mgr"
|_______ "urib"
|_______ "res_mgr"
|_______ "u6rib"
|_______ "res_mgr"
|_______ "l3vm"
|_______ "res_mgr"
|_______ "ifmgr"
|_______ "pktmgr"
|_______ "adjmgr"
|_______ "l3vm"
|_______ "res_mgr"
|_______ "urib"
|_______ "res_mgr"
|_______ "u6rib"
|_______ "res_mgr"
|_______ "l3vm"
|_______ "res_mgr"
|_______ "ifmgr"
|_______ "aclmgr"
|_______ "ifmgr"
|_______ "vmm"
Of course, knowledge of all components is not possible, but problem isolation becomes easier with knowledge of some primary system components that perform major tasks in the NX-OS platforms. This section focuses on some of these primary components:
Message and Transaction Services (MTS)
Netstack and Packet Manager
ARP and AdjMgr
Forwarding components
Unicast Routing Information Base (URIB), Unicast Forwarding Information Base (UFIB), and Unicast Forwarding Distribution Manager (UFDM)
EthPM and Port-Client
Message and Transaction Services
Message and Transaction Service (MTS) is the fundamental communication paradigm that supervisor and line cards use to communicate between processes. In other words, it is an interprocess communications (IPC) broker that handles message routing and queuing between services and hardware within the system. On the other hand, internode communication (for instance, communication between process A on a supervisor and process B on a line card) is handled by Asynchronous Inter-Process Communication (AIPC). AIPC provides features such as reliable transport across Ethernet Out of Band Channel (EOBC), fragmentation, and reassembly of packets.
MTS provides features such as the following:
Messaging and HA infrastructure
High performance and low latency (provides low latency for exchanging messages between interprocess communications)
Buffer management (manages the buffer for respective processes that are queued up to be delivered to other processes)
Message delivery
MTS guarantees independent process restarts so that it does not impact other client or nonclient processes running on the system and to ensure that the messages from other processes are received after a restart.
A physical switch can be partitioned to multiple VDCs for resource partitioning, fault isolation, and administration. One of the main features of the NX-OS infrastructure is to make virtualization transparent to the applications. MTS provides this virtualization transparency using the virtual node (vnode) concept and an architecturally clean communication model. With this concept, an application thinks that it is running on a switch, with no VDC.
MTS works by allocating a predefined chunk of system memory when the system boots up. This memory exists in the kernel address space. When applications start up, the memory gets automatically mapped to the application address space. When an application tries to send some data to the queue, MTS makes one copy of the data and copies the payload into a buffer. It then posts a reference to the buffer into the application’s receive queue. When the application tries to read its queue, it gets a reference to the payload, which it reads directly as it’s already mapped in its address space.
Consider a simple example. OSPF learns a new route from an LSA update from its adjacent neighbor. The OSPF process requires that the route be installed in the routing table. The OSPF process puts the needed information (prefix, next hop, and so on) into an MTS message, which it then sends to URIB. In this example, MTS is taking care of exchanging the information between the OSPF and the URIB components.
MTS facilitates the interprocess communication using Service Access Points (SAP) to allow services to exchange messages. Each card in the switch has at least one instance of MTS running, also known as the MTS domain. The node address is used to identify which MTS domain is involved in processing a message. The MTS domain is kind of a logical node that provides services only to the processes inside that domain. Inside the MTS domain, a SAP represents the address used to reach a service. A process needs to bind to a SAP before it communicates with another SAP. SAPs are divided into three categories:
Static SAPs: Ranges from 1 to 1023
Dynamic SAPs: Ranges from 1024 to 65535
Registry SAP: 0 (reserved)
Note
A client is required to know the server’s SAP (usually a static SAP) to communicate with the server.
An MTS address is divided into two parts: a 4-byte node address and a 2-byte SAP number. Because an MTS domain provides services to the processes associated with that domain, the node address in the MTS address is used to decide the destination MTS domain. Thus, the SAP number resides in the MTS domain identified by the node address. If the Nexus switch has multiple VDCs, each VDC has its own MTS domain; this is reflected as SUP for VDC1, SUP-1 for VDC2, SUP-2 for VDC3, and so on.
MTS also has various operational codes to identify different kinds of payloads in the MTS message:
sync: This is used to synchronize information to standby.
notification: The operations code is used for one-way notification.
request_response: The message carries a token to match the request and response.
switchover_send: The operational code can be sent during switchover.
switchover_recv: The operational code can be received during switchover.
seqno: The operational code carries a sequence number.
Various symptoms can indicate problems with MTS, and different symptoms mean different problems. If a feature or process is not performing as expected, high CPU is noticed on the Nexus switch, or ports are bouncing on the switch for no reason, then the MTS message might be stuck in the queue. The easiest way to check is to check the MTS buffer utilization, using the command show system internal mts buffer summary. This output needs to be taken several times to see which queues are not clearing. Example 3-30 demonstrates how the MTS buffer summary looks when the queues are not clearing. The process with SAP number 2938 seems to be stuck because the messages are stuck in the receive queue; the other process with SAP number 2592 seems to have cleared the messages from the receive queue.
Example 3-30 MTS Message Stuck in Queue
node sapno recv_q pers_q npers_q log_q
sup 2938 367 0 0 0
sup 2592 89 0 0 0
sup 284 0 10 0 0
N7k-1# show system internal mts buffers summary
node sapno recv_q pers_q npers_q log_q
sup 2938 367 0 0 0
sup 2592 27 0 0 0
sup 284 0 10 0 0
Table 3-5 gives the queue names and their functions.
Table 3-5 MTS Queue Names and Functions
Abbreviation |
Queue Name |
Function |
recv_q |
Receive Queue |
|
pers_q |
Persistent Queue |
Messages in this queue survive through the crash. MTS replays the message after the crash. |
npers_q |
Nonpersistent Queue |
Messages do not survive the crash. |
log_q |
Log Queue |
MTS logs the message when an application sends or receives the message. The application uses logging for transaction recovery in restart. The application retrieves logged messages explicitly after restart. |
Messages stuck in the queue lead to various impacts on the device. For instance, if the device is running BGP, you might randomly see BGP flaps or BGP peering not even coming up, even though the BGP peers might have reachability and correct configuration. Alternatively, the user might not be able to perform a configuration change, such as adding a new neighbor configuration.
After determining that the messages are stuck in one of the queues, identify the process associated with the SAP number. The command show system internal mts sup sap sapno description obtains this information. The same information also can be viewed from the sysmgr output using the command show system internal sysmgr service all. For details about all the queued messages, use the command show system internal mts buffers detail. Example 3-31 displays the description of the SAP 2938, which shows the statsclient process. The statsclient process is used to collect statistics on supervisor or line card modules. The second section of the output displays all the messages present in the queue.
Example 3-31 SAP Description and Queued MTS Messages
Below shows sap on default-VDC, to show saps on non-default VDC, run
show system internal mts node sup-<vnode-id> sap ...
Node/Sap/queue Age(ms) SrcNode SrcSAP DstNode OPC MsgSize
sup/3570/nper 5 0x601 3570 0x601 7679 30205
sup/2938/recv 50917934468 0x802 980 0x601 26 840
sup/2938/recv 50899918777 0x802 980 0x601 26 840
sup/2938/recv 50880095050 0x902 980 0x601 26 840
sup/2938/recv 46604123941 0x802 980 0x601 26 840
sup/2938/recv 46586081502 0x902 980 0x601 26 840
sup/2938/recv 46569929011 0x802 980 0x601 26 840
Below shows sap on default-VDC, to show saps on non-default VDC, run
show system internal mts node sup-<vnode-id> sap ...
Note
The SAP description information in Example 3-31 is taken from the default VDC. For the information on the nondefault DVC, use the command show system internal mts node sup-[vnode-id] sap sapno description.
The first and most important field to check in the previous output is the SAP number and its age. If the duration of the message stuck in the queue is fairly long, those messages need to be investigated; they might be causing services to misbehave on the Nexus platform. The other field to look at is OPC, which refers to the operational code. After the messages in the queue are verified from the buffers detail output, use the command show system internal sup opcodes to determine the operational code associated with the message, to understand the state of the process.
SAP statistics are also viewed to verify different queue limits of various SAPs and to check the maximum queue limit that a process has reached. This is done using the command show system internal mts sup sap sapno stats (see Example 3-32).
Example 3-32 MTS SAP Statistics
Below shows sap on default-VDC, to show saps on non-default VDC, run
show system internal mts node sup-<vnode-id> sap ...
msg tx: 14
byte tx: 1286
msg rx: 30
byte rx: 6883
opc sent to myself: 0
max_q_size q_len limit (soft q limit): 4096
max_q_size q_bytes limit (soft q limit): 15%
rebind count: 0
Waiting for response: none
buf in transit: 14
bytes in transit: 1286
Along with these verification checks, MTS error messages are seen in OBFL logs or syslogs. When the MTS queue is full, the error logs in Example 3-33 appear. Use the command show logging onboard internal kernel to ensure that no error logs are reported as a result of MTS.
available_old():1641: regular+fast mesg total = 48079,
soft limit = 1024 - kernel
2017 Apr 30 18:23:05.415 n7k 30 18:23:05 %KERN-2-SYSTEM_MSG: mts_is_q_space_
available_old(): NO SPACE - node=0, sap=27, uuid=26, pid=26549,
sap_opt = 0x1, hdr_opt = 0x10, rq=48080(11530072), lq=0(0), pq=0(0), nq=0(0),
sq=0(0), fast:rq=0, lq=0, pq=0, nq=0, sq=0 - kernel
The MTS errors are also reported in the MTS event history logs and can be viewed using the command show system internal mts event-history errors.
If the MTS queue is stuck or an MTS buffer leak is observed, performing a supervisor switchover clears the MTS queues and helps recover from service outages from an MTS queue stuck problem.
Note
If SAP number 284 appears in the MTS buffer queue, ignore it: It belongs to the TCPUDP process client and is thus expected.
Netstack and Packet Manager
Netstack is the NX-OS implementation of the user-mode Transmission Control Protocol (TCP)/Internet Protocol (IP) stack, which runs only on the supervisor module. The Netstack components are implemented in user space processes. Each Netstack component runs as a separate process with multiple threads. In-band packets and features specific to NX-OS, such as vPC- and VDC-aware capabilities, must be processed in software. Netstack is the NX-OS component in charge of processing software-switched packets. As stated earlier, the Netstack process has three main roles:
Pass in-band packets to the correct control plane process application
Forward in-band punted packets through software in the desired manner
Maintain in-band network stack configuration data
Netstack is made up of both Kernel Loadable Module (KLM) and user space components. The user space components are VDC local processes containing Packet Manager, which is the Layer 2 processing component; IP Input, the Layer 3 processing component; and TCP/UDP functions, which handle the Layer 4 packets. The Packet Manager (PktMgr) component is mostly isolated with IP input and TCP/UDP, even though they share the same process space. Figure 3-1 displays the Netstack architecture and the components part of KLM and user space.
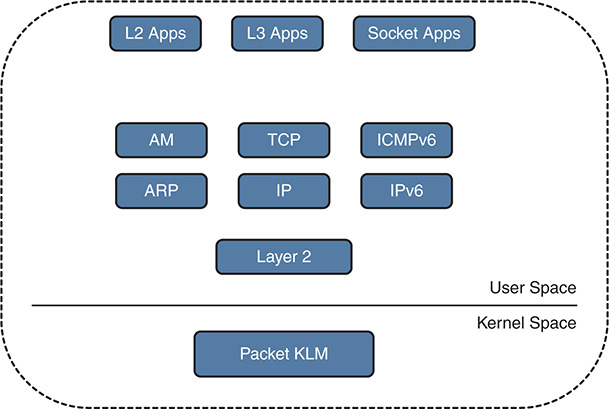
Figure 3-1 Netstack Architecture
Troubleshooting issues with Netstack is easiest by first understanding how Netstack forms the packet processing. The packets are hardware switched to the supervisor in-band interface. The packet KLM processes the frame. The packet KLM performs minimal processing of the data bus (DBUS) header and performs the source interface index lookup to identify which VDC the packet belongs to. The KLM performs minimal processing of the packet, so exposure is limited to crashes at the kernel level and no privilege escalation occurs. Most of the packet processing happens in the user space, allowing multiple instances of the Netstack process (one per each VDC) and restartability in case of a process crash.
Netstack uses multiple software queues to support prioritization of critical functions. In these queues, Bridge Protocol Data Units (BPDU) are treated under a dedicated queue, whereas all other inband traffic is separated into Hi or Low queues in the kernel driver. To view the KLM statistics and see how many packets have been processed by different queues, use the command show system inband queuing statistics (see Example 3-34). Notice that the KLM maps the Address Resolution Protocol (ARP) and BPDU packets separately. If any drops in the BPDU queue or any other queue take place, those drop counters are identified in the Inband Queues section of the output.
Example 3-34 In-Band Netstack KLM Statistics
Inband packets unmapped to a queue: 0
In KLM packets mapped to bpdu: 0
In KLM packets mapped to arp : 0
In KLM packets mapped to q0 : 0
In KLM packets mapped to q1 : 0
In KLM packets mapped to veobc : 0
Inband Queues:
(q1): recv 0, drop 0, congested 0 rcvbuf 2097152, sndbuf 4194304 no drop 0
The PktMgr is the lower-level component within the Netstack architecture that takes care of processing all in-band or management frames received from and sent to KLM. The PktMgr demultiplexes the packets based on Layer 2 (L2) packets and platform header information and passes them to the L2 clients. It also dequeues packets from L2 clients and sends the packets out the appropriate driver. All the L2 or non-IP protocols, such as Spanning Tree Protocol (STP), Cisco Discovery Protocol (CDP), Unidirectional Link Detection (UDLD), Cisco Fabric Services (CFS), Link Aggregation Control Protocol (LACP), and ARP, register directly with PktMgr. IP protocols register directly with the IP Input process.
The Netstack process runs on the supervisor, so the following packets are sent to the supervisor for processing:
L2 clients – BPDU addresses: STP, CDP, and so on
EIGRP, OSPF, ICMP, PIM, HSRP, and GLBP protocol packets
Gateway MAC address
Exception packets
Glean adjacency
Supervisor-terminated packets
IPv4/IPv6 packets with IP options
Same interface (IF) check
Reverse Path Forwarding (RPF) check failures
Time to live (TTL) expired packets
The Netstack process is stateful across restarts and switchovers. The Netstack process depends on Unicast Routing Information Base (URIB), IPv6 Unicast Routing Information Base (U6RIB), and the Adjacency Manager (ADJMGR) process for bootup. Netstack uses a CLI server process to restore the configuration and uses persistent storage services (PSS) to restore the state of processes that were restarted. It uses RIB shared memory for performing L3 lookup; it uses an AM shared database (SDB) to perform the L3-to-L2 lookup. For troubleshooting purpose, Netstack provides various internal show commands and debugs that can help determine problems with different processes bound with Netstack:
Packet Manager
IP/IPv6
TCP/UDP
ARP
Adjacency Manager (AM)
To understand the workings of the Packet Manager component, consider an example with ICMPv6. ICMPv6 is a client of PktMgr. When the ICMPv6 process first initializes, it registers with PktMgr and is assigned a client ID and control (Ctrl) SAP ID and Data SAP ID. MTS handles communication between the PktMgr and ICMPv6. The Rx traffic from PktMgr toward ICMPv6 is handed off to MTS with the destination of the data SAP ID. The Tx traffic from ICMPv6 toward PktMgr is sent to the Ctrl SAP ID. PktMgr receives frame from ICMPv6, builds the correct header, and sends it to KLM to transport to the hardware.
To troubleshoot any of the PktMgr clients, figure out the processes that are clients of PktMgr component. This is done by issuing the command show system internal pktmgr client. This command returns the UUIDs and the Ctrl SAP ID for the PktMgr clients. The next step is to view the processes under the Service Manager, to get the information on the respective Universally Unique Identifier (UUID) and SAP ID. Example 3-35 illustrates these steps. When the correct process is identified, use the command show system internal pktmgr client uuid to verify the statistics for the PktMgr client, including drops.
Example 3-35 In-Band Netstack KLM Statistics
Client uuid: 263, 2 filters, pid 4000
Ctrl SAP: 246
Total Data SAPs : 1 Data SAP 1: 247
Client uuid: 268, 4 filters, pid 3998
Ctrl SAP: 278
Total Data SAPs : 2 Data SAP 1: 2270 Data SAP 2: 2271
Client uuid: 270, 1 filters, pid 3999
Ctrl SAP: 281
Total Data SAPs : 1 Data SAP 1: 283
Client uuid: 545, 3 filters, pid 4054
Ctrl SAP: 262
Total Data SAPs : 1 Data SAP 1: 265
Client uuid: 303, 2 filters, pid 4186
Ctrl SAP: 171
Total Data SAPs : 1 Data SAP 1: 177
Client uuid: 572, 1 filters, pid 4098
Ctrl SAP: 425
Total Data SAPs : 1 Data SAP 1: 426
Name UUID PID SAP state Start count Tag Plugin ID
------- ---------- ------ ----- --------- ----------- ------ ----------
icmpv6 0x0000010E 3999 281 s0009 1 N/A 0
Client uuid: 270, 1 filters, pid 3999
Filter 1: EthType 0x86dd, DstIf 0x150b0000, Excl. Any
Input Rx: 0, Drop: 0
Rx pps Inst/Max: 0/0
Tx pps Inst/Max: 0/0
COS=0 Rx: 0, Tx: 0 COS=1 Rx: 0, Tx: 0
COS=2 Rx: 0, Tx: 0 COS=3 Rx: 0, Tx: 0
COS=4 Rx: 0, Tx: 0 COS=5 Rx: 0, Tx: 0
COS=6 Rx: 0, Tx: 0 COS=7 Rx: 0, Tx: 0
If the packets being sent to the supervisor are from a particular interface, verify the PktMgr statistics for the interface using the command show system internal pktmgr interface interface-id (see Example 3-36). This example explicitly shows how many unicast, multicast, and broadcast packets were sent and received.
Example 3-36 Interface PktMgr Statistics
Ethernet1/1, ordinal: 10 Hash_type: 0
SUP-traffic statistics: (sent/received)
Packets: 355174 / 331146
Bytes: 32179675 / 27355507
Instant packet rate: 0 pps / 0 pps
Packet rate limiter (Out/In): 0 pps / 0 pps
Average packet rates(1min/5min/15min/EWMA):
Packet statistics:
Tx: Unicast 322117, Multicast 33054
Broadcast 3
Rx: Unicast 318902, Multicast 12240
Broadcast 4
PktMgr accounting (statistics) is useful in determining whether any low-level drops are occurring because of bad encapsulation or other kernel interaction issues. This is verified using the command show system internal pktmgr stats [brief] (see Example 3-37). This command shows the PktMgr driver interface to the KLM. The omitted part of the output also shows details about other errors and the management driver.
Example 3-37 PktMgr Accounting
Route Processor Layer-2 frame statistics
Inband driver: valid 1, state 0, rd-thr 1, wr-thr 0, Q-count 0
Inband sent: 1454421, copy_drop: 0, ioctl_drop: 0, unavailable_buffer_hdr_drop: 0
Inband standby_sent: 0
Inband encap_drop: 0, linecard_down_drop: 0
Inband sent by priority [0=1041723,6=412698]
Inband max output queue depth 0
Inband recv: 345442, copy_drop: 0, ioctl_drop: 0, unavailable_buffer_hdr_drop: 0
Inband decap_drop: 0, crc_drop: 0, recv by priority: [0=345442]
Inband bad_si 0, bad_if 0, if_down 0
Inband last_bad_si 0, last_bad_if 0, bad_di 0
Inband kernel recv 85821, drop 0, rcvbuf 33554432, sndbuf 33554432
--------------------------------------------
Driver:
--------------------------------------------
State: Up
Filter: 0x0
! Output omitted for brevity
For IP processing, Netstack queries the URIB—that is, the routing table and all other necessary components, such as the Route Policy Manager (RPM)—to make a forwarding decision for the packet. Netstack performs all the accounting in the show ip traffic command output. The IP traffic statistics are used to track fragmentation, Internet Control Message Protocol (ICMP), TTL, and other exception packets. This command also displays the RFC 4293 traffic statistics. An easy way to figure out whether the IP packets are hitting the NX-OS Netstack component is to observe the statistics for exception punted traffic, such as fragmentation. Example 3-38 illustrates the different sections of the show ip traffic command output.
Example 3-38 PktMgr Accounting
Transmission and reception:
Packets received: 0, sent: 0, consumed: 0,
Forwarded, unicast: 0, multicast: 0, Label: 0
Ingress mcec forward: 0
Opts:
end: 0, nop: 0, basic security: 0, loose source route: 0
timestamp: 0, record route: 0
strict source route: 0, alert: 0,
other: 0
Errors:
Bad checksum: 0, packet too small: 0, bad version: 0,
Bad header length: 0, bad packet length: 0, bad destination: 0,
Bad ttl: 0, could not forward: 0, no buffer dropped: 0,
Bad encapsulation: 0, no route: 0, non-existent protocol: 0
Bad options: 0
Vinci Migration Packets : 0
Total packet snooped : 0
Total packet on down svi : 0
Stateful Restart Recovery: 0, MBUF pull up fail: 0
Bad context id: 0, rpf drops: 0 Bad GW MAC 0
Ingress option processing failed: 0
NAT inside drop: 0, NAT outside drop: 0
Ingress option processing failed: 0 Ingress mforward failed: 0
Ingress lisp drop: 0
Ingress lisp decap drop: 0
Ingress lisp encap drop: 0
Ingress lisp encap: 0
Ingress Mfwd copy drop: 0
Ingress RA/Reass drop: 0
Ingress ICMP Redirect processing drop: 0
Ingress Drop (ifmgr init): 0,
Ingress Drop (invalid filter): 0
Ingress Drop (Invalid L2 msg): 0
ACL Filter Drops :
Ingress - 0
Egree - 0
Directed Broadcast - 0
Fragmentation/reassembly:
Fragments created per protocol
Transmission:
Redirect: 0, unreachable: 0, echo request: 0, echo reply: 0,
Mask request: 0, mask reply: 0, info request: 0, info reply: 0,
Parameter problem: 0, source quench: 0, timestamp: 0,
Timestamp response: 0, time exceeded: 0,
Irdp solicitation: 0, irdp advertisement: 0
Output Drops - badlen: 0, encap fail: 0, xmit fail: 0
ICMP originate Req: 0, Redirects Originate Req: 0
Originate deny - Resource fail: 0, short ip: 0, icmp: 0, others: 0
Reception:
Redirect: 0, unreachable: 0, echo request: 0, echo reply: 0,
Mask request: 0, mask reply: 0, info request: 0, info reply: 0,
Parameter problem: 0, source quench: 0, timestamp: 0,
Timestamp response: 0, time exceeded: 0,
Irdp solicitation: 0, irdp advertisement: 0,
Format error: 0, checksum error: 0
Lisp processed: 0, No clients: 0: Consumed: 0
Replies: 0, Reply drops - bad addr: 0, inactive addr: 0
Statistics last reset: never
Reception
Pkts recv: 0, Bytes recv: 0,
inhdrerrors: 0, innoroutes: 0, inaddrerrors: 0,
inunknownprotos: 0, intruncatedpkts: 0, inforwdgrams: 0,
reasmreqds: 0, reasmoks: 0, reasmfails: 0,
indiscards: 0, indelivers: 0,
inmcastpkts: 0, inmcastbytes: 0,
inbcastpkts: 0,
Transmission
outrequests: 0, outnoroutes: 0, outforwdgrams: 0,
outdiscards: 0, outfragreqds: 0, outfragoks: 0,
outfragfails: 0, outfragcreates: 0, outtransmits: 0,
bytes sent: 0, outmcastpkts: 0, outmcastbytes: 0,
outbcastpkts: 0, outbcastbytes: 0
Netstack TCPUDP Component
The TCPUDP process has the following functionalities:
TCP
UDP
Raw packet handling
Socket layer and socket library
The TCP/UDP stack is based on BSD and supports a standards-compliant implementation of TCP and UDP. It supports features such as window scaling, slow start, and delayed acknowledgment. It does not support TCP selective ACK and header compression. The socket library is Portable Operating System Interface (POSIX) compliant and supports all standard socket system calls, as well as the file system-based system calls. The Internet Protocol control block (INPCB) hash table stores the socket connection data. The sockets are preserved upon Netstack restart but not upon supervisor switchover. The process has 16 TCP/UDP worker threads to provide all the functionality.
Consider now how TCP socket creation happens on NX-OS. When it receives the TCP SYN packet, Netstack builds a stub INPCB entry into the hash table. The partial information is then populated into the protocol control block (PCB). When the TCP three-way handshake is completed, all TCP socket information is populated to create a full socket. This process is verified by viewing the output of the debug command debug sockets tcp pcb. Example 3-39 illustrates the socket creation and Netstack interaction with the help of the debug command. From the debug output, notice that when the SYN packet is received, it gets added into the cache; when the three-way handshake completes, a full-blown socket is created.
Example 3-39 TCP Socket Creation and Netstack
2017 May 4 00:52:03.432086 netstack: syncache_insert: SYN added for
L:10.162.223.34.20608 F:10.162.223.33.179, tp:0x701ff01c inp:0x701fef54
2017 May 4 00:52:03.434633 netstack: in_pcballoc: PCB: Allocated pcb, ipi_count:6
2017 May 4 00:52:03.434704 netstack: syncache_socket: Created full blown socket
with F:10.162.223.34.20608 L:10.162.223.33.179 peer_mss 1460
2017 May 4 00:52:03.434930 netstack: in_setpeeraddr: PCB: in_setpeeraddr
L 10.162.223.33.179 F 10.162.223.34.20608 C: 3
2017 May 4 00:52:03.435200 netstack: in_setsockaddr: PCB: in_setsockaddr
L 10.162.223.33.179 F 10.162.223.34.20608 C: 3
Necessary details of the TCP socket connection are verified using the command show sockets connection tcp [detail]. The output with the detail option provides information such as TCP windowing information, the MSS value for the session, and the socket state. The output also provides the MTS SAP ID. If the TCP socket is having a problem, look up the MTS SAP ID in the buffer to see whether it is stuck in a queue. Example 3-40 displays the socket connection details for BGP peering between two routers.
Example 3-40 TCP Socket Creation and Netstack
Total number of tcp sockets: 6
Options: REUSEADR, pcb flags none, state: | NBIO
cc: 0, hiwat: 17520, lowat: 1, flags: none
Send buffer:
cc: 19, hiwat: 17520, lowat: 2048, flags: none
Sequence number state:
iss: 1129891008, snduna: 1129891468, sndnxt: 1129891487, sndwnd: 15925
irs: 3132858499, rcvnxt: 3132858925, rcvwnd: 17520, sndcwnd: 65535
Timing parameters:
srtt: 3500 ms, rtt: 0 ms, rttv: 1000 ms, krtt: 1000 ms
rttmin: 1000 ms, mss: 1460, duration: 49500 ms
No MD5 peers Context: devl-user-1
Netstack socket clients are monitored with the command show sockets client detail. This command explains the socket client behavior and shows how many socket library calls the client has made. This command is useful in identifying issues a particular socket client is facing because it also displays the Errors section, where errors are reported for a problematic client. As Example 3-41 illustrates, the output displays two clients, syslogd and bgp. The output shows the associated SAP ID with the client and statistics on how many socket calls the process has made. The Errors section is empty because no errors are seen for the displayed sockets.
Example 3-41 Netstack Socket Client Details
Total number of clients: 7
client: syslogd, pid: 3765, sockets: 2
cancel requests: 0
cancel unblocks: 0
cancel misses: 0
select drops: 0
select wakes: 0
sockets: 27:1(mts sap: 2336), 28:2(mts sap: 2339)
Statistics:
socket calls: 2 fcntl calls: 6 setsockopt calls: 6
socket_ha_update calls: 6
Errors:
client: bgp, pid: 4639, sockets: 3
cancel unblocks: 0
cancel misses: 0
select drops: 0
select wakes: 0
sockets: 49:13(mts sap: 2894), 51:14(mts sap: 2896), 54:15(mts sap: 14545)
accept calls: 14 accept_dispatch errors: 14 connect_dispatch: 3
close calls: 16 fcntl calls: 9 setsockopt calls: 31
getsockname calls: 11 socket_ha_update calls: 38 Fast tcp send requests:
207802
pconnect_einprogress errors: 3 pclose_sock_null errors: 14
Statistics: Cancels 100811, Cancel-unblocks 100808, Cancel-misses 1
Select-drops 2, Select-wakes 100808.
Netstack also has an accounting capability that gives statistics on UDP, TCP, raw sockets, and internal tables. The Netstack socket statistics are viewed using the command show sockets statistics all. This command helps view TCP drops, out-of-order packets, or duplicate packets; the statistics are maintained on a per-Netstack instance basis. At the end of the output, statistics and error counters are also viewed for INPCB and IN6PCB tables. The table statistics provides insight into how many socket connections are being created and deleted in Netstack. The Errors part of the INPCB or IN6PCB table indicates a problem while allocating socket information. Example 3-42 displays the Netstack socket accounting statistics.
Example 3-42 Netstack Socket Accounting
TCP v4 Received:
402528 total packets received, 203911 packets received in sequence,
3875047 bytes received in sequence, 8 out-of-order packets received,
10 rcvd duplicate acks, 208189 rcvd ack packets,
3957631 bytes acked by rcvd acks, 287 Dropped no inpcb,
203911 Fast recv packets enqueued, 16 Fast TCP can not recv more,
208156 Fast TCP data ACK to app,
TCP v4 Sent:
406332 total packets sent, 20 control (SYN|FIN|RST) packets sent,
208162 data packets sent, 3957601 data bytes sent,
198150 ack-only packets sent,
INPCB Statistics:
in_pcballoc: 38 in_pcbbind: 9
in_pcbladdr: 18 in_pcbconnect: 14
in_pcbdetach: 19 in_pcbdetach_no_rt: 19
in_setsockaddr: 13 in_setpeeraddr: 14
in_pcbnotify: 1 in_pcbinshash_ipv4: 23
in_pcbinshash_ipv6: 5 in_pcbrehash_ipv4: 18
in_pcbremhash: 23
IN6PCB Statistics:
in6_pcbbind: 5
in6_pcbdetach: 4 in6_setsockaddr: 1
in6_pcblookup_local: 2
Multiple clients (ARP, STP, BGP, EIGRP, OSPF, and so on) interact with the Netstack component. Thus, while troubleshooting control plane issues, if you are able to see the packet in Ethanalyzer but the packet is not received by the client component itself, the issue might be related to the Netstack or the Packet Manager (Pktmgr). Figure 3-2 illustrates the control plane packet flow and placement of the Netstack and Pktmgr components in the system.

Figure 3-2 Control Plane Troubleshooting—Traffic Path
Note
If an issue arises with any Netstack component or Netstack component clients, such as OSPF or TCP failure, collect output from the commands show tech-support netstack and show tech-support pktmgr, along with the relevant client show tech-support outputs, to aid in further investigation by the Cisco TAC.
ARP and Adjacency Manager
The ARP component handles ARP functionality for the Nexus switch interfaces. The ARP component registers with PktMgr as a Layer 2 component and provides a few other functionalities:
Manages Layer 3–to–Layer 2 adjacency learning and timers
Manages static ARP entries
Punts the glean adjacency packets to the CPU, which then triggers ARP resolution
Adds ARP entries into the Adjacency Manager (AM) database
Manages virtual addresses registered by first-hop redundancy protocols (FHRP), such as Virtual Router Redundancy Protocol (VRRP), Hot Standby Router Protocol (HSRP), and Gateway Load-Balancing Protocol (GLBP)
Has clients listening for ARP packets such as ARP snooping, HSRP, VRRP, and GLBP
All the messaging and communication with the ARP component happens with the help of MTS. ARP packets are sent to PktMgr via MTS. The ARP component does not support the Reverse ARP (RARP) feature, but it does support features such as proxy ARP, local proxy ARP, and sticky ARP.
Note
If the router receives packets destined to another host in the same subnet and local proxy ARP is enabled on the interface, the router does not send the ICMP redirect messages. Local proxy ARP is disabled by default.
If the Sticky ARP option is set on an interface, any new ARP entries that are learned are marked so that they are not overwritten by a new adjacency (for example, gratuitous ARP). These entries also do not get aged out. This feature helps prevent a malicious user from spoofing an ARP entry.
Glean adjacencies can cause packet loss and also cause excessive packets to get punted to CPU. Understanding the treatment of packets when a glean adjacency is seen is vital. Let’s assume that a switch receives IP packets where the next hop is a connected network. If an ARP entry exists but no host route (/32 route) is installed in the FIB or in the AM shared database, the FIB lookup points to glean adjacency. The glean adjacency packets are rate-limited. If no network match is found in FIB, packets are silently dropped in hardware (known as a FIB miss).
To protect the CPU from high bandwidth flows with no ARP entries or adjacencies programmed in hardware, NX-OS provides rate-limiters for glean adjacency traffic on Nexus 7000 and 9000 platforms. The configuration for the preset hardware rate-limiters for glean adjacency traffic is viewed using the command show run all | include glean. Example 3-43 displays the hardware rate-limiters for glean traffic.
Example 3-43 Hardware Rate-Limiters for Glean Traffic
hardware rate-limiter layer-3 glean 100
hardware rate-limiter layer-3 glean-fast 100
hardware rate-limiter layer-3 glean 100 module 3
hardware rate-limiter layer-3 glean-fast 100 module 3
hardware rate-limiter layer-3 glean 100 module 4
hardware rate-limiter layer-3 glean-fast 100 module 4
The control plane installs a temporary adjacency drop entry in hardware while ARP is being resolved. All subsequent packets are dropped in hardware until ARP is resolved. The temporary adjacency remains until the glean timer expires. When the timer expires, the normal process of punt/drop starts again.
The ARP entries on the NX-OS are viewed using the command show ip arp [interface-type interface-num]. The command output shows not only the learned ARP entries but also the glean entries, which are marked as incomplete. Example 3-44 displays the ARP table for VLAN 10 SVI interface with both learned ARP entry and INCOMPLETE entry.
Flags: * - Adjacencies learnt on non-active FHRP router
+ - Adjacencies synced via CFSoE
# - Adjacencies Throttled for Glean
D - Static Adjacencies attached to down interface
IP ARP Table
Total number of entries: 2
Address Age MAC Address Interface
10.1.12.10 00:10:20 5087.894b.bb41 Vlan10
10.1.12.2 00:00:09 INCOMPLETE Vlan10
When an incomplete ARP is seen, the internal trace history is used to determine whether the problem is with the ARP component or something else. When an ARP entry is populated, two operations (Create and Update) occur to populate the information in the FIB. If a problem arises with the ARP component, you might only see the Create operation, not the Update operation. To view the sequence of operations, use the command show forwarding internal trace v4-adj-history [module slot] (see Example 3-45). This example shows that for the next hop of 10.1.12.2, only a Create operation is happening after the Destroy operation (drop adjacency); no Update operation occurs after that, causing the ARP entry to be marked as glean.
Example 3-45 Adjacency Internal Forwarding Trace
HH 0x80000018
Time if NH operation
Sun May 7 06:43:10 2017 Vlan10 10.1.12.10 Create
Sun May 7 06:43:10 2017 Vlan10 10.1.12.10 Update
Sun May 7 06:43:10 2017 Vlan10 10.1.12.2 Update
Sun May 7 06:53:54 2017 Vlan10 10.1.12.2 Destroy
Sun May 7 06:56:03 2017 Vlan10 10.1.12.2 Create
To view the forwarding adjacency, use the command show forwarding ipv4 adjacency interface-type interface-num [module slot]. If the adjacency for a particular next hop appears as unresolved, there is no adjacency; FIB then matches the network glean adjacency and performs a punt operation. Example 3-46 illustrates the output of the show forwarding ipv4 adjacency command with an unresolved adjacency entry.
Example 3-46 Verifying Forwarding Adjacency
IPv4 adjacency information
next-hop rewrite info interface
-------------- --------------- -------------
10.1.12.10 5087.894b.bb41 Vlan10
10.1.12.2 unresolved Vlan10
The ARP component also provides an event history to be used to further understand whether any errors could lead to problems with ARP and adjacency. To view the ARP event history, use the command show ip arp internal event-history [events | errors]. Example 3-47 displays the output of the command show ip arp internal event-history events, displaying the ARP resolution for the host 10.1.12.2/24. In the event history, notice that the switch sends out an ARP request; based on the reply, the adjacency is built and further updated into the AM database.
Example 3-47 ARP Event History
1) Event:E_DEBUG, length:144, at 720940 usecs after Sun May 7 17:31:30 2017
[116] [4196]: Adj info: iod: 181, phy-iod: 36, ip: 10.1.12.2, mac: fa16.3e29
.5f82, type: 0, sync: FALSE, suppress-mode: ARP Suppression Disabled
2) Event:E_DEBUG, length:198, at 720916 usecs after Sun May 7 17:31:30 2017
[116] [4196]: Entry added to ARP pt, added to AM for 10.1.12.2, fa16.3e29.5f
82, state 2 on interface Vlan10, physical interface Ethernet2/1, ismct 0. Rearp
(interval: 0, count: 0), TTL: 1500 seconds
3) Event:E_DEBUG, length:86, at 718187 usecs after Sun May 7 17:31:30 2017
[116] [4196]: arp_add_adj: Updating MAC on interface Vlan10, phy-interface
Ethernet2/1
4) Event:E_DEBUG, length:145, at 713312 usecs after Sun May 7 17:31:30 2017
[116] [4200]: Adj info: iod: 181, phy-iod: 181, ip: 10.1.12.2, mac: 0000.000
0.0000, type: 0, sync: FALSE, suppress-mode: ARP Suppression Disabled
5) Event:E_DEBUG, length:181, at 713280 usecs after Sun May 7 17:31:30 2017
[116] [4200]: Entry added to ARP pt, added to AM for 10.1.12.2, NULL, state
1 on interface Vlan10, physical interface Vlan10, ismct 0. Rearp (interval: 2,
count: 4), TTL: 30 seconds
6) Event:E_DEBUG, length:40, at 713195 usecs after Sun May 7 17:31:30 2017
[116] [4200]: Parameters l2_addr is null
7) Event:E_DEBUG, length:40, at 713154 usecs after Sun May 7 17:31:30 2017
[116] [4200]: Parameters l2_addr is null
8) Event:E_DEBUG, length:59, at 713141 usecs after Sun May 7 17:31:30 2017
[116] [4200]: Create adjacency, interface Vlan10, 10.1.12.2
9) Event:E_DEBUG, length:81, at 713074 usecs after Sun May 7 17:31:30 2017
[116] [4200]: arp_add_adj: Updating MAC on interface Vlan10, phy-interface
Vlan10
10) Event:E_DEBUG, length:49, at 713054 usecs after Sun May 7 17:31:30 2017
[116] [4200]: ARP request for 10.1.12.2 on Vlan10
Note
The ARP packets are also captured using Ethanalyzer in both ingress and egress directions.
The ARP component is closely coupled with the Adjacency Manager (AM) component. The AM takes care of programming the /32 host routes in the hardware. AM provides the following functionalities:
Exports Layer 3 to Layer 2 adjacencies through shared memory
Generates adjacency change notification, including interface deletion notification, and sends updates via MTS
Adds host routes (/32 routes) into URIB/U6RIB for learned adjacencies
Performs IP/IPv6 lookup AM database while forwarding packets out of the interface
Handles adjacencies restart by maintaining the adjacency SDB for restoration of the AM state
Provides a single interface for URIB/UFDM to learn routes from multiple sources
When an ARP is learned, the ARP entry is added to the AM SDB. AM then communicates directly with URIB and UFDM to install a /32 adjacency in hardware. The AM database queries the state of active ARP entries. The ARP table is not persistent upon process restart and thus must requery the AM SDB. AM registers various clients that can install adjacencies. To view the registered clients, use the command show system internal adjmgr client (see Example 3-48). One of the most common clients of AM is ARP.
Example 3-48 Adjacency Manager Clients
Protocol Name Alias UUID
netstack Static 545
rpm rpm 305
IPv4 Static 268
icmpv6 icmpv6 270
Any unresolved adjacency is verified using the command show ip adjacency ip-address detail. If the adjacency is resolved, the output populates the correct MAC address for the specified IP; otherwise, it has 0000.0000.0000 in the MAC address field. Example 3-49 displays the difference between the resolved and unresolved adjacencies.
Example 3-49 Resolved and Unresolved Adjacencies
No. of Adjacency hit with type INVALID: Packet count 0, Byte count 0
No. of Adjacency hit with type GLOBAL DROP: Packet count 0, Byte count 0
No. of Adjacency hit with type GLOBAL PUNT: Packet count 0, Byte count 0
No. of Adjacency hit with type GLOBAL GLEAN: Packet count 0, Byte count 0
No. of Adjacency hit with type GLEAN: Packet count 0, Byte count 0
No. of Adjacency hit with type NORMAL: Packet count 0, Byte count 0
Adjacency statistics last updated before: never
IP Adjacency Table for VRF default
Total number of entries: 1
Address : 10.1.12.10
MacAddr : 5087.894b.bb41
Preference : 50
Source : arp
Interface : Vlan10
Physical Interface : Ethernet2/1
Packet Count : 0
Byte Count : 0
Best : Yes
Throttled : No
Adjacency statistics last updated before: never
IP Adjacency Table for VRF default
Total number of entries: 1
Address : 10.1.12.10
MacAddr : 5087.894b.bb41
Preference : 50
Source : arp
Interface : Vlan10
Physical Interface : Ethernet2/1
Packet Count : 0
Byte Count : 0
Best : Yes
Throttled : No
Adjacency statistics last updated before: never
IP Adjacency Table for VRF default
Total number of entries: 1
Address : 10.1.12.2
MacAddr : 0000.0000.0000
Preference : 255
Source : arp
Interface : Vlan10
Physical Interface : Vlan10
Packet Count : 0
Byte Count : 0
Best : Yes
Throttled : No
The AM adjacency installation into URIB follows these steps:
Step 1. The AM queues an Add adjacency request.
Step 2. The AM calls URIB to install the route.
Step 3. The AM appends new adjacency to the Add list.
Step 4. URIB adds the route.
Step 5. The AM independently calls the UFDM API to install the adjacency in the hardware.
The series of events within the AM component is viewed using the command show system internal adjmgr internal event-history events. Example 3-50 displays the output of this command, to illustrate the series of events that occur during installation of the adjacency for host 10.1.12.2. Notice that the prefix 10.1.12.2 is being added to the RIB buffer for the IPv4 address family.
Example 3-50 Hardware Rate-Limiters for Glean Traffic
1) Event:E_DEBUG, length:101, at 865034 usecs after Tue May 9 05:21:19 2017
[117] [4017]: Appending ADD 10.1.12.2 on Vlan10 (TBL:1) AD 250 to rib buffer
2) Event:E_DEBUG, length:84, at 845226 usecs after Tue May 9 05:21:19 2017
[117] [4043]: Add 10.1.12.2 on Vlan10 to rib work queue for afi: IPv4with wo
[117] [4043]: is_mct 0, entry_exists 1, iod 0x85 phy_iod 0x85
4) Event:E_DEBUG, length:61, at 840347 usecs after Tue May 9 05:21:19 2017
[117] [4043]: is_mct 0, entry_exists 0, iod 0x85 phy_iod 0x85
Adjacency related errors could be verified using the event-history logs as well by using the command show system internal adjmgr internal event-history errors.
Note
If an issue arises with any ARP or AM component, capture the show tech arp and show tech adjmgr outputs during problematic state.
Unicast Forwarding Components
The IP/IPv6 packet-forwarding decisions on a device are made by the Routing Information Base (RIB) and the Forwarding Information Base (FIB). In NX-OS, the RIB is managed by the Unicast Routing Information Base (URIB), and the FIB is managed by the IP Forwarding Information Base (IPFIB) component. URIB is the software perspective of the routing information on the supervisor, whereas the IPFIB is the software perspective of the routing information on the line card. This section discusses these components that manage the forwarding on NX-OS platforms.
Unicast Routing Information Base
The URIB component in NX-OS is responsible for maintaining SDB for all Layer 3 unicast routes installed by all the routing protocols. The URIB is a VDC local process—that is, routes cannot be shared across multiple VDCs unless a routing adjacency exists between them. The URIB process uses several clients, which are also viewed using the command show routing clients (see Example 3-51):
Routing protocols—Enhanced Interior Gateway Routing Protocol (EIGRP), Open Shortest Path First (OSPF), Border Gateway Protocol (BGP), and so on
Netstack (updates URIB for static routes)
AM
RPM
epid: 4059 MTS SAP: 266 MRU cache hits/misses: 1/1
Stale Time: 30
Routing Instances:
VRF: "default" routes: 0, rnhs: 0, labels: 0
Messages received:
Register : 1 Convergence-all-nfy: 1
Messages sent:
epid: 23091 MTS SAP: 320 MRU cache hits/misses: 2/1
Stale Time: 2100
Routing Instances:
VRF: "default" routes: 1, rnhs: 0, labels: 0
Messages received:
Register : 1 Convergence-notify: 1 Modify-route : 1
Messages sent:
Modify-route-ack : 1
Each routing protocol has its own region of shared URIB memory space. When a routing protocol learns routes from its neighbor, it installs those learned routes in its own region of shared URIB memory space. URIB then copies updated routes to its own protected region of shared memory, which is read-only memory and is readable only to Netstack and other components. The routing decisions are made from the entry present in URIB shared memory. It is vital to note that URIB itself does not perform any of the add, modify, or delete operations in the routing table. URIB clients (the routing protocols and Netstack) handle all updates, except when the URIB client process crashes. In such a case, URIB might then delete abandoned routes.
OSPF CLI provides users with the command show ip ospf internal txlist urib to view the OSPF routes sent to URIB. For all other routing protocols, the information is viewed using event history commands. Example 3-52 displays the output, showing the source SAP ID of OSPF process and the destination SAP ID for MTS messages.
Example 3-52 OSPF Route Distribution to URIB
ospf 100 VRF default
ospf process tag 100
ospf process instance number 1
ospf process uuid 1090519321
ospf process linux pid 23091
ospf process state running
System uptime 4d04h
SUP uptime 2 4d04h
Server up : L3VM|IFMGR|RPM|AM|CLIS|URIB|U6RIB|IP|IPv6|SNMP
Server required : L3VM|IFMGR|RPM|AM|CLIS|URIB|IP|SNMP
Server registered: L3VM|IFMGR|RPM|AM|CLIS|URIB|IP|SNMP
Server optional : none
Early hello : OFF
Force write PSS: FALSE
OSPFv2->URIB transmit list: version 0xb
9: 10.1.12.0/24
10: 1.1.1.1/32
11: 2.2.2.2/32
11: RIB marker
N7k-1# show system internal mts sup sap 320 description
The routes being updated from an OSPF process or any other routing process to URIB are recorded in the event history logs. To view the updates copied by OSPF from OSPF process memory to URIB shared memory, use the command show ip ospf internal event-history rib. Use the command show routing internal event-history msgs to examine URIB updating the globally readable shared memory. Example 3-53 shows the learned OSPF routes being processed and updated to URIB and also the routing event history showing the routes being updated to shared memory.
Example 3-53 Routing Protocol and URIB Updates
OSPF RIB events for Process "ospf-100"
2017 May 14 03:12:14.711449 ospf 100 [23091]: : Done sending routes to URIB
2017 May 14 03:12:14.711447 ospf 100 [23091]: : Examined 3 OSPF routes
2017 May 14 03:12:14.710532 ospf 100 [23091]: : Route (mbest) does not have any
next-hop
2017 May 14 03:12:14.710531 ospf 100 [23091]: : Path type changed from nopath to
intra
2017 May 14 03:12:14.710530 ospf 100 [23091]: : Admin distance changed from 255
to 110
2017 May 14 03:12:14.710529 ospf 100 [23091]: : Mbest metric changed from 429496
7295 to 41
2017 May 14 03:12:14.710527 ospf 100 [23091]: : Processing route 2.2.2.2/32
(mbest)
2017 May 14 03:12:14.710525 ospf 100 [23091]: : Done processing next-hops for
2.2.2.2/32
2017 May 14 03:12:14.710522 ospf 100 [23091]: : Route 2.2.2.2/32 next-hop
intra
2017 May 14 03:12:14.710513 ospf 100 [23091]: : Admin distance changed from 255
to 110
2017 May 14 03:12:14.710511 ospf 100 [23091]: : Ubest metric changed from 429496
7295 to 41
2017 May 14 03:12:14.710509 ospf 100 [23091]: : Processing route 2.2.2.2/32 (ubest)
N7k-1# show routing internal event-history msgs
[NOT] Opc:MTS_OPC_URIB(52225), Id:0X0036283B, Ret:SUCCESS
Src:0x00000101/253, Dst:0x00000101/320, Flags:None
HA_SEQNO:0X00000000, RRtoken:0x00000000, Sync:NONE, Payloadsize:312
Payload:
0x0000: 04 00 1a 00 53 0f 00 00 53 0f 00 00 ba 49 07 00
7) Event:E_MTS_RX, length:60, at 710608 usecs after Sun May 14 03:12:14 2017
[NOT] Opc:MTS_OPC_URIB(52225), Id:0X00362839, Ret:SUCCESS
Src:0x00000101/320, Dst:0x00000101/253, Flags:None
HA_SEQNO:0X00000000, RRtoken:0x00000000, Sync:NONE, Payloadsize:276
Payload:
0x0000: 04 00 19 00 33 5a 00 00 33 5a 00 00 ba 49 07 00
N7k-1# show system internal mts sup sap 253 description
After the routes are installed in the URIB, they can be viewed using the command show ip route routing-process detail, where routing-process is the NX-OS process for the respective routing protocols, as in Example 3-53 (ospf-100).
Note
URIB stores all routing information in shared memory. Because the memory space is shared, it can be exhausted by large-scale routing issues or memory leak issues. Use the command show routing memory statistics to view the shared URIB memory space.
UFDM and IPFIB
After the URIB has been updated with the routes, update the FIB. This is where UFDM comes into picture. UFDM, a VDC local process, primarily takes care of reliably distributing the routes, adjacency information, and unicast reverse path forwarding (uRPF) information to all the line cards in the Nexus chassis where all the FIB is programmed. UFDM maintains prefix, adjacency, and equal cost multipath (ECMP) databases, which are then used for making forwarding decisions in the hardware. UFDM runs on the supervisor module and communicates with the IPFIB on each line card. The IPFIB process programs the forwarding engine (FE) and hardware adjacency on each line card.
The UFDM has four sets of APIs performing various tasks in the system:
FIB API: URIB and U6RIB modules use this to add, update, and delete routes in the FIB.
AdjMgr notification: The AM interacts directly with the UFDM AM API to install /32 host routes.
uRPF notification: The IP module sends a notification to enable or disable different RPF check modes per interface.
Statistics collection API: This is used to collect adjacency statistics from the platform.
In this list of tasks, the first three functions happen in a top-down manner (from supervisor to line card); the fourth function happens in a bottom-up direction (from line card to supervisor).
Note
NX-OS no longer has Cisco Express Forwarding (CEF). It now relies on hardware FIB, which is based on AVL Trees, a self-balancing binary search tree.
The UFDM component distributes AM, FIB, and RPF updates to IPFIB on each line card in the VDC and then sends an acknowledgment route-ack to URIB. This is verified using the command show system internal ufdm event-history debugs (see Example 3-54).
Example 3-54 UFDM Route Distribution to IPFIB and Acknowledgment
[104] ufdm_route_send_ack(185):TRACE: sent route nack, xid: 0x58f059ec,
v4_ack: 0, v4_nack: 24
808) Event:E_DEBUG, length:129, at 711230 usecs after Sun May 14 03:12:14 2017
[104] ufdm_route_distribute(615):TRACE: v4_rt_upd # 24 rt_count: 1, urib_xid
: 0x58f059ec, fib_xid: 0x58f059ec recp_cnt: 0 rmask: 0
809) Event:E_DEBUG, length:94, at 652231 usecs after Sun May 14 03:12:09 2017
[104] ufdm_route_send_ack(185):TRACE: sent route nack, xid: 0x58f059ec,
v4_ack: 0, v4_nack: 23
810) Event:E_DEBUG, length:129, at 651602 usecs after Sun May 14 03:12:09 2017
[104] ufdm_route_distribute(615):TRACE: v4_rt_upd # 23 rt_count: 1, urib_xid
: 0x58f059ec, fib_xid: 0x58f059ec recp_cnt: 0 rmask: 0
The platform-dependent FIB manages the hardware-specific structures, such as hardware table indexes and device instances. The NX-OS command show forwarding internal trace v4-pfx-history displays the create and destroy history for FIB route data. Example 3-55 displays the forwarding IPv4 prefix history for prefix 2.2.2.2/32, which is learned through OSPF. The history displays the Create, Destroy, and then another Create operation for the prefix, along with the time stamp, which is useful while troubleshooting forwarding issues that arise from a route not being installed in the hardware FIB.
Example 3-55 Historical Information of FIB Route
PREFIX 1.1.1.1/32 TABLE_ID 0x1
Time ha_handle next_obj next_obj_HH NH_cnt operation
Sun May 14 16:42:47 2017 0x23d6b V4 adj 0xb 1 Create
Sun May 14 16:42:47 2017 0x23d6b V4 adj 0xb 1 Update
PREFIX 10.1.12.1/32 TABLE_ID 0x1
Time ha_handle next_obj next_obj_HH NH_cnt operation
Sun May 14 16:42:39 2017 0x21d24 V4 adj 0xb 1 Create
PREFIX 2.2.2.2/32 TABLE_ID 0x1
Time ha_handle next_obj next_obj_HH NH_cnt operation
PREFIX 10.1.12.2/32 TABLE_ID 0x1
Time ha_handle next_obj next_obj_HH NH_cnt operation
Sun May 14 16:43:58 2017 0x21601 V4 adj 0x10000 1 Create
After the hardware FIB has been programmed, the forwarding information is verified using the command show forwarding route ip-address/len [detail]. The command output displays the information of the next hop to reach the destination prefix and the outgoing interface, as well as the destination MAC information. This information is also verified at the platform level to get more details on it from the hardware/platform perspective using the command show forwarding ipv4 route ip-address/len platform [module slot].
Then the information must be propagated in the relevant line card. This is verified using the command show system internal forwarding route ip-address/len [detail]. This command output also provides interface hardware adjacency information; this is further verified using the command show system internal forwarding adjacency entry adj, where the adj value is the adjacency value received from the previous command.
Note
Note that the previous outputs can be collected on the supervisor card as well as at the line card level by logging into the line card console using the command attach module slot and then executing the forwarding commands as already described.
Example 3-56 displays step-by-step verification of the route programmed in the FIB and on the line card level.
Example 3-56 Platform FIB Verification
slot 3
=======
Prefix 2.2.2.2/32, No of paths: 1, Update time: Sun May 14 21:29:43 2017
10.1.12.2 Vlan10 DMAC: 5087.894b.c0c2
packets: 0 bytes: 0
N7k-1# show forwarding ipv4 route 2.2.2.2/32 platform module 3
Prefix 2.2.2.2/32, No of paths: 1, Update time: Sun May 14 21:16:20 2017
10.1.12.2 Vlan10 DMAC: 5087.894b.c0c2
packets: 0 bytes: 0
HH:0x80000026 Flags:0x0 Holder:0x1 Next_obj_type:5
Inst : 0 1 2 3 4 5 6 7 8 9 10 11
Hw_idx: 6320 N/A N/A N/A N/A N/A
N7k-1# show system internal forwarding route 2.2.2.2/32
slot 3
=======
Routes for table default/base
----+---------------------+----------+----------+-----------
Dev | Prefix | PfxIndex | AdjIndex | LIF
----+---------------------+----------+----------+-----------
0 2.2.2.2/32 0x6320 0x5f 0x3
N7k-1# show system internal forwarding route 2.2.2.2/32 detail
slot 3
=======
RPF Flags legend:
S - Directly attached route (S_Star)
V - RPF valid
M - SMAC IP check enabled
G - SGT valid
E - RPF External table valid
2.2.2.2/32 , Vlan10
Dev: 0 , Idx: 0x6320 , Prio: 0x8507 , RPF Flags: V , DGT: 0 , VPN: 9
RPF_Intf_5: Vlan10 (0x3 )
AdjIdx: 0x5f , LIFB: 0 , LIF: Vlan10 (0x3 ), DI: 0x0
DMAC: 5087.894b.c0c2 SMAC: 5087.894b.c0c5
N7k-1# show system internal forwarding adjacency entry 0x5f
slot 3
=======
Device: 0 Index: 0x5f dmac: 5087.894b.c0c2 smac: 5087.894b.c0c5
e-lif: 0x3 packets: 0 bytes: 0
Note
In case of any forwarding issues, collect the following show tech outputs during problematic state:
show tech routing ip unicast
show tech-support forwarding l3 unicast [module slot]
show tech-support detail
EthPM and Port-Client
NX-OS provides a VDC local process named Ethernet Port Manager (EthPM) to manage all the Ethernet interfaces on the Nexus platforms, including physical as well as logical interfaces (only server interfaces, not SVIs), in-band interfaces, and management interfaces. The EthPM component performs two primary functions:
Abstraction: Provides an abstraction layer for other components that want to interact with the interfaces that EthPM manages
Port Finite State Machine (FSM): Provides an FSM for interfaces that it manages, as well as handling interface creation and removal
The EthPM component interacts with other components, such as the Port-Channel Manager, VxLAN Manager, and STP, to program interface states. The EthPM process is also responsible for managing interface configuration (duplex, speed, MTU, allowed VLANs, and so on).
Port-Client is a line card global process (specific to Nexus 7000 and Nexus 9000 switches) that closely interacts with the EthPM process. It maintains global information received from EthPM across different VDCs. It receives updates from the local hardware port ASIC and updates the EthPM. It has both platform-independent (PI) and platform-dependent (PD) components. The PI component of the Port-Client process interacts with EthPM, which is also a PI component, and the PD component is used for line card-specific hardware programming.
The EthPM component CLI enables you to view platform-level information, such as the EthPM interface index, which it receives from the Interface Manager (IM) component; interface admin state and operational state; interface capabilities; interface VLAN state; and more. All this information is viewed using the command show system internal ethpm info interface interface-type interface-num. Example 3-57 displays the EthPM information for the interface Ethernet 3/1, which is configured as an access port for VLAN 10.
Example 3-57 Platform FIB Verification
Router MAC address: 50:87:89:4b:c0:c5
layer(L2), dce-mode(edge), description(),
auto neg(on), auto mdix(on), beacon(off), num_of_si(0)
medium(broadcast), snmp trap(on), MTU(1500),
flowcontrol rx(off) tx(off), link debounce(100),
storm-control bcast:100.00% mcast:100.00% ucast:100.00%
span mode(0 - not a span-destination)
delay(1), bw(10000000), rate-mode(dedicated)
eee(n/a), eee_lpi(Normal), eee_latency(Constant)
fabricpath enforce (DCE Core)(0)
load interval [1-3]: 30, 300, 0 (sec).
lacp mode(on)
graceful convergence state(enabled)
Ethertype 0x8100
Slowdrain Congestion : mode core timeout[500], mode edge [500]
Slowdrain Pause : mode core enabled [y] timeout[500]
Slowdrain Pause : mode edge enabled [y] timeout[500]
Slowdrain Slow-speed : mode core enabled [n] percent[10]
Slowdrain Slow-speed : mode edge enabled [n] percent[10]
Monitor fp header(included)
shut lan (disabled)
Tag Native Mode (disabled)
state reason(None), error(no error)
dce-mode(edge), intf_type(0), parent_info(0-1-5)
port-flags-bitmask(0x0) reset_cntr(4)
last intf reset time is 0 usecs after Thu Jan 1 00:00:00 1970
secs flowcontrol rx(off) tx(off), vrf(disabled)
mdix mode(mdix), primary vlan(10), cfg_acc_vlan(10)
access vlan(10), cfg_native vlan(1), native vlan(1)
eee(n/a), eee_wake_time_tx(0), eee_wake_time_rx(0)
bundle_bringup_id(5)
service_xconnect(0)
current state [ETH_PORT_FSM_ST_L2_UP]
xfp(inserted), status(ok) Extended info (present and valid)
Operational (Runtime) ETHPM_LIM Cache Information:
Num of EFP(0), EFP port mode (0x100000), EFP rewrite(0),
PORT_CMD_ENCAP(9), PORT_CMD_PORT_MODE(0),
PORT_CMD_SET_BPDU_MATCH(2)
port_mem_of_es_and_lacp_suspend_disable(0)
MTS Node Identifier: 0x302
Platform Information:
Local IOD(0xd7), Global IOD(0) Runtime IOD(0xd7)
udld(0x1), SFPCapable(0x1), TrunkEncap(0x1), AutoNeg(0x1)
channel(0x1), suppression(0x1), cos_rewrite(0x1), tos_rewrite(0x1)
dce capable(0x4), l2 capable(0x1), l3 capable(0x2) qinq capable(0x10)
ethertype capable(0x1000000), Fabric capable (y), EFP capable (n)
slowdrain congestion capable(y), slowdrain pause capable (y)
slowdrain slow-speed capable(y)
Num rewrites allowed(104)
eee capable speeds () and eee flap flags (0)
eee max wk_time rx(0) tx(0) fb(0)
Information from GLDB Query:
Platform Information:
Backplane MAC address in GLDB: 38:ed:18:a2:17:84
Router MAC address in GLDB: 50:87:89:4b:c0:c5
Operational Bits: 3-4,13,53
is_link_up(1), pre_cfg_done(1), l3_to_l2(1), pre_cfg_ph1_done(1),
Keep-Port-Down Type:0 Opc:0 RRToken:0X00000000, gwrap:(nil)
Multiple Reinit: 0 Reinit when shut: 0
Last SetTs: 487184 usecs after Sun May 14 18:54:29 2017
Last ResetTs: 717229 usecs after Sun May 14 18:54:30 2017
DCX LAN LLS enabled: FALSE
MCEC LLS down: FALSE
Breakout mapid 0
User config flags: 0x3
admin_state(1), admin_layer(1), admin_router_mac(0) admin_monitor_fp_header(0)
Lock Info: resource [Ethernet3/1]
type[0] p_gwrap[(nil)]
FREE @ 528277 usecs after Sun May 14 21:29:05 2017
type[1] p_gwrap[(nil)]
FREE @ 528406 usecs after Sun May 14 21:29:05 2017
type[2] p_gwrap[(nil)]
FREE @ 381980 usecs after Sun May 14 18:54:28 2017
0x1a100000
Pacer Information:
Pacer State: released credits
ISSU Pacer State: initialized
Data structure info:
Context: 0xa2f1108
Pacer credit granted after: 4294967295 sec 49227 usecs
Pacer credit held for: 1 sec 4294935903 usecs
The port-client command show system internal port-client link-event tracks interface link events from the software perspective on the line card. This command is a line card-level command that requires you to get into the line card console. Example 3-58 displays the port-client link events for ports on module 3. In this output, the events at different time stamps are seen for various links going down and coming back up.
Example 3-58 Port-Client Link Events
Attaching to module 3 ...
To exit type 'exit', to abort type '$.'
module-3# show system internal port-client link-event
*************** Port Client Link Events Log ***************
---- ------ ----- ----- ------
Time PortNo Speed Event Stsinfo
---- ------ ----- ----- ------
May 15 05:47:35 2017 00550650 Ethernet3/11 ---- DOWN SUCCESS(0x0)
May 15 05:47:35 2017 00454119 Ethernet3/11 ---- DOWN Link down debounce
timer started(0x40e50006)
For these link events, relevant messages are seen in the port-client event history logs for the specified port using the line card-level command show system internal port-client event-history port port-num.
Note
If issues arise with ports not coming up on the Nexus chassis, collect the output of the command show tech ethpm during problematic state.
HWRL, CoPP, and System QoS
Denial of service (DoS) attacks take many forms and affect both servers and infrastructure in any network environment, especially in data centers. Attacks targeted at infrastructure devices generate IP traffic streams at very high data rates. These IP data streams contain packets that are destined for processing by the control plane of the route processor (RP). Based on the high rate of rogue packets presented to the RP, the control plane is forced to spend an inordinate amount of time processing this DoS traffic. This scenario usually results in one of the following issues:
Loss of line protocol keepalives, which cause a line to go down and lead to route flaps and major network transitions.
Excessive packet processing because packets are being punted to the CPU.
Loss of routing protocol updates, which leads to route flaps and major network transitions.
Unstable Layer 2 network
Near 100% CPU utilization that locks up the router and prevents it from completing high-priority processing (resulting in other negative side effects).
RP at near 100% utilization, which slows the response time at the user command line (CLI) or locks out the CLI. This prevents the user from taking corrective action to respond to the attack.
Consumption of resources such as memory, buffers, and data structures, causing negative side effects.
Backup of packet queues, leading to indiscriminate drops of important packets.
Router crashes
To overcome the challenges of DoS/DDoS attacks and excessive packet processing, NX-OS gives users two-stage policing:
Rate-limiting packets in hardware on a per-module basis before sending the packets to the CPU
Policy-based traffic policing using control plane policing (CoPP) for traffic that has passed rate-limiters
The hardware rate-limiters and CoPP policy together increase device security by protecting its CPU (Route-Processor) from unnecessary traffic or DoS attacks and gives priority to relevant traffic destined for the CPU. Note that the hardware rate limiters are available only with Nexus 7000 and Nexus 9000 series switches and are not available on other Nexus platforms.
Packets that hit the CPU or reach the control plane are classified into these categories:
Received packets: These packets are destined for the router (such as keepalive messages)
Multicast packets: These packets are further divided into three categories:
Directly connected sources
Multicast control packets
Copy packets: For supporting features such as ACL-log, a copy of the original packet is made and sent to the supervisor. Thus, these are called copy packets.
ACL-log copy
FIB unicast copy
Multicast copy
NetFlow copy
Exception packets: These packets need special handling. Hardware is unable to process them or detects an exception, so they are sent to the supervisor for further processing. Such packets fall under the exception category. Some of the following exceptions fall under this category of packets:
Same interface check
TTL expiry
MTU failure
Dynamic Host Control Protocol (DHCP) ACL redirect
ARP ACL redirect
Source MAC IP check failure
Unsupported rewrite
Stale adjacency error
Glean packets: When an L2 MAC for the destination IP or next hop is not present in the FIB, the packet is sent to the supervisor. The supervisor then takes care of generating an ARP request for the destination host or next hop.
Broadcast, non-IP packets: The following packets fall under this category:
Broadcast MAC + non-IP packet
Broadcast MAC + IP unicast
Multicast MAC + IP unicast
Remember that both the CoPP policy and rate-limiters are applied on per-module, per-forwarding engine (FE) basis.
Note
On the Nexus 7000 platform, CoPP policy is supported on all line cards except F1 series cards. F1 series cards exclusively use rate-limiters to protect the CPU. HWRL is supported on Nexus 7000/7700 and Nexus 9000 series platforms.
Example 3-59 displays the output of the command show hardware rate-limiters [module slot] to view the rate-limiter configuration and statistics per each line card module present in the chassis.
Example 3-59 Verifying Hardware Rate-Limiters on N7k and N9k Switches
Units for Config: packets per second
Allowed, Dropped & Total: aggregated since last clear counters
rl-1: STP and Fabricpath-ISIS
rl-2: L3-ISIS and OTV-ISIS
rl-3: UDLD, LACP, CDP and LLDP
rl-4: Q-in-Q and ARP request
rl-5: IGMP, NTP, DHCP-Snoop, Port-Security, Mgmt and Copy traffic
Module: 3
Rate-limiter PG Multiplier: 1.00
R-L Class Config Allowed Dropped Total
+------------------+--------+---------------+---------------+-----------------+
L3 mtu 500 0 0 0
L3 ttl 500 0 0 0
L3 control 10000 0 0 0
L3 glean 100 0 0 0
L3 mcast dirconn 3000 1 0 1
L3 mcast loc-grp 3000 0 0 0
L3 mcast rpf-leak 500 0 0 0
L2 storm-ctrl Disable
access-list-log 100 0 0 0
copy 30000 54649 0 54649
receive 30000 292600 0 292600
L2 port-sec 500 0 0 0
L2 mcast-snoop 10000 2242 0 2242
L2 vpc-low 4000 0 0 0
L2 l2pt 500 0 0 0
L2 vpc-peer-gw 5000 0 0 0
L2 lisp-map-cache 5000 0 0 0
L2 dpss 100 0 0 0
L3 glean-fast 100 0 0 0
L2 otv 100 0 0 0
L2 netflow 500 0 0 0
Port group with configuration same as default configuration
Eth3/1-32
N9K-1# show hardware rate-limiter module 2
Units for Config: packets per second
Allowed, Dropped & Total: aggregated since last clear counters
Module: 2
R-L Class Config Allowed Dropped Total
+------------------+--------+---------------+---------------+-----------------+
L3 glean 100 0 0 0
L3 mcast loc-grp 3000 0 0 0
access-list-log 100 0 0 0
bfd 10000 0 0 0
exception 50 0 0 0
fex 3000 0 0 0
span 50 0 0 0
dpss 6400 0 0 0
sflow 40000 0 0 0
For verifying the rate-limiter statistics on F1 module on Nexus 7000 switches, use the command show hardware rate-limiter [f1 rl-1 | rl-2 | rl-3 | rl-4 | rl-5].
The Nexus 7000 series switches also enable you to view the rate-limiters for the SUP bound traffic and its usage. Different modules determine what exceptions match each rate-limiter. These differences are viewed using the command show hardware internal forwarding rate-limiter usage [module slot]. Example 3-60 displays the output of this command, showing not only the different rate-limiters but also which packet streams or rate-limiters are handled by either CoPP or the L2 or L3 rate-limiters.
Example 3-60 Rate-Limiter Usage
Note: The rate-limiter names have been abbreviated to fit the display.
-------------------------+------+------+--------+------+--------+--------
Packet streams | CAP1 | CAP2 | DI | CoPP | L3 RL | L2 RL
-------------------------+------+------+--------+------+--------+--------
L3 control (224.0.0.0/24) Yes x sup-hi x control copy
L2 broadcast x x flood x x strm-ctl
ARP request Yes x sup-lo Yes x copy
Mcast direct-con Yes x x Yes m-dircon copy
ISIS Yes x sup-lo x x x
L2 non-IP multicast x x x x x x
Access-list log x Yes acl-log x x acl-log
L3 unicast control x x sup-hi Yes x receive
L2 control x x x x x x
Glean x x sup-lo x x glean
Port-security x x port-sec x x port-sec
IGMP-Snoop x x m-snoop x x m-snoop
-------------------------+------+------+--------+------+--------+--------
Exceptions | CAP1 | CAP2 | DI | CoPP | L3 RL | L2 RL
-------------------------+------+------+--------+------+--------+--------
IPv4 header options 0 0 x Yes x
FIB TCAM no route 0 0 x Yes x
Same interface check 0 0 x x ttl x
IPv6 scope check fail 0 0 drop x x
Unicast RPF more fail 0 0 drop x x
Unicast RPF fail 0 0 drop Yes x
Multicast RPF fail 0 0 drop x x
Multicast DF fail 0 0 drop x x
TTL expiry 0 0 x x ttl x
Drop 0 0 drop x x
L3 ACL deny 0 0 drop x x
L2 ACL deny 0 0 drop x x
IPv6 header options 0 0 drop Yes x
MTU fail 0 0 x x mtu x
DHCP ACL redirect 0 0 x Yes mtu x
ARP ACL redirect 0 0 x Yes mtu x
Smac IP check fail 0 0 x x mtu x
Hardware drop 0 0 drop x x
Software drop 0 0 drop x x
Unsupported RW 0 0 x x ttl x
Invalid packet 0 0 drop x x
L3 proto filter fail 0 0 drop x x
Netflow error 0 0 drop x x
Stale adjacency error 0 0 x x ttl x
Result-bus drop 0 0 drop x x
Policer drop 0 0 x x x
Information about specific exceptions is seen using the command show hardware internal forwarding l3 asic exceptions exception detail [module slot].
The configuration settings for both l2 and l3 ASIC rate-limiters are viewed using the command show hardware internal forwarding [l2 | l3] asic rate-limiter rl-name detail [module slot], where the rl-name variable is the name of the rate-limiter. Example 3-61 displays the output for L3 ASIC exceptions, as well as the L2 and L3 rate-limiters. The first output shows the configuration and statistics for packets that fail the RPF check. The second and third outputs show the rate-limiter and exception configuration for packets that fail the MTU check.
Example 3-61 L2 and L3 Rate-Limiter and Exception Configuration
Device: 1
Device: 1
Enabled: 0
Packets/sec: 0
Match fields:
Cap1 bit: 0
Cap2 bit: 0
DI select: 0
DI: 0
Flood bit: 0
Replaced result fields:
Cap1 bit: 0
Cap2 bit: 0
DI: 0
slot 3
=======
Dev-id: 0
Rate-limiter configuration: layer-3 mtu
Enabled: 1
Packets/sec: 500
Packet burst: 325 [burst period of 1 msec]
slot 3
=======
Egress exception priority table programming:
Reserved: 0
Disable LIF stats: 0
Trigger: 0
Mask RP: 0x1
Dest info sel: 0
Clear exception flag: 0x1
Egress L3 : 0
Same IF copy disable: 0x1
Mcast copy disable: 0x1
Ucast copy disable: 0
Exception dest sel: 0x6
Enable copy mask: 0
Disable copy mask: 0x1
Unicast destination table programming:
Reserved: 0
L2 fwd: 0x1
Redirect: 0x1
Rate-limiter: 0x6
Flood: 0
Dest index: 0x10c7
CCC: 0
Multicast destination table programming:
Reserved: 0
L2 fwd: 0
Redirect: 0
Rate-limiter: 0
Flood: 0
Dest index: 0x285f
CCC: 0
CoPP in Nexus platforms is also implemented in hardware, which helps protects the supervisor from DoS attacks. It controls the rate at which the packets are allowed to reach the supervisor CPU. Remember that traffic hitting the CPU on the supervisor module comes in through four paths:
In-band interfaces for traffic sent by the line cards
Management interface
Control and monitoring processor (CMP) interface, which is used for the console
Ethernet Out of Band Channel (EOBC)
Only the traffic sent through the in-band interface is sent to the CoPP because this is the only traffic that reaches the supervisor module though different forwarding engines (FE) on the line cards. CoPP policing is implemented individually on each FE.
When any Nexus platform boots up, the NX-OS installs a default CoPP policy named copp-system-policy. NX-OS also comes with different profile settings for CoPP, to provide different protection levels to the system. These CoPP profiles include the following:
Strict: Defines a BC value of 250 ms for regular classes and 1000 ms for the important class.
Moderate: Defines a BC value of 310 ms for regular classes and 1250 ms for the important class.
Lenient: Defines a BC value of 375 ms for regular classes and 1500 ms for the important class.
Dense: Recommended when the chassis has more F2 line cards than other I/O modules. Introduced in release 6.0(1).
If one of the policies is not selected during initial setup, NX-OS attaches the Strict profile to the control plane. You can choose not to use one of these profiles and instead create a custom policy to be used for CoPP. The NX-OS default CoPP policy categorizes policy into various predefined classes:
Critical: Routing protocol packets with IP precedence value 6
Important: Redundancy protocols such as GLBP, VRRP, and HSRP
Management: All management traffic, such as Telnet, SSH, FTP, NTP, and Radius
Monitoring: Ping and traceroute traffic
Exception: ICMP unreachables and IP options
Undesirable: All unwanted traffic
Example 3-62 shows a sample strict CoPP policy when the system comes up for the first time. The CoPP configuration is viewed using the command show run copp all.
Example 3-62 CoPP Strict Policy on Nexus
match access-group name copp-system-p-acl-bgp
match access-group name copp-system-p-acl-rip
match access-group name copp-system-p-acl-vpc
match access-group name copp-system-p-acl-bgp6
match access-group name copp-system-p-acl-lisp
match access-group name copp-system-p-acl-ospf
match exception ip option
match exception ip icmp unreachable
match exception ipv6 option
match exception ipv6 icmp unreachable
class-map type control-plane match-any copp-system-p-class-important
match access-group name copp-system-p-acl-cts
match access-group name copp-system-p-acl-glbp
match access-group name copp-system-p-acl-hsrp
match access-group name copp-system-p-acl-vrrp
match access-group name copp-system-p-acl-wccp
match access-group name copp-system-p-acl-ftp
match access-group name copp-system-p-acl-ntp
match access-group name copp-system-p-acl-ssh
match access-group name copp-system-p-acl-ntp6
match access-group name copp-system-p-acl-sftp
match access-group name copp-system-p-acl-snmp
match access-group name copp-system-p-acl-ssh6
match access-group name copp-system-p-acl-icmp
match access-group name copp-system-p-acl-icmp6
match access-group name copp-system-p-acl-mpls-oam
match access-group name copp-system-p-acl-traceroute
match access-group name copp-system-p-acl-http-response
match access-group name copp-system-p-acl-mac-dot1x
match exception ip multicast directly-connected-sources
match exception ipv6 multicast directly-connected-sources
match protocol arp
class-map type control-plane match-any copp-system-p-class-undesirable
match access-group name copp-system-p-acl-undesirable
match exception fcoe-fib-miss
policy-map type control-plane copp-system-p-policy-strict
class copp-system-p-class-critical
set cos 7
police cir 36000 kbps bc 250 ms conform transmit violate drop
class copp-system-p-class-important
set cos 6
police cir 1400 kbps bc 1500 ms conform transmit violate drop
class copp-system-p-class-management
set cos 2
police cir 10000 kbps bc 250 ms conform transmit violate drop
class copp-system-p-class-normal
set cos 1
police cir 680 kbps bc 250 ms conform transmit violate drop
class copp-system-p-class-exception
set cos 1
police cir 360 kbps bc 250 ms conform transmit violate drop
class copp-system-p-class-monitoring
set cos 1
police cir 130 kbps bc 1000 ms conform transmit violate drop
class class-default
set cos 0
police cir 100 kbps bc 250 ms conform transmit violate drop
To view the differences in the different CoPP profiles, use the command show copp diff profile profile-type profile profile-type. The command displays the policy-map configuration differences of both specified profiles.
Note
Starting with NX-OS Release 6.2(2), the copp-system-p-class-multicast-router, copp-system-p-class-multicast-host, and copp-system-p-class-normal classes were added for multicast traffic. Before Release 6.2(2), this was achieved through custom user configuration.
Both HWRL and CoPP are done at the forwarding engine (FE) level. An aggregate amount of traffic from multiple FEs can still overwhelm the CPU. Thus, both the HWRL and CoPP are best-effort approaches. Another important point to keep in mind is that the CoPP policy should not be too aggressive; it also should be designed based on the network design and configuration. For example, if the rate at which routing protocol packets are hitting the CoPP policy is more than the policed rate, even the legitimate sessions can be dropped and protocol flaps can be seen. If the predefined CoPP policies must be modified, create a custom CoPP policy by copying a preclassified CoPP policy and then edit the new custom policy. None of the predefined CoPP profiles can be edited. Additionally, the CoPP policies are hidden from the show running-config output. The CoPP policies are viewed from the show running-config all or show running-config copp all commands. Example 3-63 shows how to use the CoPP policy configuration and create a custom strict policy.
Example 3-63 Viewing a CoPP Policy and Creating a Custom CoPP Policy
copp profile strict
R1# show running-config copp all
class-map type control-plane match-any copp-system-p-class-critical
match access-group name copp-system-p-acl-bgp
match access-group name copp-system-p-acl-rip
match access-group name copp-system-p-acl-vpc
match access-group name copp-system-p-acl-bgp6
R1# copp copy profile strict ?
prefix Prefix for the copied policy
suffix Suffix for the copied policy
R1# copp copy profile strict prefix custom
R1# configure terminal
R1(config)# control-plane
R1(config-cp)# service-policy input custom-copp-policy-strict
The command show policy-map interface control-plane displays the counters of the CoPP policy. For an aggregated view, use this command with the include “class|conform|violated” filter to see how many packets have been conformed and how many have been violated and dropped (see Example 3-64).
Example 3-64 show policy-map interface control-plane Output
class-map custom-copp-class-critical (match-any)
conformed 0 bytes; action: transmit
violated 0 bytes; action: drop
conformed 0 bytes; action: transmit
violated 0 bytes; action: drop
class-map custom-copp-class-important (match-any)
conformed 0 bytes; action: transmit
violated 0 bytes; action: drop
conformed 0 bytes; action: transmit
violated 0 bytes; action: drop
conformed 0 bytes; action: transmit
violated 0 bytes; action: drop
conformed 0 bytes; action: transmit
violated 0 bytes; action: drop
One problem that is faced with the access lists part of the CoPP policy is that the statistics per-entry command is not supported for IP and MAC access control lists (ACL); thus, it has no effect when applied under the ACLs. To view the CoPP policy–referenced IP and MAC ACL counters on an input/output (I/O) module, use the command show system internal access-list input entries detail. Example 3-65 displays the output of the command show system internal access-list input entries detail, showing the hits on the MAC ACL for the FabricPath MAC address 0180.c200.0041.
Example 3-65 IP and MAC ACL Counters in TCAM
[020c:4344:020a] qos 0000.0000.0000 0000.0000.0000 0180.c200.0041 ffff.ffff.ffff
[0]
[020c:4344:020a] qos 0000.0000.0000 0000.0000.0000 0180.c200.0041 ffff.ffff.ffff
[20034]
[020c:4344:020a] qos 0000.0000.0000 0000.0000.0000 0180.c200.0041 ffff.ffff.ffff
[19923]
[020c:4344:020a] qos 0000.0000.0000 0000.0000.0000 0180.c200.0041 ffff.ffff.ffff
[0]
Starting with NX-OS Release 5.1, the threshold value is configured to generate a syslog message for the drops enforced by the CoPP policy on a particular class. The syslog messages are generated when the drops within a traffic class exceed the user-configured threshold value. The threshold is configured using the logging drop threshold dropped-bytes-count [level logging-level] command. Example 3-66 demonstrates how to configure the logging threshold value to be set for 100 drops and logging at level 7. It also demonstrates how the syslog message is generated in case the drop threshold is exceeded.
Example 3-66 Drop Threshold for syslog Logging
R1(config-pmap)# class custom-copp-class-critical
R1(config-pmap-c)# logging drop threshold ?
<1-80000000000> Dropped byte count
R1(config-pmap-c)# logging drop threshold 100 ?
<CR>
level Syslog level
R1(config-pmap-c)# logging drop threshold 100 level ?
<1-7> Specify the logging level between 1-7
R1(config-pmap-c)# logging drop threshold 100 level 7
Scale factor configuration was introduced in NX-OS starting with Version 6.0. The scale factor is used to scale the policer rate of the applied CoPP policy on a per-line card basis without changing the actual CoPP policy configuration. The scale factor configuration ranges from 0.10 to 2.0. To configure the scale factor, use the command scale-factor value [module slot] under the control-plane configuration mode. Example 3-67 illustrates how to configure the scale factor for various line cards present in the Nexus chassis. The scale factor settings are viewed using the command show system internal copp info. This command displays other information as well, including the last operation that was performed and its status, CoPP database information, and CoPP runtime status, which is useful while troubleshooting issues with CoPP policies.
Example 3-67 Scale Factor Configuration
n7k-1(config-cp)# scale-factor 0.5 module 3
n7k-1(config-cp)# scale-factor 1.0 module 4
n7k-1# show system internal copp info
Active Session Details:
----------------------
There isn't any active session
Last operation status:
---------------------
Last operation: Show Command
Last operation details: show policy-map interface
Last operation Time stamp: 16:58:14 UTC May 14 2015
Operation Status: Success
--------------
Config FSM current state: IDLE
Modules online: 3 4 5 7
Linecard Configuration:
-----------------------
Scale Factors
Module 1: 1.00
Module 2: 1.00
Module 6: 1.00
Module 7: 1.00
Module 8: 1.00
Module 9: 1.00
Note
Refer to the CCO documentation for the appropriate scale factor recommendation for the appropriate Nexus 7000 chassis.
A few best practices need to be kept in mind for NX-OS CoPP policy configuration:
Use the strict CoPP profile.
Use the copp profile strict command after each NX-OS upgrade, or at least after each major NX-OS upgrade. If a CoPP policy modification was previously done, it must be reapplied after the upgrade.
The dense CoPP profile is recommended when the chassis is fully loaded with F2 series Modules or loaded with more F2 series modules than any other I/O modules.
Disabling CoPP is not recommended. Tune the default CoPP, as needed.
Monitor unintended drops, and add or modify the default CoPP policy in accordance with the expected traffic.
Because traffic patterns constantly change in a data center, customization of CoPP is a constant process.
MTU Settings
The MTU settings on a Nexus platform work differently than on other Cisco platforms. Two kinds of MTU settings exist: Layer 2 (L2) MTU and Layer 3 (L3) MTU. The L3 MTU is manually configured under the interface using the mtu value command. On the other hand, the L2 MTU is configured either through the network QoS policy or by setting the MTU on the interface itself on the Nexus switches that support per-port MTU. The L2 MTU settings are defined under the network-qos policy type, which is then applied under the system qos policy configuration. Example 3-68 displays the sample configuration to enable jumbo L2 MTU on the Nexus platforms.
Example 3-68 Jumbo MTU System Configuration
N7K-1(config-pmap-nqos)# class type network-qos class-default
N7K-1(config-pmap-nqos-c)# mtu 9216
N7K-1(config-pmap-nqos-c)# exit
N7K-1(config-pmap-nqos)# exit
N7K-1(config)# system qos
N7K-1(config-sys-qos)# service-policy type network-qos policy-MTU
Having the jumbo L2 MTU enabled before applying jumbo L3 MTU on the interface is recommended.
Note
Not all platforms support jumbo L2 MTU at the port level. The port-level L2 MTU configuration is supported only on the Nexus 7000, 7700, 9300, and 9500 platforms. All the other platforms (such as Nexus 3048, 3064, 3100, 3500, 5000, 5500, and 6000) support only network QoS policy-based jumbo L2 MTU settings.
The MTU settings on the Nexus 3000, 7000, 7700, and 9000 (platforms that support per-port MTU settings) can be viewed using the command show interface interface-type x/y. On the Nexus 3100, 3500, 5000, 5500, and 6000 (platforms supporting network QoS policy-based MTU settings), these are verified using the command show queuing interface interface-type x/y.
FEX Jumbo MTU Settings
The jumbo MTU on the Nexus 2000 FEXs is configured on the parent switch. If the parent switch supports setting the MTU on per-port basis, the MTU is configured on the FEX fabric port-channel interface. If the parent switch does not support per-port MTU settings, the configuration is done under the network QoS policy. Example 3-69 demonstrates that the FEX MTU settings configuration on the Nexus switch works on a per-port basis and also on the Nexus support network QoS policy.
Example 3-69 FEX Jumbo MTU Settings
NX-1(config-if)# switchport mode fex-fabric
NX-1(config-if)# fex associate 101
NX-1(config-if)# vpc 101
NX-1(config-if)# mtu 9216
(config-cmap-nqos)# match cos 0-7
NX-1(config)# policy-map type network-qos MTU-custom template 8e
NX-1(config-pmap-nqos)# class type network-qos c-MTU-custom
NX-1(config-pmap-nqos-c)# mtu 9216
NX-1(config)# system qos
NX-1(config-sys-qos)# service-policy type network-qos MTU-custom
Note
Beginning with NX-OS Version 6.2, the per-port MTU configuration on FEX ports is not supported on Nexus 7000 switches. A custom network QoS policy is required to configure these (see Example 3-69).
Troubleshooting MTU Issues
MTU issues commonly arise because of misconfigurations or improper network design, with the MTU not set properly on the interface or at the system level. Such misconfigurations are to be rectified by updating the configuration and reviewing the network design. The challenge comes when the MTU on the interface or system level is configured properly but the software or hardware is not programmed correctly. In such cases, a few checks can confirm whether the MTU is properly programmed.
The first step for MTU troubleshooting is to verify the MTU settings on the interface using the show interface or the show queuing interface interface-type x/y commands. The devices supporting network QoS policy-based MTU settings use the command show policy-map system type network-qos to verify the MTU settings (see Example 3-70).
Example 3-70 Network QoS Policy Verification
Type network-qos policy-maps
============================
policy-map type network-qos policy-MTU template 8e
class type network-qos class-default
In NX-OS, the Ethernet Port Manager (ethpm) process manages the port-level MTU configuration. The MTU information under the ethpm process is verified using the command show system internal ethpm info interface interface-type x/y (see Example 3-71).
Example 3-71 MTU Verification under the ethpm Process
medium(broadcast), snmp trap(on), MTU(9216),
The MTU settings also can be verified on the Earl Lif Table Manager (ELTM) process, which maintains Ethernet state information. The ELTM process also takes care of managing the logical interfaces, such as switch virtual interfaces (SVI). To verify the MTU settings under the ELTM process on a particular interface, use the command show system internal eltm info interface interface-type x/y (see Example 3-72).
Example 3-72 MTU Verification Under the ELTM Process
mtu = 9216 (0x2400), f_index = 0 (0x0)
Note
If MTU issues arise across multiple devices or a software issue is noticed with the ethpm process or MTU settings, capture the show tech-support ethpm and show tech-support eltm [detail] output in a file and open a TAC case for further investigation.
Summary
This chapter focused on troubleshooting various hardware- and software-related problems on Nexus platforms. From the hardware troubleshooting perspective, this chapter covered the following topics:
GOLD tests
Line card and process crashes
Packet loss and platform errors
Interface errors and drops
Troubleshooting for Fabric Extenders
This chapter detailed how VDCs work and explored how to troubleshoot any issues with the same. Various issues arise with a combination of modules within a VDC. This chapter also demonstrated how to limit the resources on a VDC and deeply covered various NX-OS components, such as Netstack, UFDM and IPFIB, EthPM, and Port-Client. Finally, the chapter addressed CoPP and how to troubleshoot for any drops in the CoPP policy, including how to fix any MTU issues on the Ethernet and FEX ports.
References
Cisco, Cisco Nexus 7000 Series: Configuring Online Diagnostics, http://www.cisco.com.
Cisco, Cisco Nexus Fabric Extenders, http://www.cisco.com.
Cisco, Cisco Nexus 7000 Series: Virtual Device Context Configuration Guide, http://www.cisco.com.