Chapter 1. The Network Management World Must Change: Why Should You Care?
This chapter covers
The latest trends in network management
Why you should care about these trends
Why network engineers need new skills for the future
Why existing technologies such as CLI, SNMP, NetFlow/IPFIX, syslog, and so on are not sufficient for network management and automation
Why working with multiple protocols and data models is a pain. Why mapping data models is a source of troubles.
Why automation, automation, automation?
By the end of this chapter, you will understand why the typical ways of managing networks are not sufficient in today’s world, why all the trends in the networking industry these days converge into more programmability, and why the move toward more automation is a compulsory transformation. If you are a network engineer, you will recognize the limitations of existing practices, such as using the command-line interface (CLI), Simple Network Management Protocol (SNMP), NetFlow/IP Flow Information eXport (IPFIX), syslog, and so on. Also, as a network operator, you will understand the challenges of needing to adapt, both your knowledge and your way of working, to be more efficient in managing the services in a network.
Introduction
The Internet changed all aspects of life for virtually everyone. Most of it is taken it for granted these days. When you hear in your house, “Hey, there is no Internet!”, you know you must treat this like a top-priority case in any respectable technical assistance center in the world—assuming you want to keep some level of peace in your household. Granted, the Internet is more important today than ever before, whether for business, education, social networking, banking, or simply leisure. Expressed differently, the Internet continues to get more and more vital.
Behind the Internet infrastructure, network operators work hard to design, deploy, maintain, and monitor networks. What are those network operators actually doing? Trying to categorize the network operator job into different tasks (starting from the old but still sometimes relevant FCAPS model, which stands for Fault, Configuration, Accounting, Performance, and Security Management), the FCAPS model is an international standard, defined by the International Telecommunications Union (ITU),1 that describes the various network management areas.
Table 1-1, the ITU-T FCAPS Model Reference ITU-T M.3400 and ISO / IEC 7498-4 (Open Systems Interconnection—Basic Reference Model, Part 4: Management Framework), describes the main objectives of each functional area in the FCAPS model.
Table 1-1 ITU-T FCAPS Model
Management Functional Areas (MFAs) |
Management Function Set Groups |
|---|---|
Fault |
Alarm Surveillance; Fault Localization & Correlation; Testing; Trouble Administration; Network Recovery |
Configuration |
Network Planning & Engineering, Installation; Service Planning & Negotiation; Discovery; Provisioning; Status & Control |
Accounting |
Usage Measurement, Collection, Aggregation, Mediation; Tariffing & Pricing |
Performance |
Performance Monitoring & Control; Performance Analysis & Trending; Quality Assurance |
Security |
Access Control & Policy; Customer Profiling; Attack Detection, Prevention, Containment and Recovery; Security Administration |
Note
Every respectable network management book contains a reference to FCAPS, so we’ll quickly cover this topic and move on.
This model offers the benefit of segmenting the administration work into more independent and understandable aspects. Fault management is compulsory to analyze the fault situations and manage networks in a proactive way. Configuration management is essential, not only to instantiate new services, but also to improve services and fix mistakes. Accounting management helps with the traffic use measurements, for billing or simply collection. Performance management deals with the on-demand or continuous monitoring of services, in order to proactively detect network faults or degradations.
The one entry in FCAPS that may be more independent is security: With the growing pressure to secure network devices (wireless access points, switches, and routers) and all network-attached devices (PCs, tablets, smartphones, and so on), security engineer became a job all its own.
Note that, a couple of years ago, a new term started to appear next to FCAPS: FCAPS + E (Energy Management). All these devices consume a lot of energy, including core routers from the Internet, data centers full of servers, and also the devices connected to the Internet. For example, an IP phone consumes as little as 2.3 W (when idle) but up to 14.9 W, depending on the Power over Ethernet (PoE, Standard 802.3AF) classification and the enabled functionality.
Today’s and tomorrow’s customers care about services. The only time they care about the network is when it is not working. Providers who deliver services need to deliver them on demand and provide a great end-user customer experience. When a service is not operating to customer expectations, the provider needs to fix the service as quickly as possible. Existing methods of configuring, monitoring, and troubleshooting service-impacting network issues do not meet customer needs for on-demand, high-quality, instant services. Automating all aspects of service delivery is required—from the application server through the network connection to the end consumer. Automated monitoring of service quality, issue detection, and automated recovery are required to deliver a high-quality service experience. Programmatic automation is the key to large-scale and high-quality service delivery.
Network engineers who embrace programmatic automation will be key to the next generation of service delivery. By extending their skills to implement model-driven programmatic automation, they will be valuable contributors, helping their customers deliver the next generation of services.
The five (or six if you count Energy) FCAPS management categories require more automation and more programmability. The time for disconnected network management systems based on these categories is over. The network needs to be managed as a single entity. Obviously, automation of a single category is a step in the right direction. However, automating network configuration without integrating fault management, without looking at the performance of the network and services, without thinking about the security aspects, and without collecting the accounting information, does not provide a full automation picture. In that sense, the FCAPS categories are being blurred these days. Engineers coming from different FCAPS backgrounds will need to integrate their domain-specific knowledge into a company-wide, FCAPS-wide, common automation framework, basically working toward a DevOps model, which is addressed later in this chapter.
Network operators can clearly envision the services model of the future: All network elements are part of a single, programmable fabric. Services can be assembled from a wide range of virtualized devices on the fly, each automatically advertising their programmability capabilities. They can be designed at a high level, independent of the complexities and device dependencies of the heterogeneous underlying infrastructure.
As an example, network service chaining, also known as service function chaining (SFC),2 is a feature that uses software-defined networking (SDN) capabilities to create a service chain of connected network services (such as traffic shaper, intrusion prevention system, intrusion detection system, content filtering, WAN acceleration, firewall, and so on) and connect them in a virtual chain. Network operators can automate SFC end-to-end and provision in order to create or even re-order the services within minutes.
This model is now achievable through the power of SDN and network function virtualization (NFV). Implementing it, however, requires a fully programmable network, whose server resources can scale as the demand grows. Virtualized network functions (VNFs) must be remotely programmable by an SDN controller, and configurations and changes must be entirely automated, without requiring manual intervention by human network operators. To make this possible, equipment vendors, VNF vendors, and server vendors across the industry must evolve their virtualized devices to be programmable in SDN environments. To do it, a standard configuration management protocol is needed to provide secured, reliable transport and support network-wide transactions in the creation, modification, and deletion of configuration information in VNFs.
Going one step further in the services model of the future, the framework should include service assurance. When a service is degraded, an event automatically triggers the network to reconfigure itself. Opening the door for intent-based networking, network operators must specify the service’s characteristics (connectivity, bandwidth, performance metrics such as max delay/loss/jitter, and so on) as opposed to the network configuration. From there, the network will optimize its configuration to support all the services.
The industry zeroed in on NETCONF as a configuration protocol, along with the YANG data modeling language. Originally designed as a management protocol, the NETCONF/YANG combination provides a simple, standardized way to enable a programmable interface to any device or service. Using YANG as the data modeling language in the networking industry initiates a transformational change in network operation: data model–driven management. Throughout the book, you will discover the NETCONF/YANG combination’s clear benefits to programmability, including the following:
Faster service deployment enabled by automation
Fewer service deployment errors enabled by programmatic validation of configuration changes
Improved serviceability (that is, faster time to diagnose and repair issues)
Reduced operating costs by reducing legacy network engineering expenses
As network engineer, you should invest in yourself and become the network engineering of the future using programmatic automation to improve your productivity and the customer experience. This book is a key step in your transformation.
The following sections examine industry trends, some initiated years ago. Most if not all of these trends point to transformation change and network programmability with YANG.
The Industry Has Changed: What Are the Trends?
This section analyzes some trends in the last few years in the networking industry. Analyzing all these trends helps you understand why some operators are embracing more automation and, if you’re not convinced yet, why all operators must adopt data model–driven management now.
Reduced Deployment Time
Operators test router images extensively before going into production. This is obviously a required procedure. In the not-too-distant past, it was not unusual to test new router software for three to six months before effectively deploying a new service in production. This included a mix of manual configuration and network management testing.
More automation in routers and switches was already a goal at that time, but the traditional development lifecycle for equipment vendors was historically (too) long. Let’s take a typical example from an SNMP management system. In this example, the equipment is missing Management Information Base (MIB) modules or some objects within an MIB module (more on SNMP and MIB modules in the section “SNMP: For Monitoring But Not for Configuration”). The expected lifecycle for this missing automation piece is as follows: reporting this feature request to the equipment vendor product management, “battling” for the relative position in the roadmap compared to all other requests, waiting for the implementation, validating a test image, validating the official image once available, and, finally, upgrading the production routers. Needless to say, a long time passed between the feature request and the new production service.
Deploying new services is the only way for operators to grow their revenue, and time to market is key. Spending months to validate a new network element image and a new service is not viable any longer. The rate of deploying new services must improve all the time. Today, operators want to “smoke test” (the preliminary testing to reveal simple failures severe enough to reject a prospective software release) their images, services, or even entire points of presence (PoPs) on virtual devices—before the real deployment. In cloud environments, new services are expected to be up and running in seconds.
Automation can help reduce the deployment time. Thanks to programmability, new features are validated, new services are deployed, and routers are upgraded in no time. This requires consistent and complete instrumentation application programming interfaces (APIs) in network devices with the end goal that everything that can be automated in networking vendors is automated. As a consequence, operators reduce the service deployment time and offer differentiated services compared to the competition. Adapting the management software is typically faster than waiting for the traditional development lifecycle for equipment vendors.
CLI Is No Longer the Norm (If a Feature Cannot Be Automated, It Does Not Exist)
While it may be enjoyable the first couple of times to configure networks manually for learning and testing, the CLI is not a scalable way to introduce new features in production networks. There have been countless “network down” situations due to manual misconfiguration, sometimes called “fat-finger typing.” A typical example is with access list management: Some, if not most, network engineers have inadvertently locked themselves out from the router configuration while updating an access list at least once in their career. It is so easy to mistype an IP address. (You are probably smiling right now, remembering some similar experience in the past.)
The CLI is an interface for configuring and monitoring network elements, designed for consumption by users who will think through an extra space or an added comma, or even a submenu. Although the CLI is not an API, you unfortunately had to treat it as one because that is all you had for so long. However, using the CLI for automation is neither reliable nor cost-effective.
First off, many service-related configuration changes involve more than one device, such as the point-to-point L3VPN example, which requires the configuration of four different devices, or a fully meshed L3VPN, which could involve many more devices. Indeed, every new addition to the fully meshed L3VPN network can entail updating all L3VPN endpoints, updating an access list, introducing an IP service level agreement (SLA) type of probe, and so on. In these examples, only networking devices are discussed. Many modern services these days encompass more than traditional physical networking devices; they include virtual machines, containers, virtual network functions, and so on. The fact is that configuration changes are becoming more and more complex.
Note
An IP SLA is an active method of monitoring and reliably reporting on network performance. “Active” (as opposed to “passive”) monitoring refers to the fact that an IP SLA continuously generates its own traffic across the network and reports on it in real time. Typically, IP SLA probes monitor performance metrics such as delay, packet loss, and jitter.
Second, using highly trained network experts (for example, CCIEs) to insert new commands on network elements is not very cost-effective, unless the goal is obviously to troubleshoot a problem. As the frequency of changes is rapidly increasing, the idea here is to get the human out of the loop for service configuration and monitoring. As a matter of fact, due to the frequency of changes in the network, it became humanly impossible deal with the CLI, as mentioned by Sam Aldrin, Google architect, in his “Data-Driven Ops at Scale: Sensors, Telemetry and Analytics in Large Data Center Networks” talk at the MPLS+SDN+NFVVOLRD conference in 2016.
Third, and most important, although the CLI is human-friendly, it is not suitable for automation. Consider the following:
The CLI is not standardized. While the networking device configuration CLI is similar, it is not consistent from a syntax and semantic point of view across vendors or across a specific vendor’s set of operating systems.
There are dependency issues when configuring devices via the CLI. In some cases, a CLI command for configuring an interface must be entered before configuring a VLAN. If those steps aren’t executed in the proper order, the configuration fails—or worse, it’s only partially completed.
In addition to those dependencies, the CLI provides limited error reporting—at least not error reporting in a format easily consumable by scripts.
The CLI does not produce any structured output. Therefore, the only way to extract information from a show command is via “screen scraping” (or extracting data from output using regular expression pattern matching). Finally, the “show commands” change frequently, to display more features, more counters, and so on. This issue is that even the smallest change to a show command, such adding a space to the output, might break an Expect script that extracts a specific value.
Can you at least use some CLI-based tools? Looking back at the example of deploying those L3VPNs in the previous section, the NMS involved at that time used Expect3 scripts for device configuration and monitoring, with all the known limitations. Expect is an extension to the Tcl scripting language,4 to automate interactions with text-based interfaces for protocols such as Telnet, Secure Shell (SSH), and so on. Typically, you open a terminal session to a network element, introduce a command, and analyze the answer. For example, when you’re logging on to a router, the script codes that the next anticipated word is “login,” and you insert the login username string; then the next anticipated word is “password,” to which the script responds with the password, and so on. This language works fine until the device provides an unexpected answer. A typical example is a customized prompt, changed from “login:” to “Welcome, please enter your credentials:”. At this point, the script, which expected “login:”, receives an unexpected answer and it fails. Another typical example from the technical assistance center (TAC) is the Authentication, Authorization, and Accounting (AAA) configuration that changes the “login:” and “password:” prompts to “username:” and “password:”. The Expect scripts must be adapted for those new prompts. The Expect script customizations, which rely on the CLI for all the different use cases, cost a lot of time, money, and unplanned outages.
It is not impossible to use the CLI for management, but it is expensive and difficult, as the industry has noted well over the last three decades. In fact, this was identified as one of the main reasons why networking did not evolve as fast as the rest of the IT industry by the Stanford Clean Slate project,5 the foundation of the SDN movement (see “The Future of Networking, and the Past of Protocols,”6 by Scott Shenker et al.). On the tooling front, there is an abundance of libraries and tools to interact with the CLI. Next to Expect, tools such as Paramiko7 in Python, Ansible,8 Puppet,9 Chef,10 and so on exist, but when it comes to the CLI, there is no machine-consumable abstraction to make the work easy and more scalable. This results in spending time chasing CLI changes rather than focusing on the goals of automation. On top of that, CLI management has some unforeseen operational consequences. For example, some operators are afraid of upgrading their devices, fearing that the automation scripts will break, up to the point where even required security patches are delayed or not applied. As a side note, this fear of upgrading also explains why the adoption of data model”“driven automation was slow: Starting from a clean state is impossible for operators, who have to rely on existing CLI-based automation scripts for legacy devices. Considering the time between a new protocol specification and its deployment in networks, it is interesting to observe a clear difference between the lifecycle of network management protocols and other types of protocols. A routing protocol might take a couple of years from specification to deployment, whereas network management protocols usually take a decade. The reasons are practical: You need to upgrade the devices and controller/NMS to benefit from the new management protocol, while also updating the CLI-based scripts as backup plan, and at the same time still managing legacy devices that cannot be upgraded.
In conclusion, some operators rightly assert nowadays that if a feature cannot be automated, it does not exist. (This assertion actually comes from a Google engineer during a presentation for a new feature without programmability.) That leads to the development of APIs to monitor and configure the network elements directly...and the full automation story.
Hardware Commoditization and Disaggregation
Another trend in the industry is hardware commoditization, mainly Linux based, as opposed to more exotic purpose-built hardware, along with software disaggregation from the hardware.
In the data center, it is a well-accepted practice to order servers from one hardware company and to buy, independently, the operating system best suited for your specific needs: Windows, Linux, another Unix variant, and so on. These days, you can even easily support multiple operating systems with virtualization.
In the network world, equipment vendors have historically provided their own hardware with their own software, running on proprietary Application-Specific Integrated Circuits (ASICs), with the consequence that customers had to buy a “package” of a specific software tied to a hardware. Although this hardware equipment is optimized for performance in the core, at the edge, in the data center...you name it, the challenge of managing a complete network increases. Indeed, the costs of validating, managing, and maintaining features/services across the network explode when different device types have different operating systems, different feature sets, different CLIs, different management, and different licenses—even sometimes from the same vendors!
There is a growing tendency in the industry to disaggregate the software from the hardware, starting with the data center operation. Off-the-shelf components, with common chips, make up the hardware part of a solution. These are often referred to as white boxes. Historically, the massively scalable data centers, also known as hyperscalers, were the first ones that automated at large scale (for example, with top-of-rack switches). For this automation, they requested an SDK (software development kit) and a related set of APIs. Automation at scale when using the same switch type, from the same vendor, with the same software version is not that difficult. However, the hyperscalers were also the first ones that wanted to go one step further in the disaggregation, with the ability to order or develop their own networking software, mainly from open source projects.
The end goal is to be able to assemble white boxes as unified hardware, with Linux as the operating system, and specific applications for the different networking functions—potentially buying the BGP function from one vendor, the interior gateway protocol (IGP) from another one, and the RADIUS and management functions from a third one. The future is that vendors compete on an application basis: features, robustness, quality, support, upgrade, and so on.
For operators following this trend, the advantages are clear:
Thanks to Linux on networking devices, network and server engineers now speak the same language as their respective devices. They use the same tools, thus blurring the boundary between server and network management, and reducing the support costs (see the next section, “The DevOps Time”). Not only “routers” and “switches” run on Linux, but the Linux environment offers a plethora of tools and applications, including management operations.
Using Linux implies a broader common knowledge: people are better trained, starting directly in school. With this hardware commoditization, networking is perceived as not being that hard any longer because the vendor CLI is not unique. In other words, different equipment vendors are no longer competing on the CLI front. Instead of hiring people who know the Cisco or Juniper CLI, operators can hire candidates with Linux and scripting skills. So senior network engineers should focus less on vendor specifics and more on the broader network architecture and technology underpinnings. On the vendor front, certifications such as CCIE, (partly) based on the CLI knowledge, should be re-centered on programming the network independent of the CLI and on the operational aspects.
Having the same hardware all over in the network, as opposed to more exotic, purpose-built hardware, reduces the network complexity (with the disadvantage that a hardware bug would hit all platforms). Specific software and applications, on the same generic hardware, might optimize some devices. It is a fact that networks become more and more complex, with an increased operational cost, consequently, so any simplification is welcome. Disaggregation specifically means that vendors need a more open and modular platform. Note that disaggregation does not prevent traditional vendors from competing, using proprietary ASICs with their software to gain advantage. For example, Cisco is joining the trend of disaggregation in data center networks, saying it now allows data center customers to run its Nexus operating system (NX-OS) on third-party switches and to use any network operating system on its Nexus switches, thus meeting the demands of hyperscalers and large service providers. The network administrator has some freedom to select the best software either on generic hardware to reduce the cost or on the best hardware (for some extra performance optimization). Expressed this way, the disaggregation might be an opportunity for traditional equipment vendors to provide their software on generic platforms.
Decoupling the software and hardware implies the advantage of having two independent lifecycle managements, one for the software and one for the hardware. While dealing with two lifecycle managements adds a little to the complexity (traditionally the vendor assembled the software), disaggregation gives the added flexibility to pick the best of breed. In certain cases, that flexibility outweighs the complexity. A software upgrade is as simple as upgrading a Linux package. Replacing the software from one vendor with another, or even a different OS train from the same vendor, is easy because the software is just another package. As a Cisco example, moving from an IOS-XE train to an IOS-XR one should not require any hardware change. In the end, the requirement is to enable hardware innovation and software innovation to grow independently.
Network and server engineers can now focus on more business-oriented tasks as opposed to just network operation and maintenance. More and more, the network is becoming a business enabler, and the link between the business and the network is precisely the software. Quickly adapting the software to the business needs becomes key—for example, to add an application for performance probing, to supplement the network with virtual load balancers, to inject specific routes on top of an IGP for particular applications...you name it. With the time gained from automation (coming from disaggregation in this case, but not only from disaggregation), engineers will be the key enablers of networking innovations to serve the business needs.
In summary, hardware commoditization and disaggregation allow for and require more automation. Programmatic management based on YANG, discussed throughout the rest of the book, is a way to manage these new networks.
The DevOps Time
Networks engineers need to adapt. The only constant in this networking industry is change. So how does one adapt? In other words, how does one stay relevant in a couple of years? Interestingly, pretty much all network engineer job descriptions these days require some sort of scripting skills. Reflecting on this, you should learn scripting as a way to automate network management tasks, and not just server tasks with shell scripts. If you were to ask around which programming language to learn, the answer will consistently be “start with Python.”
Python is a modern programming language that is easy to read and write and yet is powerful enough to be used as a convenient tool for daily parsing tasks, performance management, and configuration. Many SDKs are provided in Python, and there is a vast number of available libraries. Useful scripts can be created in no time. Interacting with the Python command line adds to the fun of learning Python. As an example, a course such as “An Introduction to Interactive Programming in Python”11 from Coursera12 provides the required basics with weekly videos, quizzes, and mini-projects that master Python. With a few professionals teaching something interesting, a community around the world wanting to learn and ready to share its knowledge, you easily get a final project that looks like this YouTube video13 [Asteroids game in Python (coursera.org)].
Will all network engineers have to become full-time programmers in the future? No. The trend toward automation, SDN, cloud, virtualization, everything-as-a-service, and so on does not imply that network engineers will disappear. When a (young) application designer complains that his call to the API “get-me-a-new-service-over-the-network (bandwidth = infinite, packetloss = 0, one-way-delay = 0, jitter = 0, cost = 0)” doesn’t work as expected, you will still need a network engineer to troubleshoot. The best (that is, the most efficient) network engineers will be the ones with the ability to script their automated network-related tasks, whether for configuration or service assurance, and can modify their scripts on the fly. Instead of repeating a manual task, you must automate it!
So, what is DevOps? The combination of Development and Operations, DevOps is a software engineering practice that aims at unifying the software development and software operations.
Why? Because software engineers do not necessarily understand networking, and networking engineers do not necessarily understand software, so combining forces to get the best out of both worlds makes sense.
DevOps advocates automation and monitoring at all steps of software construction, from integration, testing, and releasing to deployment and infrastructure management. Expressed differently, DevOps is the intersection of development, operations, and quality assurance, as it emphasizes the interdependence of applications (or services), development, and IT operations, as shown in Figure 1-1.
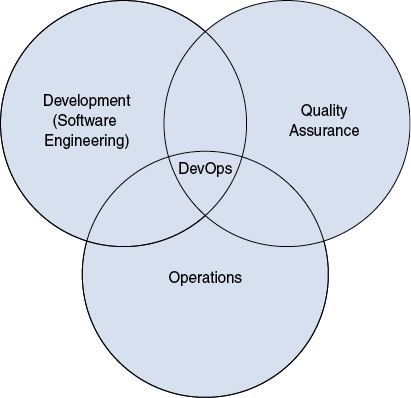
Figure 1-1 DevOps
This new DevOps mentality is about blending development and operations to provide quicker service deployment and iteration. As a practical example, it means that two historically distinct groups, the network support team and the application/server support team, now work as a single team, thus avoiding the ping-pong game of “this is a networking issue” versus “this is a server issue.” The networking nirvana is being able to manage network elements the same way you manage servers.
Note
From now on, we’ll stop making a distinction between network engineers and compute engineers (dealing with the servers), because in the future this distinction will completely disappear. Indeed, the networking and application worlds will come together. Unless we’re making a specific point, we’ll use the term “operation engineers” or “DevOps engineers” instead.
Software-Defined Networking
The new paradigm for many years now has been software-defined networking (SDN). Granted, although SDN is not a new term, it is an overloaded term—a buzzword that means many different things to many different people.
The first SDN discussions introduced the concept of the separation of the control and data plane entities, with a focus on OpenFlow (now part of the Open Networking Foundation15) as the open standard to configure the data plane—Forwarding Information Base (FIB), or Media Access Control (MAC) table.
Here are some of the use cases for configuring the control plane independent of an Interior Gateway Protocol (IGP) such as OSPF or IS-IS (Intermediate System to Intermediate System):
Research in terms of programmable data planes: traffic engineering, service insertion, tunneling, and so on
The ability to run control software on general-purpose hardware (commodity servers)
A centralized controller taking care of all forwarding aspects for the entire network
Typically, an OpenFlow controller configures the data plane, via the API, the CLI, or a GUI, in an OpenFlow switch, as depicted in Figure 1-2. This OpenFlow controller manages the control plane, for which it requires the full topology view and the endpoints/flows.
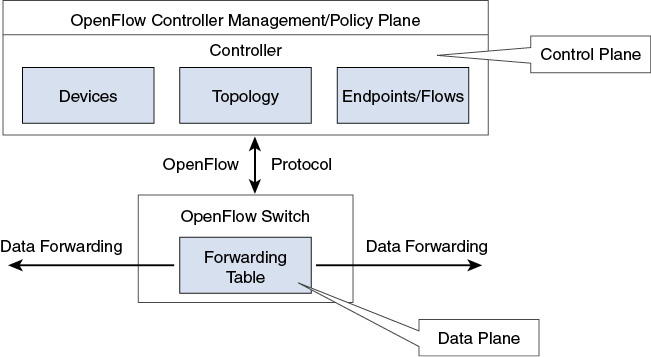
Figure 1-2 OpenFlow
Through the years, the notion of SDN has been evolving. OpenFlow, as a fundamental packet-forwarding paradigm, was actually an enabler—an enabler for more and easier network programmability. For example, the Open vSwitch Database Management Protocol (OVSDB, RFC 7047) is an open source effort to configure virtual switches in virtualized server environments. The OpenDaylight16 project, an open source controller project, did a great job of adding multiple configuration protocols as southbound interfaces, next to OpenFlow:
PCEP, the Path Computation Element communication Protocol (RFC 5440), is a communication protocol between a Path Computation Client (PCC) and a Path Computation Element (PCE), or between two PCEs, which includes path computation requests and path computation replies as well as notifications of specific states related to the use of a PCE in the context of Multiprotocol Label Switching (MPLS) and Generalized MPLS (GMPLS) traffic engineering.
Forces, which stands for FORwarding and Control Element Separation (RFC 5810), aims to define a framework and associated protocol(s) to standardize information exchange between the control and forwarding plane.
BGP-LS, which stands for BGP Link State Distribution (RFC 7752), is a mechanism by which link-state and traffic engineering information is collected from networks and shared with external components using the BGP routing protocol.
NETCONF/YANG provides a simple, standardized way to enable a programmable interface to any device or service (covered extensively in this book).
Therefore, the term SDN evolved to mean a variety of things: network virtualization in the cloud, dynamic service chains for service provider subscribers, dynamic traffic engineering, dynamic network configuration, network function virtualization, open and programmable interfaces, and so on. What is for sure is that SDN is much more than OpenFlow and simply splitting the control and data planes.
A pragmatic definition of SDN comes from David Ward’s foreword in the book SDN: Software Defined Networks,17 by Ken Gray and Tom Nadeau: “SDN functionally enables the network to be accessed by operators programmatically, allowing for automated management and orchestration techniques; application of configuration policy across multiple routers, switches, and servers; and the decoupling of the application that performs these operations from the network device’s operating system.”
Some might say this is actually a definition of DevOps, not SDN. The bottom line is that SDN, as a control plane separation paradigm, enabled more network programmability requirements, optimized speed and flexibility, and made a move from configuration time to software time.
In the end, SDN as a control plane separation paradigm (configuring the Routing Information Base [RIB] or the FIB) and DevOps (which some call SDN) are complementary: They use the same concepts and the same tools. As a practical example, a network operator might be configuring an IGP for distributed forwarding with tools based on NETCONF and YANG and inject specific policies on top of the IGP, directly in the RIB.
Network Function Virtualization
Another trend in the industry, again explaining why some operators are embracing more automation these days, is network function virtualization (NFV). NFV offers more flexibility to customers in terms of service deployments and greatly reduces the complexity and time-to-market associated with new services. For example, virtual functions such as firewall, virtual intrusion detection system, deep packet inspection, and so on, are now added via the click of a button thanks to lifecycle service orchestration. Previously, those functions were integrated into dedicated hardware appliances, which added to the overall cost—not only of the installation, the connectivity, and the physical space, but also the ongoing maintenance.
As mentioned in the whitepaper “Trends in NFV Management,”18 network operators have sound business reasons for embracing NFV. When network elements are virtualized instances rather than physical appliances, they can be provisioned and changed much more quickly. They scale dynamically with demand, allowing operators to spin up (or down) network resources for their customers as needed, in minutes or even seconds, rather than waiting weeks or months to deploy new hardware. They are automated and driven by machine logic rather than manual processes, thus driving down operational costs and complexity as well as reducing the risk of human error. And they radically shorten the time needed to move from receiving an order to generating revenue from a fully functional service. NFVs also allow operators more freedom to choose best-of-breed VNFs from a variety of vendors, and to easily move from one VNF to another due to superior pricing or features. The operator can take one VNF (say, a firewall) from one vendor and replace it with a similar VNF from another vendor—and accomplish this much more quickly and easily than replacing physical appliances.
Much of the discussion of VNF management among providers today focuses on onboarding—getting their VNFs booted and spun up in their initial configured state, placed in the right location, connected to the right physical and virtual networks, and ensuring that they have the appropriate resources and licenses. All of this “Day 1” and “Day 0” setup is important, and operators should be (and are) working to make it simpler. But often lost in the discussion is their responsibility for what happens “Day 1” and beyond, once VNFs are up and running. How do network operators link virtualized elements with service orchestration and other Operations Support System (OSS) and Business Support System (BSS) systems to allow for ongoing configuration changes? How do they automate the day-to-day management of multivendor VNFs in dynamic, large-scale networks?
Too many operators still view virtualization as a function of taking existing operating systems, booting them up in a virtual machine (VM), providing the same interfaces used when the product was a physical device, and that’s it. Performing some runtime configuration management has been done for a long time for all devices, the thinking goes, and it has worked just fine, so there is no reason to do anything different. However, virtualized environments bring a new set of challenges that the tried-and-true mechanisms used for conventional physical appliances simply cannot account for.
Ultimately, it will be time to move away from the concept of “configuring” network appliances, as we begin to view virtualized functions as software to be programmed. This book discusses how to use NETCONF and YANG to introduce a more standardized API into network elements and unlock the value of full NFV automation.
Elastic Cloud: Pay As You Grow
Historically, new companies that wanted to enter a new business, relying on networking for that purpose, had to buy a series of networking equipment and operate it even before the first customer purchase order. CapEx (capital expenditure) is the money spent on buying, maintaining, and improving the fixed assets, while OpEx (operating expenditure) is the ongoing cost for operating the product or the business. For new companies, the CapEx is the cost of the network itself, while the OpEx is the IT employees’ salaries (or the consulting fees) for operating the network. Not only does this CapEx require some nonnegligible amount of money to be invested by the young company, but ordering, installing, and operating this networking implies a delay before satisfying the first customer order. On top of that, sizing this network correctly might prove challenging for a new company: If it’s sized too small, this might impact the future services and company growth, and if it’s sized too big, this would be a waste of money.
These days, new businesses are not keen on investing such a huge amount of CapEx/OpEx on Day 1 for the networking aspects. Instead, having a linear cost as the business grows is the ideal solution: the more customers, the more revenue, and as a consequence the more investment in the infrastructure. This is the elastic concept, also known as “pay as you grow,” with an ideal CapEx linear investment starting at an amount close to zero. When the elastic concept involves networking, it refers to the dynamic adaption of the network based on load. The cloud is the typical way to offer some compute, storage, and networking features, in an elastic way, thanks to virtualization—hence the name “elastic cloud.”
Here is a typical example: A yangcatalog.org19 website (a repository of YANG tools and the metadata around YANG models with the purpose of driving collaboration between authors and adoption by consumers) was staged by having a virtual computer on which to run the web service: an Amazon Web Service (AWS) EC2. The following is from the Amazon documentation: “Amazon Elastic Compute Cloud (Amazon EC2) is a web service that provides secure, resizable compute capacity in the cloud. It is designed to make web-scale cloud computing easier for developers. [...] Amazon EC2 reduces the time required to obtain and boot new server instances to minutes, allowing you to quickly scale capacity, both up and down, as your computing requirements change. Amazon EC2 changes the economics of computing by allowing you to pay only for capacity that you actually use.”
Initially, a free AWS instance did the trick for the yangcatalog.org19 website. However, as more services were added to the website, it required more capacity (memory, CPU, and storage). Based on the website’s success, it was an investment in a real plan, paying for more resources and paying by the second for active servers (that is, “elastic cloud”). Although this example mentions AWS, you should note that multiple similar solutions exist in the industry, such as Microsoft Azure, Google Cloud Platform, and OVH Cloud, to name a few.
More complex examples than the YANG catalog include VNFs, such as virtual firewalls, virtual intrusion detection systems, load balancers, WAN accelerators, and so on, as mentioned in the previous section, but the elastic cloud principles remain.
In terms of cloud management, you need to distinguish two different types: on one side you have system-level management, and on the other side you have service management or NFV management inside the container or virtual machine.
System-level management consists of tasks such as the following:
Preparing the environment with Linux packages installation
Upgrading the OS and applying patches
Setting up containers or virtual machines
Scaling up, which means growing the infrastructure (compute, storage, and networking), to accommodate more/better services
Scaling out, which means replicating the infrastructure
This system-level management, which is more of a procedural type of management (a workflow driven by action), might benefit from a Business Process Modeling Language (BPML) such as Topology or Orchestration Specification for Cloud Applications (TOSCA20), a template based mechanism that describes the topology of cloud-based services, their components, and their relationships.
The service management inside the container or virtual machine consists of tasks such as these:
Starting up and stopping the service.
More importantly, maintaining or upgrading the service. For example, in the case of updating an access list entry, you cannot stop the virtual firewall.
This management benefits more from a schema-like language such as YANG, which provides the API and semantic-based actions. This is the model-driven management paradigm, which is explored in the next section.
Data Model–Driven Management
Scripts are relatively easy to create and, to some extent, fun to write. The hard part is the maintainability. Try to look at one of your troubleshooting scripts one year after creation and, unless the script contains a well-known convention (such as PEP8,21 a style guide for Python code), a clean structure, and some documentation, chances are it will look unfamiliar. Improving this script would require quite some time, and mostly likely the famous “If it ain’t broke, don’t fix it” principle would prevail.
Good scripts are based on good APIs (sets of functions and procedures that enable the creation of applications that access the features or data of an operating system, application, or other service), which fundamentally should provide the following benefits:
Abstraction: A programmable API should abstract away the complexities of the underlying implementation. The DevOps engineers should not need to know unnecessary details, such as a specific order of configurations in a network element or specific steps to take if something fails. If this isn’t intuitive for humans, the sequencing of commands becomes even more complex for configuration engines. Configurations should function more like filling in a high-level checklist (these are the settings you need; now the system can go figure out how to properly group and order them).
Data specification: The key thing an API does—whether it is a software or network API—is provide a specification for the data. First, it answers the question of what the data is—an integer, string, or other type of value? Next, it specifies how that data is organized. In traditional programing, this is called the data structure, though in the world of network programmability and databases, the more common term is schema, also known as data models. Since the network is basically being treated as a (distributed) database, the term (database) schema is sometimes used.
Means of accessing the data: Finally, the API provides a standardized framework for how to read and manipulate the device’s data.
Data model-driven management builds on the idea of specifying in models the semantics, the syntax, the structure, and constraints of management objects. From there, scripts use APIs rendered from those models via tooling. The advantage is that, as long as the models are updated in a backward-compatible way, the previous set of APIs is still valid.
An important advantage of data model–driven management is the separation of the models from the protocols and encodings, which means that it is easier to add protocols and encodings. Data model–driven management was initially built on NETCONF and XML, but other protocols/encodings have since seen the light: RESTCONF with JavaScript Object Notation (JSON), gRPC Network Management Interface (gNMI) with protobuf, and so on. Note that XML and JSON are text-file formats used to store structured data for embedded and web applications. Chapter 2, “Data Model–Driven Management,” covers the different protocols and encodings.
As you will see in Chapter 7, “Automation Is as Good as the Data Models, Their Related Metadata, and the Tools: For the Network Architect and Operator,” once the models are well specified and the full toolchain is in place, then the automation is simplified and the OPEX reduced. While the data model–driven management concepts are not new, it is one viable type of management in today’s networks. So data model–driven management is a special trend in this book, as this book is entirely dedicated to all aspects of this transition in the industry.
When applying an API to a complex environment, the key is that vendors implement it in a standards-based way. There should be a common way to define and access data across different devices and vendors—not separate, proprietary interfaces that operators must learn for every different device and function in their network.
Figure 1-3 illustrates how changing from management via static CLI scripts to a model-driven approach impacts the network operations. It shows a service provider in the Americas who was migrating its services from one set of older devices to a newer set. Notice that the transition was initially rather slow, and took some time to complete at the initial pace. Then a data model–driven automation tool was introduced in September 2016 (in this case, a Cisco product called NSO, Network Services Orchestrator) that fundamentally changed the way the network was transitioning.

Figure 1-3 Number of Circuits Moved by Date, Initially Based on CLI Scripts, Then with Data–Model Driven Automation Software
(Data Model–Driven) Telemetry
Telemetry is a big buzzword in the networking industry these days. Like any buzzword, telemetry means different things to different people—exactly like SDN a few years ago. In different discussions with people from different backgrounds, telemetry meant the following:
The science and technology of automatic measurement and transmission of measurement data.
The mechanism to push any monitoring information to a collector (in that sense, NetFlow is a telemetry mechanism). Since it is about streaming data on regular basis, it is also known as “streaming telemetry.”
The data model–driven push of information, streaming YANG objects.
The hardware-based telemetry, pushing packet-related information directly from ASICs.
Device-level telemetry, such as the pushing of information about hardware and software inventory, configuration, the enabled/licensed features, and so on, with the intention to automate diagnostics, understand overall usage, and provide install base management.
In discussions, it is important to justify the reason why data model-driven telemetry is the most useful type of telemetry that requires automation. First off, why is telemetry necessary? You’ve heard all types of reasons: because SNMP is boring, because SNMP is slow, because SNMP is not precise in terms of polling time—you name it. You may have even heard “because SNMP is not secure.” Well, SNMPv3 provides security with authentication and privacy! Anyway, there are bigger reasons to focus on data model–driven telemetry:
SNMP does not work for configuration, although it is suitable for monitoring (see RFC 3535 for a justification).
Network configuration is based on YANG data models, with protocol/encoding such as NETCONF/XML, RESTCONF/JSON, and gNMI/protobuf.
Knowing that a configuration is applied does not imply that the service is running; you must monitor the service operational data on top.
There is not much correlation between the MIB modules, typically used for network monitoring, and YANG modules used for configuration, except maybe a few indices such as the ifIndex in “The Interfaces Group MIB” (RFC 2863) or the interface key name in “A YANG Data Model for Interface Management” (RFC 7223, obsoleted by RFC 8343).
Any intent-based mechanism requires a quality assurance feedback loop, which is nothing more than the telemetry mechanism, as explained in the next section.
Therefore, since the configuration is “YANG data model driven,” so must the telemetry.
The only exception to data model–driven telemetry might be one from hardware-based telemetry: pushing a lot of telemetry directly from ASICs (for a subset of the traffic, at line rate), which might not leave room on the network element for a YANG-related encoding without a penalty in terms of the telemetry export rate. However, it is still possible to describe the exported data with a YANG data model with most any encoding type.
Operations engineers need to manage the network as a whole, independently of the use cases or the management protocols. Here is the issue: with different protocols come different data models, and different ways to model the related type of information. In such a case, the network management must perform the difficult and time-consuming job of mapping data models: the one from configuration with the one from monitoring. Network management was a difficult task with the CLI, MIB modules, YANG models, IPFIX information elements, syslog plain text, TACACS+, RADIUS, and so on. Therefore, protocol design decisions that do not simplify this data model mapping issue are frowned upon. Ideally, the network should present data arriving over different protocols that use the same concepts, structures, and names so that the data can be merged into a single consistent view. In other words, a single data model is needed.
Intent-Based Networking
The services are becoming more and more complex, with a mix of networking functions at the edge, the core, and the data center, as well as the combination of networking, compute, and storage in the cloud. With this increased complexity today and, at the same time, an increased frequency of changes, it is important to know to get the humans out of the loop, to focus on automation. Data model–driven management simplifies the automation and specifies that the telemetry must be data model driven. Now, does the network behave as expected? Are the new services operational? Are the SLAs respected? You could check that the network device, the virtual machine, or the container is reachable and check that the services or the VNFs are correctly configured. However, validating the configuration and reachability of individual components does not imply that the services are running optimally or meet the SLAs.
The cost of service failure is going up significantly these days. Imagine the monetary implications of one hour of downtime for Facebook services, whose business model depends solely on advertisements. Imagine the monetary implications of one hour of downtime for AWS, whose business model depends on web service utilization.
This is where the notion of intent-based networking comes to play, with networks constantly learning and adapting. Historically, managing in a prescriptive mode by focusing on detailing the necessary network configuration steps was common. Contrary to the prescriptive approach, the intent-based approach focuses on the higher-level business policies and on what is expected from the network. In other words, the prescriptive approach focuses on how, while the intent-based approach focuses on what. For example, the prescriptive way of configuring an L3VPN service involves following a series of tasks, expressing the how. For example, you must configure a VRF called “customer1” on provider edge router1 under the interface “eth0,” a default gateway pointing to router1 on the customer edge router, the MPLS-VPN connectivity between the provider edge router1 and router2, and so on.
Conversely, the intent-based way focuses on what is required from the network (for example, a VPN service between the London and Paris sites for your customer).
Where intent-based networking creates the most value is with constant learning, adapting, and optimizing, based on the feedback loop mechanism, as shown in the following steps:
STEP 1. Decomposition of the business intent (the what) to network configuration (the how). This is where the magic happens. For a single task such as “a VPN service between the London and Paris sites for customer C,” you need to understand the corresponding devices in Paris and London, the mapping of the operator topology, the current configuration of the customer devices, the operator core network configuration, the type of topology (such as hub and spoke or fully meshed), the required Quality of Service (QoS), the type of IP traffic (IPv4 and/or IPv6), the IGP configuration between the customer and the operator, and so on. Examine all the possible parameters for an L3VPN service in the specifications of the YANG data model for L3VPN service delivery (RFC 8299).
STEP 2. The automation. This is the easy part, once the what is identified. Based on the data model–driven management and a good set of YANG models, a controller or orchestrator translates the YANG service model (RFC 8299) into a series of network device configurations. Thanks to NETCONF and two-phase commit (more on this later), you are now sure that all devices are correctly configured.
STEP 3. The monitoring with data model–driven telemetry provides a real-time view of the network state. Any fault, configuration change, or even behavior change is directly reported to the controller and orchestrator (refer to the previous section).
STEP 4. Data analytics correlate and analyze the impact of the new network state for service assurance purposes, isolating the root cause issue—sometimes, even before the degradation happens. From there, the next network optimization is deduced, almost in real time, before going back to step 1 to apply the new optimizations.
This constant feedback loop, described in four steps, is the foundation for networks that constantly learn and adapt. It allows moving away from reactive network management where a network fault (or worse, a customer call) triggers the troubleshooting to constant monitoring focused on the SLAs. The combination of predictive analytics and artificial intelligence, combined with continuous learning and adapting, is the main enabler here. From here, the next logical step is not too futuristic: self-healing networks.
Even if this book doesn’t cover the “intent,” per se, it covers steps 2 and 3 in order to realize intent-based networking.
Software Is Eating the World
As Marc Andreessen correctly predicted in the article “Why Software Is Eating The World”23 in the Wall Street Journal in 2011, “software programming tools and Internet-based services make it easy to launch new global software-powered start-ups in many industries—without the need to invest in new infrastructure and train new employees.”
This is a trend in the industry, where consumers are offered all the possibilities: online banking, hotel and flight booking, virtual lobby assistants, booking a taxi via an application, placing calls from their PCs, watching TV or reading a book on a tablet, listening to music on their mobile phones, and connected cars. While those offer more flexibility to the end users, the service provider wants to reduce its own OpEx by using software, thus reducing the human interaction and hence costs.
Coming back to the world of networking, in no time these days you can register a domain name, create multiple email addresses, and host a website. Almost instantaneously, with a few clicks, you can enable IPv6, add a database to your website, enable protection with a firewall, and create an SSL certificate. The on-demand cloud computing platforms, which offer some storage, compute resources, and some basic networking, can add a virtual network and include some virtual networking functions such as firewall, virtual intrusion detection system, or accounting.
The main point is that all these new services are available almost immediately, thanks to software. And this software in the background is composed of automation and sometimes data analytics for customization.
Existing Network Management Practices and Related Limitations
Managing networks is not new. This section looks at “traditional” network management practices. Traditionally, networks have used different management protocols for different FCAPS management aspects, with different management models and different practices—typically, CLI and “screen scraping,” SNMP, NetFlow and IPFIX, and syslog. From there, you can observe the respective protocol limitations, which highlight the issue of the different data models in the next section.
These protocols describe the current practical normality of most of the network operation that happens in the world today. While each section can seem a little disparate and contain a multitude of little details, the picture comes together in the summary at the end of the chapter. The big picture will be clearer once you have seen a snapshot of how each of these environments work to get a glimpse into some of their gory details.
CLI: Is This an API?
Most devices have a built-in command-line interface (CLI) for configuration and troubleshooting purposes. Network access to the CLI has traditionally been through the Telnet protocol, with the addition of the SSH protocol to address security issues associated with Telnet. At some point in time, the CLI was the only way to access devices, for both configuration and troubleshooting. And the CLI grew with any new features to become a huge list of configuration and show commands.
CLI: Explained
CLIs are generally task-oriented, which makes them easier to use for human operators. As the goal is human consumption, the design principle is for the CLI to change to be more readable. As an example, an old IOS command was changed from show mac-address-table to show mac address-table, probably motivated by a developer thinking it was better from an interface point view or maybe to be consistent with a new “show mac” feature. For users, who most of the time use the command autocomplete function while interacting with the device, this change is not be an issue. Indeed, most command-line interfaces provide context-sensitive help that reduces the learning curve. However, a script that sends commands to the device would now fail as a consequence of this CLI change.
On the other side, a saved sequence of textual commands is easily replayed: Typically, the same access list, in the form of a CLI snippet, can be applied to multiple devices. With simple substitutions and arbitrary text-processing tools, operation engineers can apply similar CLI snippets to network elements. Typically, the access-list snippet contains a couple of arguments to be replaced, depending on the managed device characteristics.
CLI: Limitations
The “CLI is No Longer the Norm” section covered already most of the CLI limitations, and this section adds some practical configuration examples, such as the following snippet:
Conf t
  router ospf x
  vrf xxx
Here is another example:
Conf t
  vrf xxx
  router ospf x
In other words, it is very well possible that a command on different devices, even from the same vendor, behaves differently. What is the root cause behind those differences? CLIs typically lack a common data model.
These VRF examples lead to the second CLI limitation: The CLI is context-sensitive and order-specific. A question mark helps with the listing of all available options, but entering one command might offer a submenu of commands. While adding commands raises a problem, removing commands offers some challenges, too. Coming back to the VRF example, removing a VRF might remove the entire VRF-related set of commands, again depending on device implementation. Since CLIs are proprietary, in syntax and semantics they cannot be used efficiently to automate processes in an environment with a heterogenous set of devices.
The command-line interface is primarily targeted at human users, who can adapt to minor syntax and format changes easily. Using the CLIs as a programmatic interface is troublesome because of parsing complexities. For example, CLIs don’t report consistent error code in case of failure—a necessary automation property. On top of that, there is no way to discover new CLI changes: CLIs often lack proper version control for the syntax and the semantics. It is therefore time-consuming and error-prone to maintain programs or scripts that interface with different versions of a command-line interface. What’s more, the CLIs keep evolving, as more features are introduced. Sure, those changes are documented in the release notes, at least for the configuration commands, but the automation cannot consume those release notes.
So, is the CLI an API? It was used like one, but it is fragile.
As a quiz, Example 1-1 shows four potential situations operations engineers might encounter dealing with a CLI. Can you find the errors? What is wrong with these outputs?
Example 1-1 CLI Quizzes
Router1#show run
Command authorization failed
Router1#

Router2#show run
Unable to read configuration. Try again later
Router2#

Router3#show run
Router3#

Router4#show run
...
 description %Error with interface
...
Router4#
The show command on Router1 looks like an AAA (Authorization, Authentication, Accounting) issue, while it might point to an non-volatile random-access memory (NVRAM) issue on Router2. The Router3 output doesn’t look right, unless the configuration is empty. Finally, the Router4 output looks like an error, while actually it’s not! In this particular case, the operations engineer configured the interface description with “%Error with interface” to flag an issue with this specific interface. Again, for a user, this description helps; however, for a CLI-based script, the consequences might be unexpected. In this particular case, this caused a bug in an Expect3 script in automating configuration archival. When the script tried to upload the configuration, it stopped working once it encountered this particular description line, thinking that the script itself was in error. Indeed, the script was based on a regular expression (regex) based on “Error”. This example perfectly illustrates the difficulties of using the CLI for automation. Let’s face it—the CLI is not suited for automation. It is not machine-friendly and lacks a well-defined format. The CLI has been used for years, as it was the only way to configure and collect device information, but it’s very fragile.
SNMP: For Monitoring But Not for Configuration
SNMP, the Simple Network Management Protocol, is a protocol specified by the IETF. Actually, there have been multiple protocol versions. Here is a brief history of the different SNMP versions:
SNMPv1 (historic): The first version of the protocol, specified by RFC 1157. This document replaces the earlier versions that were published as RFC 1067 and RFC 1098. The security is based on SNMP community strings.
SNMPsec (historic): This version of the protocol added strong security to the protocol operations of SNMPv1 and is specified by RFC 1351, RFC 1352, and RFC 1353. Security is based on parties. Few, if any, vendors implemented this version of the protocol, which is now largely forgotten.
SNMPv2p (historic): For this version, much work was done to update the SNMPv1 protocol and Structure of Management Information version 1, and not just security. The result was updated protocol operations, new protocol operations and data types, and party-based security from SNMPsec. This version of the protocol, now called party-based SNMPv2, is defined by RFC 1441, RFC 1445, RFC 1446, RFC 1448, and RFC 1449. (Note that this protocol has also been called SNMPv2 classic, but that name has been confused with community-based SNMPv2. Thus, the term SNMPv2p is preferred.)
SNMPv2c (experimental): This version of the protocol is called community string-based SNMPv2. Specified by RFC 1901, RFC 1905, and RFC 1906, it is an update of the protocol operations and data types of SNMPv2p and uses community-based security from SNMPv1.
SNMPv2u (experimental): This version of the protocol uses the protocol operations and data types of SNMPv2c and security based on users. It is specified by RFC 1905, RFC 1906, RFC 1909, and RFC 1910.
SNMPv3 (standard): This version of the protocol is a combination of user-based security and the protocol operations and data types from SNMPv2p and provides support for proxies. The security is based on that found in SNMPv2u and SNMPv2*, and updated after much review. The documents defining this protocol are multiple:
RFC 3410: Introduction and Applicability Statements for Internet-Standard Management Framework.
RFC 3411: An Architecture for Describing SNMP Management Frameworks. Now updated by RFC 5343: Simple Network Management Protocol (SNMP) Context EngineID Discovery, and by RFC 5590: Transport Subsystem for the Simple Network Management Protocol (SNMP).
RFC 3412: Message Processing and Dispatching for SNMP.
RFC 3413: SNMPv3 Applications.
RFC 3414: User-Based Security Model (USM) for version 3 of SNMPv3.
RFC 3415: View-Based Access Control Model (VACM) for SNMP.
RFC 3584: Coexistence between Version 1, Version 2, and Version 3 of the Internet-standard Network Management Framework.
The goal of this book is not to delve into the SNMP details. There are plenty of valuable references, books, and tutorials dedicated to the technical aspects of SNMP, Structure of Management Information (SMI), and Management Information Base (MIB), so there is no point in covering everything here, especially when one of the key messages from this book, as you will quickly realize, is to move away from SNMP. However, let’s look at just a few concepts that are necessary within this book.
SNMP: Explained
As displayed in Figure 1-4, an SNMP Agent, embedded in a device to be managed (typically a router or a switch in the networking context), responds to requests for information and actions from the SNMP Manager, sitting in a Network Management System (NMS): typical information includes interface counters, system uptime, the routing table, and so on. These data sets are stored in the device memory and are retrieved from a network management application by SNMP polling. The MIB is the collection of those managed objects residing in a virtual information store in the SNMP Agent. A collection of related managed objects is defined in a specific MIB module. For example, interfaces-related objects are specified in the “Interfaces Group MIB” document, detailed by the IETF in the RFC 2863. The SMI defines the rules for describing management information, using the Abstract Syntax Notation One (ASN.1) as an interface description language. In other words, SMI is the data-modeling language used to describe objects to be managed via the SNMP protocol.
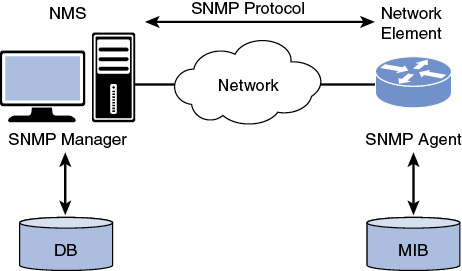
Figure 1-4 The SNMP Basic Model
The following types of interactions occur between the SNMP Manager and SNMP Agent:
Read: The ability to read managed objects from the SNMP Agent, characterized by “read-only” objects in MIB modules. A typical example is the polling of interface counters’ statistics, described by the ifInOctets and ifOutOctets managed objects (RFC 2863).
Write: The ability to set managed objects in an SNMP Agent, if the managed objects are specified with a “read-write” status in the MIB module (for example, changing an interface administrative status with the ifAdminStatus managed objects [RFC 2863]).
Notification, also known as trap or inform: This is a push-based mechanism (as opposed to pull, when the SNMP Manager polls information from the SNMP Agent) from the SNMP Agent to the SNMP Manager. A typical example is a linkUp or linkDown notification [RFC 2863], sent to the SNMP Manager when the interface operational status changes.
SNMP: Limitations
The idea behind the SNMP specifications was to develop a generic protocol used for the configuration and monitoring of devices and networks, effectively covering the FCAP aspects, with the S of Security being treated separately. The SNMP notifications covers the Fault aspects, the configuration of read-write MIB objects covers the Configuration aspects, while the myriad of read-only MIB objects could cover some aspects of Accounting and Performance.
SNMPv1 was published in 1990, and SNMPv3 was finished in 2002. So many years of experience went into the third version. While it took some time for SNMPv3, with its added security considerations, to be widely implemented, years later it drew an important conclusion: SNMP has always done a good job in terms of monitoring devices. However, it fails at device configuration.
In 2003, RFC 3535, “Overview of the 2002 IAB Network Management Workshop,” documented the outcomes of a dialogue started between network operators and protocol developers to guide the IETFs’ focus on future work regarding network management. This paper reported a list of strong (+), weak (-), and neutral (o) points related to the SNMP protocol.
Multiple factors prevented SNMP from replacing the device CLI as the primary configuration approach. Some points are briefly addressed in RFC 3535 and complemented with some experience here:
First, a question of money: The SNMP Agent code costs too much to develop, test, and maintain, compared to the CLI code. SNMP seems to work reasonably well for small devices that have a limited number of managed objects and where end-user management applications are shipped by the vendor. For more complex devices, SNMP becomes too expensive and too hard to use [SNMP Set: Can it be saved?].24
Poor performance for bulk data transfers, due to User Datagram Protocol (UDP) characteristics. The typical examples are routing tables, with the polling of the BGP table, which takes a considerable amount of time. SNMP has the same data transfer behavior as Trivial File Transfer Protocol (TFTP), which is UDP-based, so a lot of time is spent waiting. Especially if there is any latency in the network, this becomes problematic. However, the good thing about SNMP being UDP-based is that the traffic can get through in case of congestion. Note that one operator who went from SNMP polling to NETCONF saw a tenfold increase in performance in a real production network. A more typical value is two or three times faster with NETCONF (which is TCP-based, so it’s an FTP-style transfer).
Poor performance on query operations that were not anticipated during the MIB design. A typical example is the following query: Which outgoing interface is being used for a specific destination address?
It is usually not possible to retrieve complete device configurations via SNMP so that they can be compared with previous configurations or checked for consistency across devices. There is usually only incomplete coverage of device features via the SNMP interface, and there is a lack of differentiation between configuration data and operational state data for many features. For example, while SNMP Manager set the interface state with the ifAdminStatus object, it must poll the ifOperStatus object to check the applied operational state. This example is an obvious one for any network operator, but this link between those two objects cannot be discovered in a programmatic way.
MIB modules and their implementations are not available in a timely manner (sometimes MIB modules lag years behind), which forces users to use the CLI. Indeed, as already mentioned, it is a reality that device management has been an afterthought. Once operators are “forced” to use scripts to manage their CLI (for example with Expect scripts), there is not much incentive to use a different mechanism for not much added value.
Lexicographic ordering is sometimes artificial with regard to internal data structures and causes either significant runtime overhead or increases implementation costs or implementation delay, or both. A typical example is the routing table, whose data needs to be rearranged before answering an SNMP request.
Operators view current SNMP programming/scripting interfaces as being too low-level and thus too time-consuming and inconvenient for practical use. Also, device manufacturers find SNMP instrumentations inherently difficult to implement, especially with complex table indexing schemes and table interrelationships. As a practical example, RFC 5815 specifies an MIB module for the monitoring and configuration of IPFIX (IP Flow Information eXport), also known as NetFlow version 10. Created in a very flexible way, this MIB module allows all possible configuration options allowed by the Flexible NetFlow CLI options. Therefore, some table entries require up to four indices, increasing the complexity to a point where it is not recommended implementing this MIB module. For the record, the same exercise was performed with a YANG module and produced RFC 6728: Configuration Data Model for the IPFIX and Packet Sampling (PSAMP) Protocols.
There is a semantic mismatch between the low-level data-oriented abstraction level of MIB modules and the task-oriented abstraction level desired by network operators. Bridging the gap with tools is in principle possible, but in general it is expensive because it requires some serious development and programming efforts.
MIB modules often lack a description of how the various objects can be used to achieve certain management functions. MIB modules are often characterized as a list of ingredients without a recipe.
SNMP lacks a way to find out the version of the SNMP MIB modules implemented on the device, let alone a mechanism to get a copy. Accessing the vendor website or calling customer support is a compulsory step.
The SMI language is hard to deal with and not very practical.
SNMP traps are used to track state changes, but often syslog messages are considered more useful since they usually contain more information to describe the problem. SNMP traps usually require subsequent SNMP GET operations to figure out what the trap really means.
Note that an IETF effort to fix SMI and SNMP, SMIng (SMI Next Generation),25 concluded in 2003 without clear results.
In 2014, the Internet Engineering Steering Group (IESG),26 the IETF group responsible for technical management of IETF activities and the Internet standards process, issued a statement on “Writable MIB modules.”27
If not already clear before from the state of the industry, this statement definitively discourages specifying MIB modules for configuration and sets the new direction by pointing to the NETCONF/YANG solution.
NetFlow and IPFIX: Mainly for Flow Records
The first flow-related BoF (Birds of a Feather) took place in London in Summer 2001 during IETF meeting 51. A few months later, the IP Flow Information eXport (IPFIX) working group (WG)28 was created, with the following chartered goal: “This group will select a protocol by which IP flow information can be transferred in a timely fashion from an ‘exporter’ to a collection station or stations and define an architecture which employs it. The protocol must run over an IETF-approved congestion-aware transport protocol such as TCP or SCTP.” The charter planned for three deliverables: the requirements, the architecture, and the data model. At that time, the intent was to standardize NetFlow, a Cisco proprietary implementation that was already deployed in operator networks. And so it started.
The WG debated for a long time on the requirements for the future IPFIX protocol selection and hence the IPFIX architecture. There were five candidate protocols, with different capabilities, to select from, and each of the candidate proponents were obviously pushing their own protocol. From there, the WG chairs decided that the WG should classify all requirements as “must,” “should,” “may,” and “don’t care.” RFC 3917, “Requirements for IPFIX,” documented this outcome. An independent team, in charge of evaluating the different protocols in light of documented requirements concluded that the goals of the IPFIX WG charter were best served by starting with NetFlow v9, documented in the mean time in the informational RFC 3954.
The next couple of years were dedicated to IPFIX protocol specifications. The WG spent a year or so on transport-related discussions: should you use TCP or Stream Control Transmission Protocol (SCTP) as the congestion-aware transport protocol? Or use UDP, as most operators only cared about UDP when the flow export collection is exclusively within their management domain? On top of that, the distributed function of forwarding ASICs complicate congestion-aware transport requirements such as TCP or SCTP. The final specifications compromised on the following:
“SCTP [RFC4960] using the PR-SCTP extension specified in [RFC3758] MUST be implemented by all compliant implementations. UDP MAY also be implemented by compliant implementations. TCP MAY also be implemented by compliant implementations.”
The IPFIX protocol (RFC 5101) and the IPFIX information model (RFC 5102) were finally published in January 2008 as proposed standards. In the end, IPFIX is an improved NetFlow v9 protocol with extra features and requirements such as transport, string variable-length encoding, security, and template withdrawal messages.
The IPFIX WG closed in 2015, with the following results:
The IPFIX protocol and information model, respectively RFC 7011 and RFC 7012, published as Internet standards
A series of RFCs regarding IPFIX mediation functions
Almost 30 IPFIX RFCs29 in total (architecture, protocol extensions, implementation guidelines, applicability, MIB modules, YANG module, and so on)
From there, theIPFIX community worked on PSAMP (Packet SAMPling),30 another WG, which selected IPFIX to export packet sampling information, and produced four RFCs.31 Note: a series of sampled packets is nothing more than a flow record with some specific properties.
NetFlow and IPFIX: Explained
Like for SNMP, there are numerous books, videos, and references explaining NetFlow and IPFIX in details, so this short explanatory section only focuses on the aspects required in this book.
In a nutshell, an IPFIX exporter, which is typically a router, starts by exporting a template record containing the different key fields and non-key fields in the flow record definition. The metering process inside the IPFIX exporter observes some flow records with these key and non-key fields and, after some flow expiration, exports them according to the template record. A key field is a field that makes a flow unique: So if a packet is observed with a (set of) key field value(s) not yet available in the IPFIX cache, a new flow record is created in that cache, as shown in Figure 1-5.
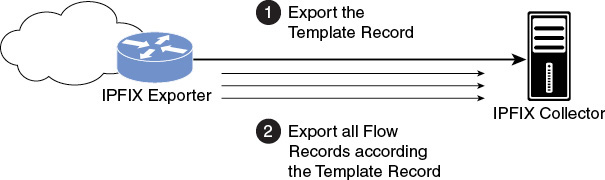
Figure 1-5 The IPFIX Basic Model
Figure 1-6 shows a typical flow record, composed of numerous IPFIX information elements, where the flow keys are displayed in grey and the non-key fields in light blue.
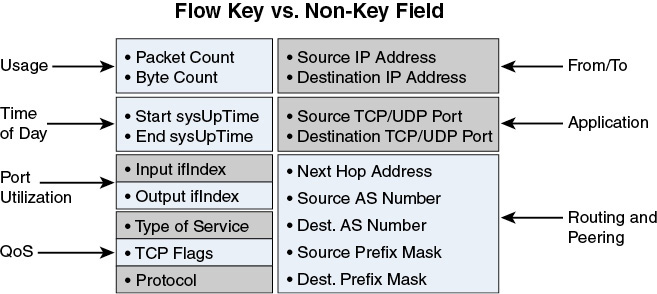
Figure 1-6 NetFlow Version 5 Flow Format
The IPFIX information elements are specified by the IETF in an IANA (Internet Assigned Number Authority) registry, or they can be vendor specific. From Figure 1-6, the Packet Count and Input ifIndex are specified, respectively, as shown in Example 1-2.
Example 1-2 NetFlow Packet Count and Input IfIndex Specifications
packetTotalCount

   Description:
      The total number of incoming packets for this Flow at the
      Observation Point since the Metering Process (re-)initialization
      for this Observation Point.
   Abstract Data Type: unsigned64
   Data Type Semantics: totalCounter
   ElementId: 86
   Status: current
   Units: packets

ingressInterface

   Description:
      The index of the IP interface where packets of this Flow are
      being received.  The value matches the value of managed object
      'ifIndex' as defined in RFC 2863.  Note that ifIndex values are
      not assigned statically to an interface and that the interfaces
      may be renumbered every time the device's management system is
      re-initialized, as specified in RFC 2863.
   Abstract Data Type: unsigned32
   Data Type Semantics: identifier
   ElementId: 10
   Status: current
   Reference:
      See RFC 2863 for the definition of the ifIndex object.
Based on the distinction between data model and information models, covered later on in this chapter, it is debatable whether the IPFIX information model (RFC 7012) and IPFIX information elements should not be called, respectively, IPFIX data model and IPFIX data model elements, as they are directly linked to the implementation details.
NetFlow and IPFIX: Limitations
IPFIX is widely deployed in the world of flow monitoring, for capacity planning, security monitoring, application discovery, or simply for flow-based billing. The flexibility of the Flexible NetFlow metering process offers the ability to select any IPFIX information element as key field or non-key field, thus creating multiple use cases for deploying IPFIX.
The biggest IPFIX limitation is that it only reports flow-related information, even if, in practice, it became a generic export mechanism. Let’s play with the IPFIX acronym.
I P F I X
IPFIX was created for IP, but is not limited to IP: It can export more than IP layer information, such as MAC address, MPLS, TCP/UDP ports, applications, and so on.
I P F I X
That leaves us with FIX, but from a protocol point of view, nothing prevents us from forwarding non-flow-related information, such as the CPU, for example.
F I X
That leaves with us with IX, for “Information eXport,” as an acronym for this generic export mechanism.
I X
This proposal was discussed, more to make a point, during one of the IPFIX IETF WG meetings, but the name change was never, rightly, acted upon.
Two other proposals went into that direction of a generic export mechanism:
RFC 6313 specifies an IPFIX protocol extension to support hierarchical structured data and lists (sequences) of information elements in data records. This extension allows for the definition of complex data structures such as variable-length lists and specification of hierarchical containment relationships between templates. One of initial ideas behind this specification was to export complete firewall rules, along with the blocked flow records.
RFC 8038 specifies a way to complement IP Flow Information Export (IPFIX) data records with Management Information Base (MIB) objects, avoiding the need to define new IPFIX information elements for existing MIB objects that are already fully specified. One of the initial ideas behind this specification was to export next to the flow record and its QoS class map the class-based QoS counters available in the MIB module.
Those two proposals, created to extend the IPFIX protocol scope, arrived too late after the IPFIX specifications at the time when the interest for IPFIX remains focused on flow-related information. However, those two proposals, initially proposed in 2009 and 2010, were early signs that more automation and data model consolidation in the industry were under way.
Syslog: No Structured Data
Syslog was developed in the 1980s as a mechanism to produce logs of information enabling software subsystems to report and save important error messages either locally or to a remote logging server, as shown in Example 1-3.
Example 1-3 Typical Syslog Messages
00:00:46: %LINK-3-UPDOWN: Interface Port-channel1, changed state to up
00:00:47: %LINK-3-UPDOWN: Interface GigabitEthernet0/1, changed state to up
00:00:47: %LINK-3-UPDOWN: Interface GigabitEthernet0/2, changed state to up
00:00:48: %LINEPROTO-5-UPDOWN: Line protocol on Interface Vlan1, changed state to
down
00:00:48: %LINEPROTO-5-UPDOWN: Line protocol on Interface GigabitEthernet0/1, changed
state to down 2
*Mar  1 18:46:11: %SYS-5-CONFIG_I: Configured from console by vty2 (10.34.195.36)
18:47:02: %SYS-5-CONFIG_I: Configured from console by vty2 (10.34.195.36)
*Mar  1 18:48:50.483 UTC: %SYS-5-CONFIG_I: Configured from console by vty2
(10.34.195.36)
With many implementations, starting with the Unix-like operating systems (with the documentation in the Unix manual pages), syslog became a de facto standard. Years later, the IETF32 documented this common practice in informational RFC 3164, “The BSD Syslog Protocol.”
RFC 5424, “The Syslog Protocol,” was standardized in 2009, with the goal to separate message content from message transport while enabling easy extensibility for each layer, and to obsolete RFC 3164. It describes the standard format for syslog messages and outlines the concept of transport mappings. It also describes structured data elements, which are used to transmit easily parseable, structured information, and allows for vendor extensions. Unfortunately, the implementations did not follow the standard publication. As of today, the authors know of only one commercial implementation.
Syslog: Explained
Since RFC 5424 was not adopted by the industry, this section explains the RFC 3164 de facto standard characteristics.
Syslog is a very basic reporting mechanism, composed of plain English text: It does not contain information elements like in IPFIX or variable bindings like in SNMP. Syslog messages are transmitted from the syslog agent (the device under monitoring) to the syslog daemon over UDP, in an unacknowledged way. The syslog header format offers a filtering field, the “facility,” and a “level” field that flags the urgency level, from 7 to 0 (debug: 7, information: 6, notification: 5, warning: 4, error: 3, critical: 2, alert: 1, emergency: 0), as perceived by the sender, as shown in Figure 1-7.
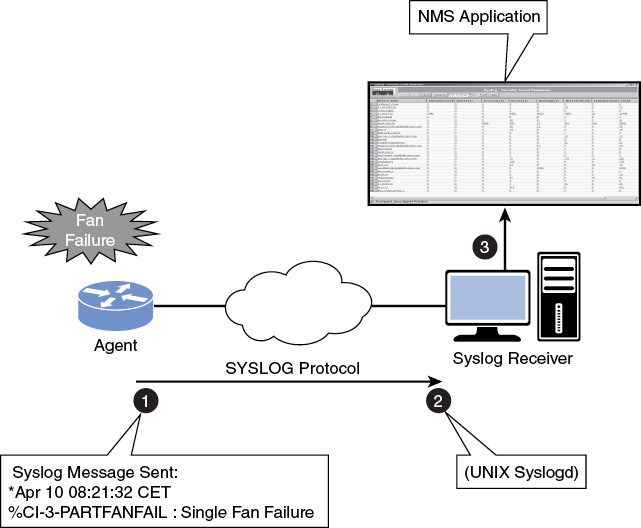
Figure 1-7 Syslog Basic Model
Syslog: Limitations
On one side, the syslog message content in plain English text is an advantage for developers, as creating a new syslog message is as easy as printing a US-ASCII string (such as the C language printf function). This is also an advantage for network operators who can quickly interpret the readable syslog message. On the other side, this English text freeform content is also the biggest drawback. Except for some basic syslog messages (such as linkUp or linkDown), there is little uniformity in the syslog message content, which prevents automatic processing. To some extent, this prevents human processing, too, if there are many messages. The typical use is to search for keywords, then to read a few entries around that point in time in hopes of understanding what’s going on.
Example 1-4 shows the format of Network Address Translation (NAT) information logged for ICMP Ping via NAT Overload configurations.
Example 1-4 Syslog Message for NAT for ICMP Ping via NAT Overload Configurations
Apr 25 11:51:29 [10.0.19.182.204.28] 1: 00:01:13: NAT:Created icmp
135.135.5.2:7 171 12.106.151.30:7171 54.45.54.45:7171
54.45.54.45:7171
Apr 25 11:52:31 [10.0.19.182.204.28] 8: 00:02:15: NAT:Deleted icmp
135.135.5.2:7 172 12.106.151.30:7172 54.45.54.45:7172
54.45.54.45:7172
With a list of four IP address/port pairs, how do you determine which pairs represent the pre- and post-NAT processing, or the inside and outside IP addresses? A syslog daemon cannot make any assumptions based on the syslog message content, and no message processing automation is possible without knowing or assuming the syslog message convention for that device type or at best the device vendor.
Data Modeling Is Key for Automation
This section explores the challenges to managing a network with different protocols and data models.
Before delving into data models, it is important you understand the differences between information models and data models.
The Differences Between Information Models and Data Models
The following is from RFC 3444:
“The main purpose of an information model is to model managed objects at a conceptual level, independent of any specific implementations or protocols used to transport the data. The degree of specificity (or detail) of the abstractions defined in the information model depends on the modeling needs of its designers. In order to make the overall design as clear as possible, an information model should hide all protocol and implementation details. Another important characteristic of an information model is that it defines relationships between managed objects.
Data models, conversely, are defined at a lower level of abstraction and include many details. They are intended for implementors and include protocol-specific constructs.
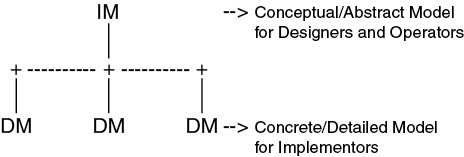
The relationship between an information model (IM) and data model (DM) is shown in the drawing above. Since conceptual models can be implemented in different ways, multiple data models can be derived from a single information model.”
“... IMs are primarily useful for designers to describe the managed environment, for operators to understand the modeled objects, and for implementors as a guide to the functionality that must be described and coded in the DMs. The terms ‘conceptual models’ and ‘abstract models,’ which are often used in the literature, relate to IMs. IMs can be implemented in different ways and mapped on different protocols. They are protocol neutral.
An important characteristic of Information Models is that they can (and generally should) specify relationships between objects. Organizations may use the contents of an Information Model to delimit the functionality that can be included in a DM.”
Information models can be defined in an informal way, using natural languages such as English. Alternatively, information models can be defined using a formal language or a semi-formal structured language. One of the possibilities to formally specify information models is to use class diagrams of the Unified Modeling Language (UML).33 An important advantage of UML class diagrams is that they represent objects and the relationships between them in a standard graphical way. Because of this graphical representation, designers and operators may find it easier to get an overview of the underlying management model.
Compared to information models, data models define managed objects at a lower level of abstraction. They include implementation- and protocol-specific details (for example, rules that explain how to map managed objects onto lower-level protocol constructs).
Most of the management models standardized to date are data models. Some examples include the following:
Management Information Base (MIB) modules, specified with SMI.
Common Information Model (CIM) schemas, developed within the Distributed Management Task Force (DMTF). The DMTF publishes them in two forms: graphical and textual. The graphical forms use UML diagrams and are not normative (because not all details can be represented graphically).
Taking into account the data model and information model definitions, the authors believe that the IPFIX information model (RFC 7102) should be called a “data model.”
Operations engineers need to manage networks as a whole, independent of the use cases or the management protocols. And here is the issue: with different protocols come different data models, and different ways to model the same type of information.
The Challenges of Managing Networks with Different Data Models
As an example used throughout the rest of this section, let’s look at the management of the simple “interface” concept, through the different protocols and data models as well as the challenges faced by an NMS.
Figure 1-8 depicts the interfaceIndex in the Interfaces MIB module in RFC 2863, and from the same RFC, Figure 1-9 show the ifEntry, Figure 1-10 show the ifTable, Figure 1-11 shows the ifAdminStatus, and Figure 1-12 shows the ifOperStatus.
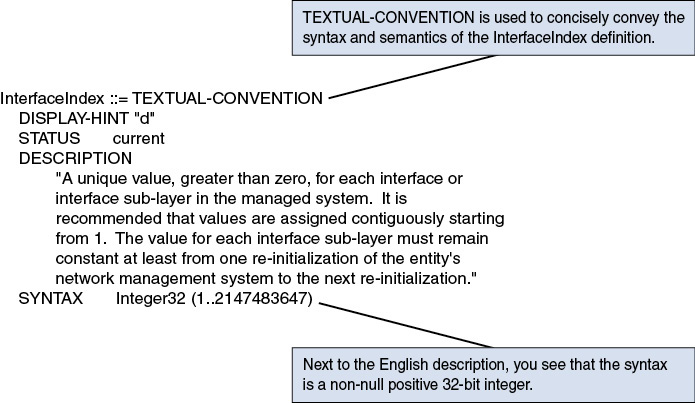
Figure 1-8 InterfaceIndex in the Interfaces Group MIB Module
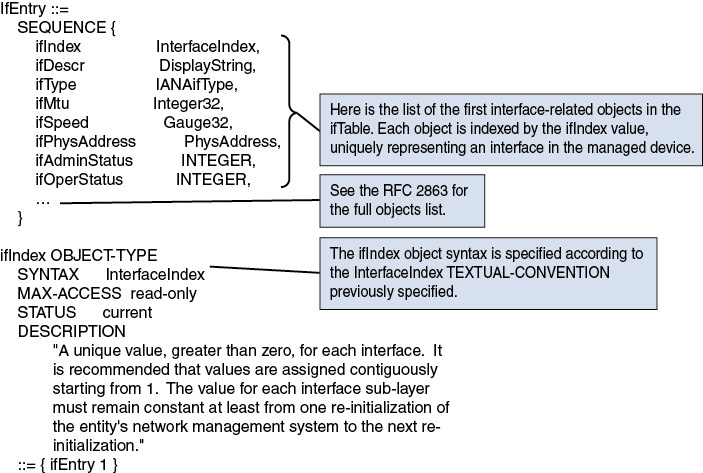
Figure 1-9 ifEntry in the Interfaces Group MIB Module
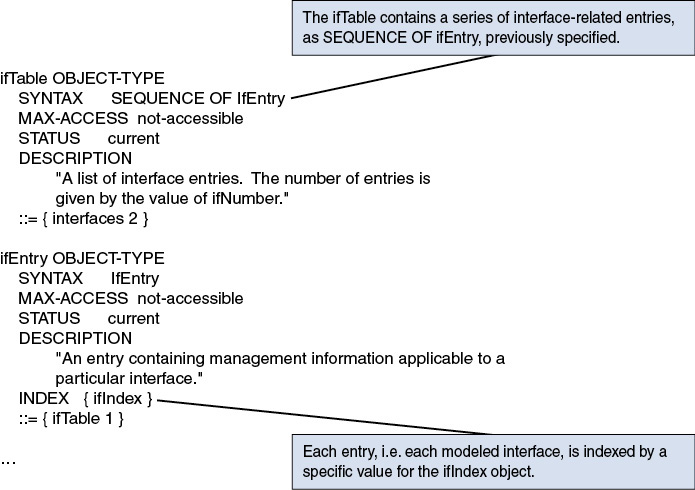
Figure 1-10 ifTable in the Interfaces Group MIB Module
The interface administrative status is set with the ifAdminStatus object, while the corresponding operational status is read with the ifOperStatus object, with the same ifIndex value, as shown in Figure 1-10.
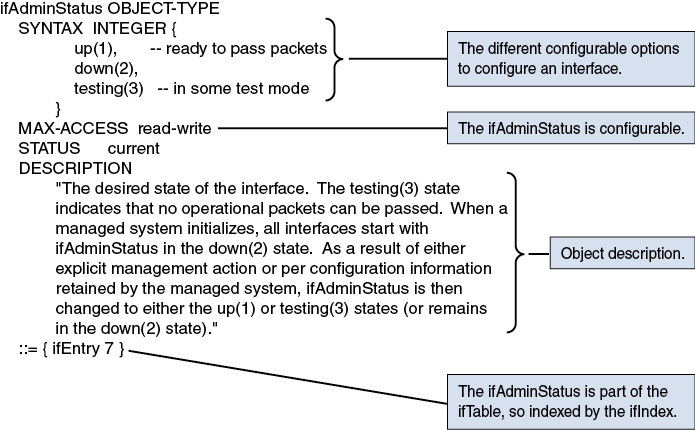
Figure 1-11 ifAdminStatus in the Interfaces Group MIB Module
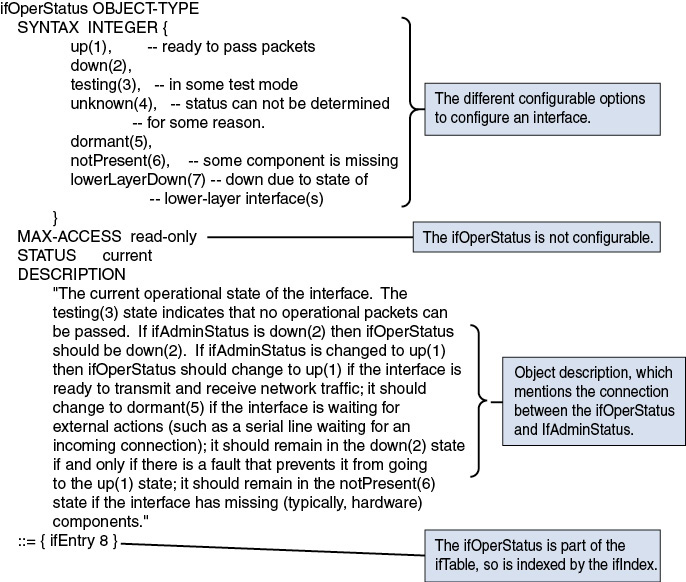
Figure 1-12 ifOperStatus in the Interfaces Group MIB Module
Notice that the ifOperStatus English description is the only place where there’s a connection between the two important objects: the ifAdminStatus to configure the interface state and the ifOperStatus to monitor the effective interface status. That highlights yet another important SNMP drawback: The mapping between the intended and applied status is not deduced automatically by tooling. Careful inspection of the description clauses reveals the information, but this requires extensive knowledge of the MIB content. In turn, this mapping must be hardcoded in the SNMP-based NMS.
Not all interface counters on managed devices are available via MIB modules. As an example, the interface load is not available, as shown in Example 1-5.
Example 1-5 Interface Load
router# show interfaces
Serial0/2 is up, line protocol is up
  Hardware is GT96K with 56k 4-wire CSU/DSU
  MTU 1500 bytes, BW 56 Kbit, DLY 20000 usec,
     reliability 255/255, txload 1/255, rxload 1/255
  Encapsulation FRAME-RELAY IETF, loopback not set
  Keepalive set (10 sec)
  LMI enq sent  2586870, LMI stat recvd 2586785, LMI upd recvd 0, DTE LMI up
  LMI enq recvd 24, LMI stat sent  0, LMI upd sent  0
  LMI DLCI 0  LMI type is ANSI Annex D  frame relay DTE
  Broadcast queue 0/64, broadcasts sent/dropped 0/0, interface broadcasts 0
  Last input 00:00:05, output 00:00:05, output hang never
  Last clearing of "show interface" counters 42w5d
  Input queue: 0/75/0/13 (size/max/drops/flushes); Total output drops: 0
  Queueing strategy: fifo
  Output queue: 0/40 (size/max)
  5 minute input rate 0 bits/sec, 0 packets/sec
  5 minute output rate 0 bits/sec, 0 packets/sec
     9574781 packets input, 398755727 bytes, 0 no buffer
     Received 0 broadcasts, 0 runts, 0 giants, 0 throttles
     2761 input errors, 2761 CRC, 1120 frame, 624 overrun, 0 ignored, 2250 abort
     9184611 packets output, 289103201 bytes, 0 underruns
     0 output errors, 0 collisions, 195 interface resets
     0 output buffer failures, 0 output buffers swapped out
     668 carrier transitions
     DCD=up  DSR=up  DTR=up  RTS=up  CTS=up
In this case, operations engineers must poll multiple objects to deduce the load, as shown in the following snippet:
utilization = (ifInOctets + ifOutOctets) * 800 / hour / ifSpeed
The alternative is to screen-scrape the value from the show interfaces command, with all the “screen scraping” difficulties.
In some other cases, “screen scraping” is the only solution. For example, a Cisco ASR1000 device offers some Cisco QuantumFlow Processor (QFP) counters at the ASIC level: Those counters are not available via MIB modules. So, on top of SNMP, the NMS requires “screen scraping.”
Now, let’s assume that the same NMS must correlate the SNMP information with the syslog messages—not an easy task! As shown in the “Syslog: Limitations” section earlier in the chapter, the syslog message content in plain English text is basically freeform text. For user consumption, the interface name, as opposed to the ifIndex, is used within interface-related syslog messages, as shown in Example 1-6.
Example 1-6 Interface Down Syslog Message
*Apr  7 21:45:37.171: %LINK-5-CHANGED: Interface GigabitEthernet0/1, changed state to
administratively down
*Apr  7 21:45:38.171: %LINEPROTO-5-UPDOWN: Line protocol on Interface
GigabitEthernet0/1,
changed state to down
Therefore, an NMS must first extract the interface name from the syslog messages—again, not an easy task, as there are no conventions for naming interfaces in the industry. Syslog messages might contain “GigabitEthernet0/1” or “GigE0/1,” “GigEth 0/1,” or any other variation, which complicates the regular expression search. Once done, the NMS must correlate the interface name with yet another MIB object, the ifName, representing the interface name. This works fine if and only if the managed devices keep the same naming convention for both the ifName and the syslog messages, which is not a given. The NMS becomes complex when dealing with different protocols and data models, starting with MIB, CLI, and syslog messages.
Now, let’s assume that the same NMS, to combine flow-related use cases, must integrate the NetFlow or IPFIX flow records information. That NMS application needs to map yet a different data model: the NetFlow/IPFIX one. While specifying the IPFIX information elements, the designers carefully aligned the IPFIX definition with the ifIndex MIB value. However, the Interfaces Group MIB module does not specify the notion of direction as an interface attribute. Instead, the octet counters in the ifTable aggregate octet counts for unicast and non-unicast packets into a single octet counter per direction (received/transmitted). IPFIX, on the other hand, needs the notion of an interface direction: Are the flow records observed on an ingress or egress interface? That slightly different semantic in interface definition has led to two distinct IPFIX information elements, as opposed to the unique ifIndex object in the SNMP world. The two IPFIX information elements, as specified in the IANA registry,34 are the ingressInterface and the egressInterface, as shown in Example 1-7.
Example 1-7 ingressInterface and egressInterface IPFIX Definitions
ingressInterface

   Description:
      The index of the IP interface where packets of this Flow are being
      received.  The value matches the value of managed object 'ifIndex'
      as defined in RFC 2863.  Note that ifIndex values are not assigned
      statically to an interface and that the interfaces may be
      renumbered every time the device's management system is
      re-initialized, as specified in RFC 2863.
   Abstract Data Type: unsigned32
   Data Type Semantics: identifier
   ElementId: 10
   Status: current
   Reference:
      See RFC 2863 for the definition of the ifIndex object.

egressInterface

   Description:
      The index of the IP interface where packets of this Flow are being
      sent.  The value matches the value of managed object 'ifIndex' as
      defined in RFC 2863.  Note that ifIndex values are not assigned
      statically to an interface and that the interfaces may be
      renumbered every time the device's management system is
      re-initialized, as specified in RFC 2863.
   Abstract Data Type: unsigned32
   Data Type Semantics: identifier
   ElementId: 14
   Status: current
   Reference:
      See RFC 2863 for the definition of the ifIndex object.
An NMS mapping IPFIX flow records with MIB objects must hardcode this MIB-object-versus-IPFIX-information-elements mapping.
Now, in the AAA (Authorization, Authentication, and Accounting) world, the interface is again modeled differently. In the AAA world, the port represents the interface on which a user tries to authenticate. In the RADIUS (Remote Authentication Dial In User Service) protocol (RFC 2865), the interface notion is specified as the “NAS-Port,”35 as shown in Example 1-8.
Example 1-8 RADIUS NAS-Port Interface Definition
NAS-Port

   Description

      This Attribute indicates the physical port number of the NAS which
      is authenticating the user.  It is only used in Access-Request
      packets.  Note that this is using "port" in its sense of a
      physical connection on the NAS, not in the sense of a TCP or UDP
      port number.  Either NAS-Port or NAS-Port-Type (61) or both SHOULD
      be present in an Access-Request packet, if the NAS differentiates
      among its ports.


   A summary of the NAS-Port Attribute format is shown below.  The
   fields are transmitted from left to right.

    0                   1                   2                   3
    0 1 2 3 4 5 6 7 8 9 0 1 2 3 4 5 6 7 8 9 0 1 2 3 4 5 6 7 8 9 0 1
   +-+-+-+-+-+-+-+-+-+-+-+-+-+-+-+-+-+-+-+-+-+-+-+-+-+-+-+-+-+-+-+-+
   |     Type      |    Length     |             Value
   +-+-+-+-+-+-+-+-+-+-+-+-+-+-+-+-+-+-+-+-+-+-+-+-+-+-+-+-+-+-+-+-+
              Value (cont)         |
   +-+-+-+-+-+-+-+-+-+-+-+-+-+-+-+-+

   Type

      5 for NAS-Port.

   Length

      6

   Value

      The Value field is four octets.
In TACACS+ (Terminal Access Controller Access-Control System Plus),36 the interface is again modeled differently, as shown in Example 1-9.
Example 1-9 TACACS+ port and port_len Interface Definition
port, port_len

The US-ASCII name of the client port on which the authentication is
taking place, and its length in bytes.  The value of this field is
client specific.  (For example, Cisco uses "tty10" to denote the
tenth tty line and "Async10" to denote the tenth async interface).
The port_len indicates the length of the port field, in bytes.
The NMS wanting to integrate the authentication, authorization, and accounting with the MIB and IPFIX world must hardcode the data model mapping and the semantic mapping.
This example of an NMS that must integrate information from MIB modules, CLI, syslog messages, NetFlow and IPFIX, and AAA protocols such as RADIUS and TACACS+ shows the basic difficulties of dealing with different data models, which obviously don’t use the same syntax and semantics. Even for a basic “interface” concept, which is well know from an information model point of view, this leads to much implementation complexity for the NMS. Figure 1-13 is a summary of the interface definition for the different data models used in this example, minus the CLI, which might not have a data model.
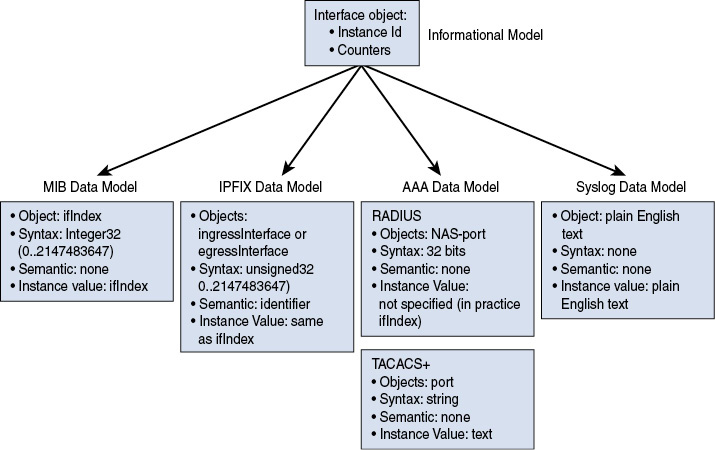
Figure 1-13 Interface Object Information Model and Related Data Models
In these different trends, you have seen that the CLI is no longer the norm. Software-defined networking and DevOps need clear APIs with well-known semantics and consistent syntax. This leads to the era of data model–driven management. In fact, intent-based networking is extremely difficult, if not impractical and impossible, without a consistent data model to work from. To go one step further, machine learning, yet another important trend in the coming years, will simply be impossible without the right foundation—data models that can present consistent information, both from a syntax and semantic point of view, as input to machine learning.
Interview with the Experts
Q&A with Victor Kuarsing
Victor Kuarsing is co-chair of the IETF’s Link State Vector Routing working group and a longstanding contributor focused on operational input into the standards development process. He is a technical and organizational leader at Oracle Cloud, where he contributes to the architecture and deployment of next-generation networks and systems. Throughout his career, Victor has been focused on building large-scale and specialized networks and platforms. His current focus is on the cloud networking space, ensuring that systems are modernized and meet the ever-changing demands of rapidly evolving services and customer expectations.
Question:
Victor, as a director of networking engineering and data center operations at Oracle and as an active participant in the IETF, which trends do you see in the industry (both in networking and the data center) and how do they affect your business?
Answer:
When we look at how networks were built years ago, there has been a fundamental shift in how we approach modern network designs and deployments. Historically, networks were built in a manner indicative of an operational model, where the network administrator interacted with the system to a high degree. Whether the administrator was deploying systems, modifying systems, or managing systems, it was typically via a command-line interface. The historical model we used served us quite well given the relative size and complexity of the network systems we had built. The early model, either directly or indirectly, resulted in a configuration pattern that lent itself and was optimized for human interaction. For example, if a designer or administrator was attempting to build complex policies, such as one would do with a peering router using BGP toward peers, it was crafted in a manner that minimized the amount of configuration syntax to aid in readability.
Early networks not only were optimized for user interaction, they were also, in general, simpler and smaller compared to some of the networks we build today. Earlier networks were often deployed on a per-service basis (less service aggregation) and did not require as much integration of services. When we look at today’s networks, the level of complexity in many environments has increased. In other networks, even if simplicity can be achieved, such as pushing complexity to a network or service overlay, the scale of newer networks drastically exceeds what we built years ago. Data centers are getting larger, backbone networks aggregate more functions and services, and access networks grow more vast and complex.
To meet the demands brought on by larger and often more complex environments, we have shifted how we approach network design. Networks can no longer, in most cases, be designed with a fully interactive model expected for deployment and management. Designs now are focused on having software interact with the underlying infrastructure. This change in focus shifts how we then structure configuration. Compression of configuration stanzas doesn’t supply inherit benefits in a mode of operation where software is used to deploy systems, detect anomalies, and make changes. Configuration structures that lend themselves to logic patterns that can interact with systems play an increasingly critical role in modern designs.
Scale and complexity are not the only reasons for the shift in how we build and manage networks and supporting systems. Modern expectations on service delivery now demand that new functions be deployed into the network at an accelerated rate. We need to deploy, fix, and alter the network at rates that just cannot be achieved by a user manually interacting with a system. Software is used to achieve fast and efficient interaction with the network. An additional byproduct of this newer model, and one of the early drivers of automation, is deployment quality. Manual user interaction lends itself to errors and variation in how networks are configured. The focus on templates and configuration structures during the design phase allows for consistent configuration deployment and empirically has shown vast improvements in build quality (fewer errors).
The shift in how we build networks has also changed hiring needs and practices in many places. The shift to these modern build and management patterns is not consistent everywhere, and each industry segment will see the change at a different rate. However, the basic needs of a modern network designer and operator are not focused on jockeying a router but rather building and working with software that interacts with the system as a whole. As a hiring manager, it’s becoming increasingly hard to find multidomain expertise in network engineers who are also competent in software design and use. The software skills are becoming increasingly more important, and how far the pendulum shifts towards a pure developer is not yet known.
In terms of how to build for automation, there are many historical, and now modern, options. Years ago, we built scripts that would screen-scrape the CLI and apply configuration as needed. Although this worked well, it was limiting in how it could be used, and it varied by vendor, making reuse of any automation difficult and onerous. Today, we have a strong movement toward more standardized ways to apply configuration to devices, and we have models we can use to represent intended configuration. NETCONF and YANG represent a pair of options to help achieve consistent and standard ways to build and apply configuration for network elements. Whether one chooses to use these methods and tools or chooses other options, they are needed, not for technological purity, but to achieve the business goal of automated network configuration and management. We need automation tools and protocols like this to help us achieve the goals of making networks bigger, changing them faster, and improving the consistency of how we deploy and change them.
Q&A with Russ White
Russ White began working with computers in the mid-1980s and computer networks in 1990. He has experience in designing, deploying, breaking, and troubleshooting large-scale networks, and he’s a strong communicator from the white board to the board room. Across that time, he has co-authored more than 40 software patents, participated in the development of several Internet standards, helped develop the CCDE and the CCAr, and has worked in Internet governance with the Internet Society. Russ has a background covering a broad spectrum of topics, including radio frequency engineering and graphic design, and is an active student of philosophy and culture.
Russ is a co-host at the Network Collective, serves on the Routing Area Directorate at the IETF, co-chairs the BABEL working group, serves on the Technical Services Council as a maintainer on the open source FR Routing project, and serves on the Linux Foundation (Networking) board. His most recent works are Computer Networking Problems and Solutions, The Art of Network Architecture, Navigating Network Complexity, and Intermediate System to Intermediate System LiveLesson.
Question:
Russ, you have been a renowned network architect for many years now. How have network architecture and network management been evolving? What are your biggest issues and how do you solve them?
Answer:
When I started in network engineering, the big problems were around managing multiprotocol networks and choosing the best set of protocols to cope with constrained resources. The networking world has changed in many ways, but interestingly enough, it hasn’t changed in many others. The multiprotocol problem has crept up the stack and become a virtualization problem, and the constrained resources problem has crept up the stack to become a virtualization problem (intentionally constraining resources, rather than managing constrained resources). Architecturally, the “holy grail” of networking has always been “the network that runs itself,” while the “holy grail” of network engineers has always been to be able to solve every problem with a bit of duct tape and a nerd knob, and never say “no” to a request, no matter how outlandish.
The solution is often to “throw network management at the problem,” in an attempt to make a very complex network very easy to run—often in the form of automation of simple and routine tasks. Network management, and network automation in particular, is at the intersection of various competing interests.
In the last few years, the seeds of a new way of looking at networks have been sown: rethinking the structure of networks, control planes, and the relationship between hardware and software. These seeds have led to an explosion of new ideas and concepts, including software-defined networks (SDNs), cloud-based systems, and even serverless systems. The most obvious result has been the decline of the command-line interface (CLI) as the normal way to interact with network devices, and a movement toward “native automation” forms of network management and control.
How will these things change network architecture, and with it, network automation?
To begin, the networking world will ultimately split into a larger part and a smaller one. The larger part will be composed of organizations that consider the network a cost center, or like the plumbing in their buildings. The network, and information technology in general, is necessary, but it is not treated as a source of advantage. This set of organizations will want simple-to-manage networks. These networks will be “rip and replace” affairs, purchased at some cost, but then replaced when they are no longer effective. The network itself will be seen as a “unit,” a “single thing,” or even a hidden component of a larger system. This is the world of both on- and off-premises cloud computing, for instance, or serverless. Here, the role of network automation is obvious—from reducing the time spent in day-to-day management, to standing up new networks as quickly as possible. The network needs to be automated to become essentially invisible.
The smaller part will consist of companies that find enough value in information—as information—to put at least some focus into the realm of managing that information in a way that provides some form of business advantage. These organizations will disaggregate their networks in many different ways, exploring different options for driving value and increasing their ROI. The network will be part of a larger system that is seen as a source of value, rather than as a source of costs. Rather than minimizing costs, the idea will be to maximize value. In these organizations, the point of network automation will be to make the network transparent in making the network visible, for the only way to drive value out of information is by handling information quickly and correctly, and the only way to handle information quickly and correctly is to measure how information is being handled in detail.
Whatever path an organization takes, network automation is going to interact with network architecture in more important and interesting ways than it has in the past. And in both cases, management and architecture interact in this way: Things that are simpler are easier to manage, and networks should be built as simple as possible, and not one bit simpler.
Summary
This chapter analyzed some of trends in the networking industry. The most relevant trend in this book is that everything that can be automated in networking must be automated, with the end goal of reducing the service deployment time and offering differentiated services compared to the competition. As a matter of fact, due to the ever-increasing frequency and the complexity of changes in networks, it has become humanly impossible deal with the CLI. Therefore, some operators rightly assert nowadays that if a feature cannot be automated, it does not exist. That has led to the development of APIs to monitor and configure the network elements directly—and thus the full automation story. One way to execute on this automation story points to DevOps, a software engineering practice that aims to unify the software development and software operations.
The SDN discussions introduced the concept of the separation of the control and data plane entities, with a focus on OpenFlow as the open standard for configuring the data plane. Throughout the years, the notion of SDN has been evolving. OpenFlow, as a fundamental packet-forwarding paradigm, was actually an enabler, one that reinforced the need for more and easier network programmability.
On top of this automation and programmability shift, there is a growing tendency in the industry to disaggregate the software from the hardware, starting with the data center operation. The end goal is to be able to assemble white boxes as unified hardware, with Linux as the operating system and specific applications for the different networking functions. With this trend, network and server engineers can now focus on more business-oriented tasks as opposed to simply network operation and maintenance. For example, they can now focus on the network function virtualization definitions and deployments, most likely in a cloud environment, following the elastic cloud “pay as you grow” principle.
This chapter stressed the need for data model–driven management several times, which builds on the idea of specifying the semantics, the syntax, the structure, and the constraints of management objects in models, regardless of whether the models are used for configuration, for monitoring operational data, or for telemetry, APIs are generated from those models via tooling. The limitations of the existing management practices were also reviewed in this chapter. First off, the CLI, which is not an API, then SNMP, which is not used for configuring, followed by NetFlow, which only focuses on flow records, and finally, syslog, which doesn’t have any consistent syntax and semantics.
The final part of the chapter illustrated the challenges of managing networks with different data models with a hypothetical NMS dealing with the basic “interface” concept. Those challenges reinforced the requirement that the worlds of software-defined networking and DevOps need clear APIs with well-known semantics and consistent syntax. In the end, automation via APIs is the only way to provide holistic, intent-based networking, where networks constantly learn and adapt, and is the proper foundation for machine learning.
References in This Chapter
This chapter is by no means a complete analysis of the trends in the industry, as the industry keeps evolving (faster and faster). Table 1-2 lists some documents you may find interesting to read.
Table 1-2 YANG-Related Documents for Further Reading
Topic |
Content |
|---|---|
http://tools.ietf.org/html/rfc3535 Operator requirements in terms of network management; still valid today |
|
http://tools.ietf.org/html/rfc3444 The difference between information models and data models |
|
https://www.simple-times.org/pub/simple-times/issues/9-1.html#introduction Andy Bierman, The Simple Times, Volume 9. |
Endnotes
1. https://www.itu.int/en/Pages/default.aspx
2. https://datatracker.ietf.org/wg/sfc/about/
3. http://expect.sourceforge.net/
4. https://sourceforge.net/projects/tcl/
5. https://www.sdxcentral.com/listings/stanford-clean-slate-program/
6. https://www.slideshare.net/martin_casado/sdn-abstractions
7. https://pypi.org/project/paramiko/
11. https://www.coursera.org/learn/interactive-python-1
13. https://www.youtube.com/watch?v=Xl3gAvCKN44
14. https://www.iana.org/assignments/ipfix/ipfix.xhtml
15. https://www.opennetworking.org/
16. https://en.wikipedia.org/wiki/OpenDaylight_Project
17. https://www.safaribooksonline.com/library/view/sdn-software-defined/9781449342425/
18. http://info.tail-f.com/hubfs/Whitepapers/Whitepaper_Tail-f%20VNF%20Management.pdf?submissionGuid=7ac7486e-124f-484c-8526-9b34dbdcbeb1
19. https://www.yangcatalog.org/
20. https://docs.oasis-open.org/tosca/TOSCA-Simple-Profile-YAML/v1.1/TOSCA-Simple-Profile-YAML-v1.1.html
21. https://www.python.org/dev/peps/pep-0008/
22. https://www.cisco.com/c/en/us/td/docs/ios-xml/ios/prog/configuration/166/b_166_programmability_cg/model_driven_telemetry.html
23. https://www.wsj.com/articles/SB10001424053111903480904576512250915629460?ns=prod/accounts-wsj
24. https://ris.utwente.nl/ws/portalfiles/portal/6962053/Editorial-vol9-num1.pdf
25. https://datatracker.ietf.org/wg/sming/about/
26. https://www.ietf.org/about/groups/iesg/
27. https://www.ietf.org/iesg/statement/writable-mib-module.html
28. https://datatracker.ietf.org/wg/ipfix/charter/
29. http://datatracker.ietf.org/wg/ipfix/documents/
30. http://datatracker.ietf.org/wg/psamp/charter/
31. http://datatracker.ietf.org/wg/psamp/documents/
33. https://www.omg.org/spec/UML/
34. https://www.iana.org/assignments/ipfix/ipfix.xhtml
35. https://datatracker.ietf.org/doc/rfc2865#section-5.5
36. https://datatracker.ietf.org/doc/draft-ietf-opsawg-tacacs/