
Chapter 11
Debugging Parallel Applications
What's in This Chapter?
Introducing the Intel Debugger and its workflow
Detecting data races
Observing the runtime behavior of a threaded program
This chapter shows how to use the parallel debugging features of the Intel Debugger on your parallel or threaded application. One of the biggest challenges in parallel programming is tracking down data races. In this chapter you use the debugger to detect data races as you debug.
Unlike the error-finding techniques presented in other chapters, with a debugger you can single-step into your code and examine your parallel applications to confirm that the program is running as you expect. You can, as it were, sit inside your program and observe what is happening around you.
Introduction to the Intel Debugger
You are probably reading this chapter because you are developing or debugging a parallel program. Compared to pure serial software, parallel programs introduce additional issues that can produce problems that are difficult to track down and debug. The most common error is a data race, where one thread tries to read data that is being written by another thread. Programmers solve data races by inserting synchronization primitives in the code so that only one thread at a time can access shared data. Adding these primitives may solve the data race issue, but could inadvertently introduce a deadlock, with both threads waiting for each other to release the shared resource.
In addition to the risk of introducing data races and deadlocks, making a program parallel could break its integrity, with the program no longer working as intended. The newly parallelized program needs to be correct, free from programming and algorithmic errors.
Debuggers help developers to solve such software issues in real time by following, examining, and modifying a program's runtime execution. Intel Parallel Studio XE has a debugger dedicated to debugging the parallel features of your program. The debugger has two variants:
- Intel Parallel Debugger Extension (PDE) — A Windows plug-in to Visual Studio
- Intel Debugger (IDB) — A Linux Eclipse-based standalone debugger
![]()
The debugger enables you to:
- Identify data races in Cilk, OpenMP, and native (WIN32 and POSIX) threaded programs.
- Investigate a program's parallel behavior, by checking that the parallelized version runs the same way as the serial version.
- Filter out data race events that are of no interest.
- Detect events from a defined “focus” region.
- Serialize a threaded region to compare serial and parallel execution.
- Display OpenMP tasks, locks and barriers, call stack, and task hierarchy.
- Display Cilk Plus call stacks (PDE-Windows only).
In addition, the IDB-Linux version, which is a fully featured symbolic debugger, helps programmers to:
- Debug programs.
- Disassemble and examine machine code and examine machine register values.
- Debug programs with shared libraries.
- Debug multithreaded applications.
This chapter concentrates on the parallel debugging features that are common to both PDE-Windows and IDB-Linux.
![]()
The Parallel Debugger Workflow
You can use the debugger in two ways:
- Curative — To fix errors and problems
- Preventative — To ensure a program runs as you expect
Figure 11.1 shows a suggested workflow for both approaches. You should fix parallel issues during run time, using a short, repetitive debug cycle, where very little time is spent between identifying and fixing problems.
Figure 11.1 Parallel Debugger workflow
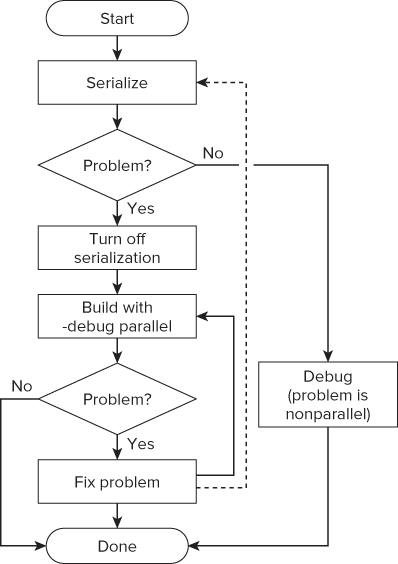
The starting point assumes you have seen some strange behavior in the parallel program you are developing, so you run the Intel Debugger to try to find the problem.
Usually, it is best to identify and fix one problem at a time before moving on to the next problem. (This is the approach taken in this chapter.) However, some developers prefer to identify a whole series of problems before fixing them.
The first step is to serialize the code by turning off the threading. Serialization is available only for Cilk and OpenMP code. If rerunning the program shows the problem still exists, you should debug the program in serial mode and fix it.
If serialization makes the problem disappear, the problem is caused by the parallelism in the code. You should turn off serialization, thus reenabling the parallelism, before continuing.
![]()
For each problem, use the debugger to pinpoint the source of the error, looking for data races or unexpected behavior. Each time you fix a problem, you should rebuild and test. If you prefer, after each error has been fixed, you can go back to the serialization stage (refer to the dotted line in Figure 11.1).
Using the Intel Debugger to Detect Data Races
Most of the activities in this chapter use the Tachyon ray-tracing application that ships with Composer XE. The Tachyon example is quite large — much bigger than a simple “hello world” program and more like a real-world example.
In ray tracing, the paths of light in an image are simulated, displaying the shadows and reflections that will occur. The example program draws a set of colored balls along with shadows. In the parallel version of the program, the picture has some blemishes caused by data races.
The program consists of a ray tracer in which a very busy loop calculates the value of each pixel. For the sake of simplicity, the main focus is on the parallelization of this loop, without discussing the rest of the program. The purpose is to improve execution performance.
You perform the following steps to detect the data races in the program:
Building the Serial Program
The Tachyon example consists of several projects:
- Build_serial — Nonparallel version of program
- Build_with_cilk — Uses Cilk Plus
- Build_with_openmp — OpenMP version
- Build_with_tbb — Uses Threading Building Blocks
- Tachyon.common — Shared between all other projects
You can build the serial version of the Tachyon program by completing Activity 11-1.
PDE-Windows
IDB-Linux
tar xvfz /opt/intel/composerxe/Samples/en_US/C++/tachyon.tar.gz ./
make build_serial_debug
./tachyon.serial dat/balls.dat &
Adding Parallelism
The sample code uses OpenMP to add parallelism. The solution is purposefully naïve; the intention is to show how to use the debugger, not how to write perfect parallel code.
Listing 11.1 is a modified version of the draw_task function from build_with_openmp.cpp. (You'll be using this listing in Activity 11-1.) The function draws the ray-traced picture on the screen. The #pragma omp parallel for statement causes the loop iterations to be shared among the available threads.
 Listing 11.1: The imperfectly parallelized code
static void draw_task (void)
{
  unsigned int serial = 1;
  int ison=1;
  unsigned int mboxsize = sizeof(unsigned int)*(max_objectid() + 20);
  unsigned int * local_mbox = (unsigned int *) alloca(mboxsize);
  memset(local_mbox,0,mboxsize);

  // Add parallelism - NOTE THIS WILL INTRODUCE DATA RACES!
  #pragma omp parallel for

  // each iteration will draw a raster
  for(int y = starty; y < stopy; y++) {
    if (ison) {
      drawing_area drawing(startx, totaly-y, stopx-startx, 1);

      // draw the individual line
       for (int x = startx; x < stopx; x++) {
        // work out the right color
        color_t c = render_one_pixel (x, y, local_mbox, serial,
                                        startx, stopx, starty, stopy);
        // draw the pixel
        drawing.put_pixel(c);
      }
      ison = video->next_frame();
    }
  }
}
code snippet Chapter1111-1.cpp
As the parallel program runs, each thread writes a series of rasters to the screen. The left-hand picture in Figure 11.2 shows the program running on a machine that has two 6-core CPUs with Simultaneous Multi Threading, giving support for 24 hardware threads. The snapshot was taken part way through the picture being drawn.
Figure 11.2 Noisy image generated by the parallel program
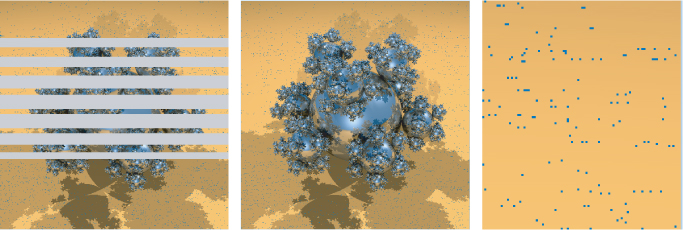
The middle picture in Figure 11.2 is complete. Although it looks almost right, a closer look shows that there is some “noise” in the resulting image. The right-hand picture enlarges the top corner of the middle picture. You can clearly see that the background is not very clean.
PDE-Windows
IDB-Linux
make build_openmp_debug
./tachyon.serial dat/balls.dat &
Using the preceding hypothetical case as a real-life debugger issue, you should next investigate the issue using the debugger. It is intuitive that many errors are introduced with the very rough parallelization code. Looking more closely at the picture, you can see that the differences with the neighbor pixels are really high. It's time to start a data-race analysis.
Observing the Results
Imagine that you have just received from your quality assurance team a defect report pointing out the noisy image and you are not sure what is causing the problem. It could be an incorrect implementation of the algorithm or a mistake in the parallelization of the algorithm. If the underlying algorithm is wrong, the defect should be observable, whether the code is running parallel or not. The first step is to run the code with parallelism turned off — that is, to serialize the application.
Serializing the Parallel Code
With the debugger you can serialize a parallel application at the click of the Serialize button. When working on Cilk code, the debugger stops the Cilk scheduler from stealing work; for OpenMP code, the debugger sets the number of threads available in a parallel region to one.
You can serialize a parallel application three different ways:
- By clicking the Serialize button on the debugger toolbar
- By selecting Debug ⇒ Intel Parallel Debugger Extension ⇒ Serialize Execution
- By using the commands (IDB-Linux only) idb set openmp-serialization on and idb set cilk-serialization on in the control window
Figure 11.3 shows the PDE-Windows toolbar with the sixth button from the left (the serialization button) pressed. The dark line around the icon indicates the serialization is active. The IDB-Linux also has a similar looking toolbar.
Figure 11.3 Parallel Debug Extension toolbar with the serialization button pressed
In the case of the Tachyon program, when you click the serialization button and the program is executed, the image is completely clean. This means two things: the program algorithm is okay, and problems exist with the parallel part of the code. Try out the serialization for yourself in Activity 11-3.
PDE-Windows
IDB-Linux
idb -args tachyon.with_openmp dat/balls.dat
Detecting Data Races
Once you suspect that your code contains data races, whether by seeing inconsistent results or any other reason, it is time to start a data sharing analysis.
Before conducting a data sharing analysis, you need to enable two features:
- Enable Parallel Debug Checks (in the compiler) — This option adds extra helper or instrumentation code to the application so that the debugger can handle the parallel code appropriately. It is important to apply this option to all code you are interested in. In the Tachyon example, the option should be applied to all the code; otherwise, there is a danger of missing some data races. Figure 11.4 shows enabling parallel debug checks in the compiler tab of the project properties page. This is equivalent to using the compiler option /debug::parallel (in Linux, use -debug parallel).
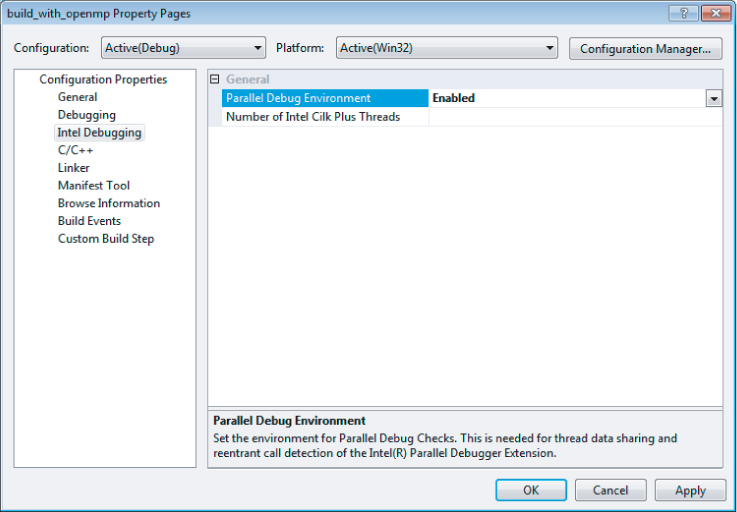
- Parallel Debug Environment (required only in PDE-Windows) — Figure 11.5 shows enabling the parallel debug environment in the project properties page.
Figure 11.4 Enabling parallel debug checks in the compiler
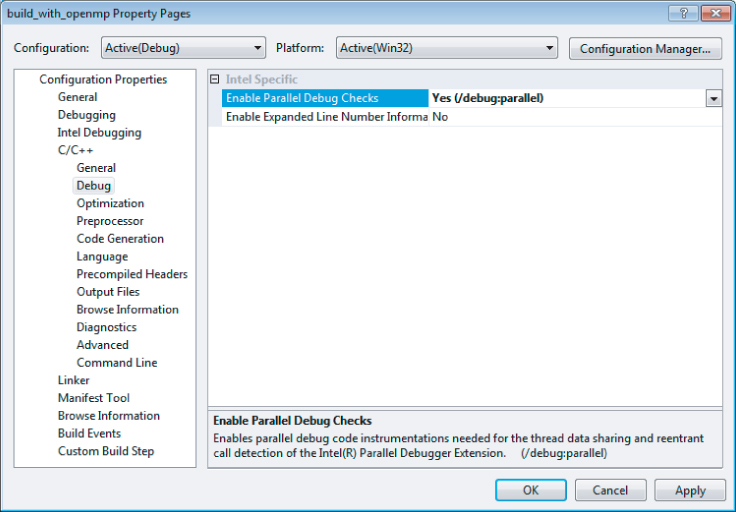
Figure 11.5 Enabling the parallel debug environment in Visual Studio
To start a data sharing analysis, follow these steps:
- PDE-Windows
- Single step: <F10>
- Run with debugging: <F5>
- IDB-Linux
- Single step: <F11>
- Run with debugging: <F5>
Figure 11.6 The toolbar's data sharing analysis button in the state of performing an analysis
When you execute code that involved a data race, the debugger presents a list of events, showing the operation (read/write), the code location or data involved, and the thread performing that operation (see Figure 11.7).
Figure 11.7 A list of data sharing events
After detecting an event, you need to examine the code to determine whether the problem is genuine or just a false positive. You may see that there is a data race but decide it is harmless. If you want to ignore an event, you can apply a filter to stop the event from appearing in the events list.
Using Filters
Filtering events is a very important step of the data sharing analysis. Filters enable you to find the source of the current issue and reduce the performance penalty caused by the analysis itself.
Filtering operates in two different modes:
- Suppression
- Suppression filters discard events.
- Suppression filters work by exclusion.
- Focus
- Focus filters home in on code or data ranges that you specify.
- Focus filters work by inclusion.
It's quite normal to use both kinds of filters in the same analysis session, swapping between filter sets as you narrow down a problem. The following examples use two different approaches to using the filters. In the first example, when an error is detected, you apply a suppression filter and then search for the next data race. The second example assumes that you have a good idea which part of the code is causing a problem. You then set up focus filters to home in on this area.
Using Suppression Filters to Discard Unwanted Events
The build_with_openmp program has several data races that have already been identified. Clicking the data sharing analysis button and starting a debug session results in the debugger stopping at the first data race event. The debugger displays the region of the code where the data race is located.
![]()
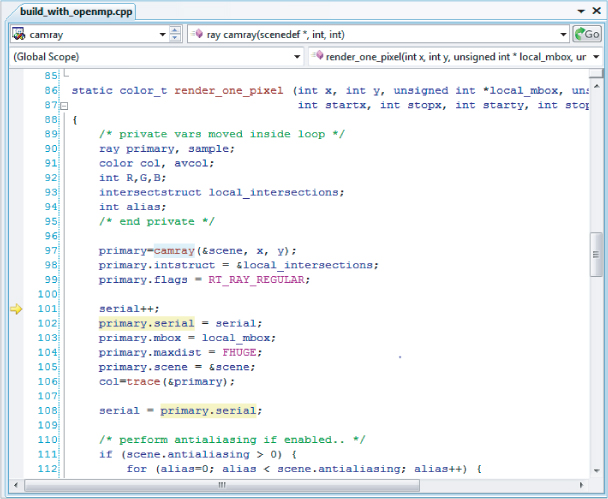
The debugger stops at the source location where a data sharing issue occurs (see Figure 11.8). The serial variable seems to be the source of the problem.
Figure 11.8 The source location where a data-sharing issue was detected
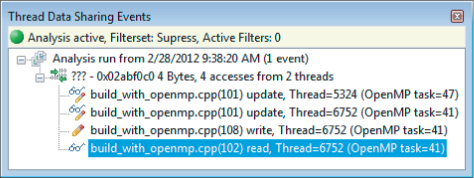
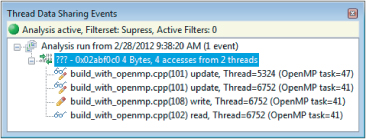
Three events are captured, as shown in Figure 11.9. Three threads are accessing the same serial variable. Two of them are trying to read from and write into the serial variable, and one is reading from it. Two threads are incrementing the serial variable at line 101, and one thread is reading serial at line 102 (primary.serial = serial).
Figure 11.9 The Thread Data Sharing Events window, displaying and logging the events that have been detected
After detecting an issue, you should investigate the origin of the variable and which other functions are using it. Looking at the call stack will help. The serial variable is instantiated in the draw_task function and is passed by reference to the render_one_pixel function.
The render_one_pixel routine is not a thread-safe routine because it alters the parameters passed to it. The serial variable is shared between all the threads and needs to be made thread safe (which you will do in Activity 11-5).
Creating the Filters
At this point you can use the debugger to:
- Try to solve the problem, recompile the program, and run the analysis again.
- Single-step a little further in the code to help your investigations. Here you are “stepping through” code causing the date race condition.
- Suppress this detection and look for the next error.
You might find it more interesting to take the second approach — that is, continue the investigation to get a more comprehensive overview of the damage caused by sharing variables.
To filter out issues coming from the serial variable, right-click one of the events in the Thread Data Sharing Events window and select Add Filter. The option Add Filter ⇒ To This Data Object suppresses all the events coming from the serial variable (see Figure 11.10). Once a filter has been created, it is listed in the Thread Data Sharing Filters window (see Figure 11.11).
Figure 11.10 Inserting a filter from the Thread Data Sharing Events window
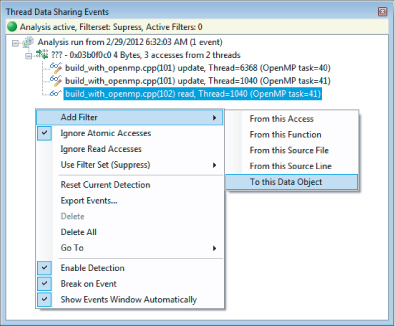
Figure 11.11 The suppression filters
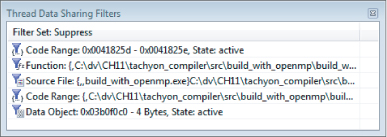
Once you have inserted the filter for serial, you can continue the debugging. You will see that most data races involve data passed by parameter from draw_task to each thread.
You will find that one of the data races deserves special mention. The mbox variable is an array (see Figure 11.12). After creating a filter for an array, you can adjust the range of the filter so that it spans the address space of the array. This means that any data race on any element of the mbox variable will be filtered.
PDE-Windows
IDB-Linux
export CXXFLAGS="-debug parallel"
make clean
make build_openmp_debug
idb -args tachyon.with_openmp dat/balls.dat &
Figure 11.12 A data race derived from the mbox variable
Fixing the Data Races
Having identified the data races, you now need to come up with a solution. Listing 11.2 gives one possibility. If you place the start of the parallel region using the #pragma omp parallel construct before the declaration of ison, serial, mboxsize, and local_mbox, each variable will become thread-local.
Listing 11.2: Fixing data races by moving the parallel region
static void draw_task (void)
{
  // Start a parallel region
  #pragma omp parallel
  {
    // each thread will have its own copy of these variables
    int ison              = 1;
    unsigned int serial   = 1;
    unsigned int mboxsize = sizeof(unsigned int)*(max_objectid() + 20);
    unsigned int * local_mbox = (unsigned int *) alloca(mboxsize);
    memset(local_mbox, 0, mboxsize);
     // workshare the loops between the threads
    #pragma omp for
    for(int y = starty; y < stopy; y++) {
      if (ison) {
        drawing_area drawing(startx, totaly-y, stopx-startx, 1);
        for (int x = startx; x < stopx; x++) {
          color_t c = render_one_pixel (x, y, local_mbox, serial, startx,
                                      stopx, starty, stopy);
          drawing.put_pixel(c);
        }
        ison = (video->next_frame()? 1 : 0);
      }
    }
  }
  return;
}
code snippet Chapter1111-2.cpp
After you recompile and rerun the application, the image should be completely clean. If you run a data sharing analysis again, you will still detect some issues. Those are mainly related to image display, and in practice are not relevant for the image generation, so they will not be resolved here.
PDE-Windows
IDB-Linux
export CXXFLAGS="-debug parallel"
make build_openmp_debug
./tachyon.with_openmp dat/balls.dat
Using the suppress filters presents a straightforward model of detecting and finding data races in the code. However, this mode has as a side effect: there will be a high performance penalty because every file is taking part in the data sharing detection. A more efficient way is to use focus filters.
Using Focus Filters to Examine a Selected Portion of Code
When working with more complex examples, focusing on a specific region may be a more efficient way of working. In the suppression mode, data race detection is applied to every file that has been instrumented with the Intel compiler. This can lead to a large number of events being generated that have to be examined. If you are working on a large project written by several developers, you may want to focus on just the code that you have written. You can do this in the debugger by setting it to focus mode.
To enable focus mode, choose Use Filter Set (Focus) ⇒ Focus in the Thread Data Sharing Events window (see Figure 11.13).
Figure 11.13 Setting the filter mode to focus

Before adding and creating any filters, you could modify the code example to fix some of the data races you are already aware of. In Listing 11.3, the serial and ison stack variables are declared to be firstprivate in the #pragma omp statement. By doing this, each thread gets its own initialized copy of those variables.
Listing 11.3: Image generated by the Tachyon example
// This code fixes some of the data races but not all of them!
// WARNING: THERE ARE STILL SOME DATARACES IN HERE
static void draw_task (void)
{
  unsigned int serial = 1;
  int ison=1;
  unsigned int mboxsize = sizeof(unsigned int)*(max_objectid() + 20);
  unsigned int * local_mbox = (unsigned int *) alloca(mboxsize);
  memset(local_mbox,0,mboxsize);

  // Each thread has its own initialized copy of serial and ison
  #pragma omp parallel for firstprivate(serial, ison)
  for(int y = starty; y < stopy; y++) {
    if(ison) {
      drawing_area drawing(startx, totaly-y, stopx-startx, 1);
      for (int x = startx; x < stopx; x++) {
        color_t c = render_one_pixel (x, y, local_mbox, serial,
                                   startx, stopx, starty, stopy);
        drawing.put_pixel(c);
      }
      ison = video->next_frame();
    }
  }
  return;
}
code snippet Chapter1111-3.cpp
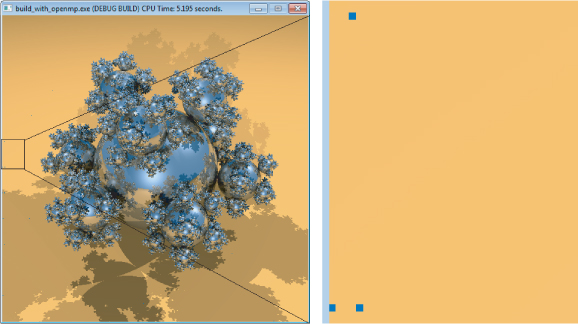
Note that running the program now produces a near perfect image. However, if you enlarge the image, you will see that some pixels still have the wrong color, as shown in Figure 11.14.
Figure 11.14 A close examination shows some pixels are wrong
Creating the Filters
Before running the data sharing analysis, you have to define the region that you are interested in. For the purpose of this exercise, the local_mbox stack variable was not declared to be firstprivate, so all the threads are still sharing it. Any half-decent programmer would have already fixed this by now, but it was ignored; so, a data sharing error still exists.
Before inserting any kind of filter, you should identify the chain of functions that make use of local_mbox. The variable is first used in the render_one_pixel function, which, in turn, passes a reference to the trace, intersect_object, and grid_intersect functions.
To insert a filter:
After doing this for each of the trace, intersect_object, grid_intersect, and render_one_pixel functions, the window will look similar to Figure 11.15.
Figure 11.15 The Thread Data Sharing Filters window
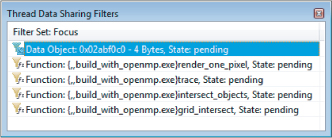
When the filters are first created, their state will be marked as pending. Once you start a debug session, the state of the filters will change to active.
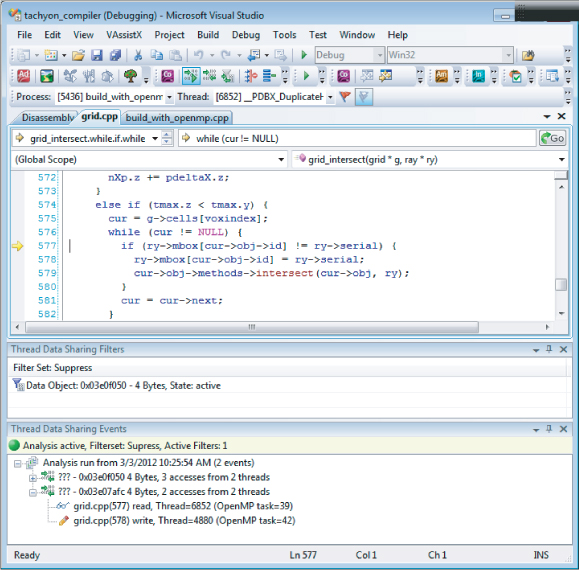
After enabling the data-race analysis and debugging, the first problem detected is in the grid_intersect function in grid.cpp. The variable ry->mbox is originally derived from the previously mentioned local_box stack variable:
static void grid_intersect(grid * g, ray * ry)
{
  // .
  // code omitted
  // .

  while (1) {
    if (tmax.x < tmax.y && tmax.x < tmax.z) {
      cur = g->cells[voxindex];
        // iterate through a linked list
        while (cur != NULL) {
        if (ry->mbox[cur->obj->id] != ry->serial) {
         // THIS CODE CAUSES A DATA RACE!
         ry->mbox[cur->obj->id] = ry->serial;
          cur->obj->methods->intersect(cur->obj, ry);
        }
        // go to next link in the list
        cur = cur->next;
      }
  // .
  // code omitted
  // .
  }
}
PDE-Windows
{,,build_with_openmp.exe}trace
{,,build_with_openmp.exe}intersect_objects
{,,build_with_openmp.exe}grid_intersect
IDB-Linux
export CXXFLAGS="-debug parallel"
make build_openmp_debug
{,,build_with_openmp.exe}trace
{,,build_with_openmp.exe}intersect_objects
{,,build_with_openmp.exe}grid_intersect
Correcting the mbox Data Race
At this point you must decide where to perform the fix — either on the parallelized loop or in the function where the problem was detected.
One way to fix the error would be to insert a #pragma critical statement immediately before the data race. The shared variable is used twice, so adding a local variable called localID will work:
#pragma critical
int localID = cur->obj->id;
   if (ry->mbox[localID] != ry->serial) {
          ry->mbox[localID] = ry->serial;
The code is now thread safe, but inserting the critical section in the code introduces a performance penalty because only one thread can access this code at any time; all the other threads have to wait. A much better solution is to create an independent buffer for every thread. Listing 11.4 does exactly this.
The code in Listing 11.4 defines a new ParameterForRendering class, with member items _ison, _serial, _mboxsize, and _local_mbox being used to replace the original stack variables. The initialization code for _local_mbox is moved from its original place into the constructor ParameterForRendering(unsigned int box_size).
The ParameterForRendering (const ParameterForRendering &input) copy constructor is also implemented because the compiler will implicitly call it in the firstprivate clause.
The original stack variables are replaced with an instantiation of the ParameterForRendering pars(mboxsize) object. In turn, this is declared to be firstprivate in the #pragma omp for loop, creating an object for every thread.
A schedule (dynamic) scheduling clause is added to the OpenMP loop. When you run the code with this scheduling loop, you will see that each raster is drawn in equal time. In the original program some rasters were completed much earlier than others.
Listing 11.4: Using an object to pass the parameters
// A new class used to hold the former stack variables
class ParameterForRendering {
public:
  int           _ison;
  unsigned int  _serial;
  unsigned int  _mboxsize;
  unsigned int *_local_mbox;
public:
  // constructor
  ParameterForRendering(unsigned int box_size) :
    _ison(1),
    _serial(1),
    _mboxsize(box_size),
    _local_mbox(NULL) {
      _local_mbox = (unsigned int *) malloc(_mboxsize);
      memset(_local_mbox, 0, _mboxsize);
    }

  // copy constructor
  ParameterForRendering(const ParameterForRendering &input) :
    _ison(input._ison),
    _serial(input._serial),
    _mboxsize(input._mboxsize),
    _local_mbox(NULL) {
      _local_mbox = (unsigned int *) malloc(_mboxsize);
      memset(_local_mbox, 0, _mboxsize);
    }
  // destructor
  ∼ParameterForRendering() {
    free (_local_mbox);
  }
};

static void draw_task (void)
{
  unsigned int mboxsize = sizeof(unsigned int)*(max_objectid() + 20);

  // instantiate class object
  ParameterForRendering pars(mboxsize);

  // share loop iterations between threads
  // each thread gets its own initialized copy of ‘pars’
  #pragma omp parallel for firstprivate (pars) schedule (dynamic)
  for(int y = starty; y < stopy; y++) {
    if (pars._ison) {
      drawing_area drawing(startx, totaly-y, stopx-startx, 1);
       for (int x = startx; x < stopx; x++) {
        color_t c = render_one_pixel (x, y, pars._local_mbox, pars._serial,
                        startx, stopx, starty, stopy);
        drawing.put_pixel(c);
      }
      pars._ison = (video->next_frame()? 1 : 0);
    }
  }
  return;
}
code snippet Chapter1111-4.cpp
After you implement the preceding modifications, the image is generated without any defect. You can try this for yourself in Activity 11-7. An interesting task is to compare the performance of this solution against a version that uses a critical section.
Data race issues still exist in the display routines, but they are not addressed here.
PDE-Windows
IDB-Linux
More About Filters
Filters are an important part of the debugger. They help you to determine where and what to investigate when analyzing data races in your code. As you have already seen, two different kinds of filters exist: suppress filters and the focus filters. You don't have to apply the filters to all your code; you can instead apply the filters to a specific range within your code. Table 11.1 shows how to apply the filters to different ranges.
Table 11.1 Specifying the Filter Range
| Range | Purpose | Input |
| Entire function | Used when you are not interested/interested in the detections coming from a specific function. | {function,[source],[module] } |
| Entire source file | Used when you are not interested/interested in the detections coming from a specific source file. | {,source,[module] } |
| Address range | Used to filter (out/in) the complete address range of a translation unit. It can be set by line range or address range. | {,source,[module] }@line |
| Data range/Filter | Used to filter (out/in) events coming from any specific data. | Symbol name or address. If you reference arrays, you must also state their size. |
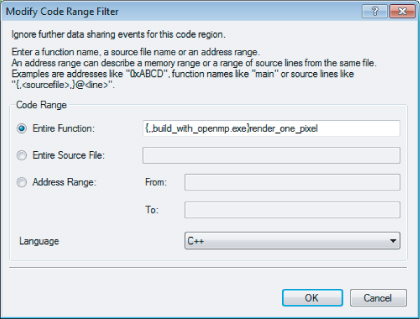
You can insert filters in two ways: either straight from an event in the Thread Data Sharing Events window or by right-clicking the Thread Data Sharing Filters window. After inserting a filter, you can modify its properties in a dialog box (see Figures 11.16 and 11.17), which you can reach by right-clicking the filter name in the Thread Sharing Filters Window.
Figure 11.16 The Modify Data Range Filter dialog
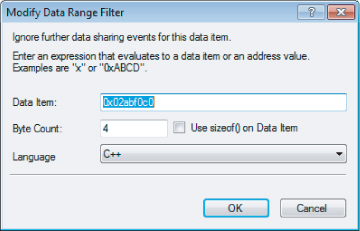
Figure 11.17 The Modify Code Range Filter dialog
Runtime Investigation: Viewing the State of Your Application
As shown in Table 11.2, the debugger offers several specialized windows to help you investigate the current state of your application and its threads.
Table 11.2 Intel Debugger Windows
| Window | Description | Model |
| Tasks | Displays the state of a task, the parent task, and the number of spawned tasks. | OpenMP |
| Spawn Tree | Displays a tree of spawned tasks; tasks that have not spawned anything are shown as leaf nodes. | OpenMP |
| Locks | Displays the state a lock, the type of lock, the number of threads holding the lock, and references to the lock. | OpenMP |
| Barriers | Displays the state of a barrier, the number of threads that have reached the barrier, and the location of the barrier. | OpenMP |
| Teams | Displays the team of threads that supports a parallel region. | OpenMP |
| Taskwaits | Displays the state of a taskwait, the number of tasks the taskwait is waiting for, and the location of the taskwait. | OpenMP |
| Cilk Thread Stack | Displays a call stack of worker threads. | Cilk Plus |
The OpenMP windows give information about the team hierarchy and the relationship between tasks and source code. This will help you to identify what code the thread is executing.
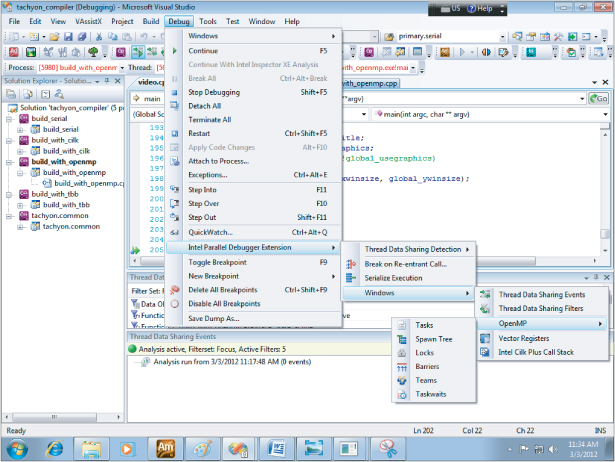
You can access the OpenMP windows either by clicking the corresponding buttons on the toolbar (see Figure 11.18) or by selecting Debug ⇒ Intel Parallel Debugger Extension ⇒ Windows ⇒ OpenMP ⇒ [window] (see Figure 11.19).
Figure 11.18 The OpenMP windows toolbar
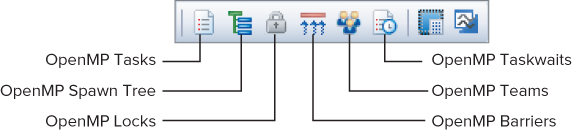
Figure 11.19 Accessing the OpenMP window from the menu
Using the OpenMP Tasks Window to Investigate Variables Within a Parallel Region
Using the Tachyon solution in Listing 11.3, you can use the OpenMP windows to investigate what happened to the variables created inside of the #pragma omp parallel region. However, at first, it doesn't appear obvious how to find out what code (and thread) a particular OpenMP task has used.
You can use the information from the Tasks window and the Spawn Tree window to associate a parallel task to a specific thread. You can then examine the call stack for that thread (and the local variables) all the way back to the point where the thread was first created within the parallel region.
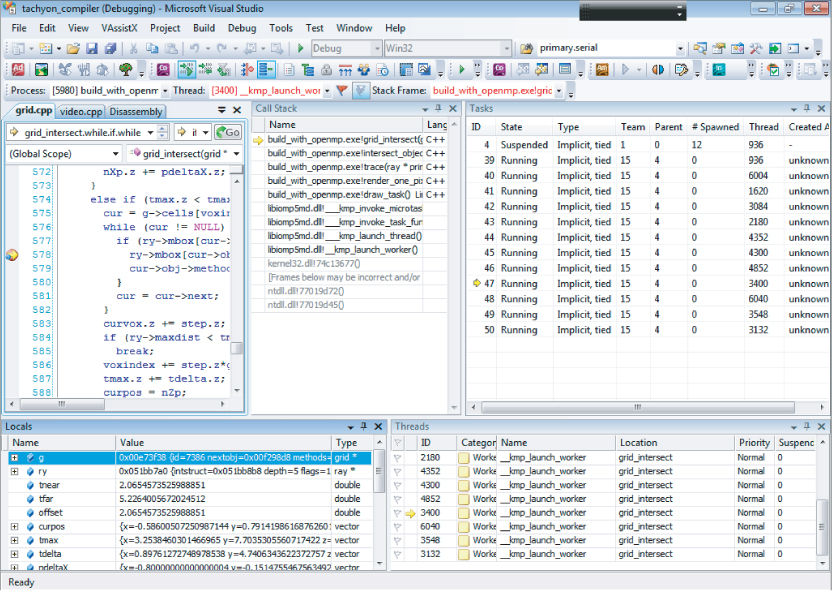
Figure 11.20 shows the windows needed to map the OpenMP task to the correct call stack. You can examine the contents of an OpenMP task's call stack as follows:
Figure 11.20 Examining the OpenMP task states
Using the OpenMP Spawn Tree Window to View the Behavior of Parallel Code
You can use the OpenMP Spawn Tree window to confirm that your OpenMP parallelism is working as intended. For example, consider the Fibonacci number calculator. Fibonacci numbers are integer numbers that follow the sequence 0, 1, 1, 2, 3, 5, 8, 13, and so on. Each Fibonacci number is the sum of the previous two numbers in the sequence. The first two numbers in the sequence are always 0 and 1. Listing 11.5 contains a parallel version. The bolded code makes the program parallel. If you delete that code, you will end up with the original serial version.
Listing 11.5: Simple implementation of a Fibonacci calculator
// This code has an ERROR in it which will cause a SEGMENTATION fault!
#include <stdio.h>
long long int fibonacci(int n) {
  if (n > 1) {
    long long int r_1, r_2;
    // create a task to calculate the n-1 number
    #pragma omp task  default(none) shared(r_1,n)
    {
      // recursive call
      r_1 = fibonacci(n - 1);
    }
    // create a task to calculate the n-2 number
    #pragma omp task  default(none) shared(r_2,n)
    {
      // recursive call
      r_2 = fibonacci(n - 2);
    }
    return r_1 + r_2;
  } else {
    // exit point for the recursion
    // this seeds the first two numbers in the sequence
    // ie 0 and 1
    if (n==0) return 0;
    return 1;
  }
}

int main()
{
  int i = 50;
  long long int t  =0 ;
  // create a parallel region
  #pragma omp parallel
  {
    // run as a single thread
    #pragma omp single
   // calculate the 50th number in the fibonacci sequence
   t = fibonacci(i);
  }
  printf("%d
",t);
  return 0;
}
code snippet Chapter1111-5.cpp
Two independent OpenMP tasks are used to add parallelism to the fibonacci function. The first task calculates fibonacci(n-1), and the second calculates fibonacci(n-2). This should generate a tree of spawned tasks, branching twice for every execution of the fibonacci function.
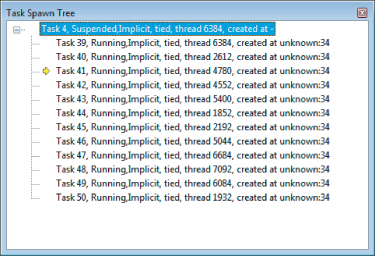
If you compile and execute the code, a segmentation fault occurs. Figure 11.21 shows the OpenMP spawn tree at the point the fault happens. Although you can see that two tasks are spawned from task 55, a strange pattern is displayed that does not match the expected behavior for the task hierarchy.
Figure 11.21 The spawning tree for the wrong parallelization suggested for the Fibonacci example
The cause of the problem is a missing taskwait clause (see the bold code in Listing 11.6). This missing statement causes each task to overlap, corrupting the stack and causing a segmentation fault and chaos on the spawned tree. Inserting a #pragma omp taskwait statement before the return statement in the fibonacci function should eliminate this effect. With this addition, both tasks run to completion.
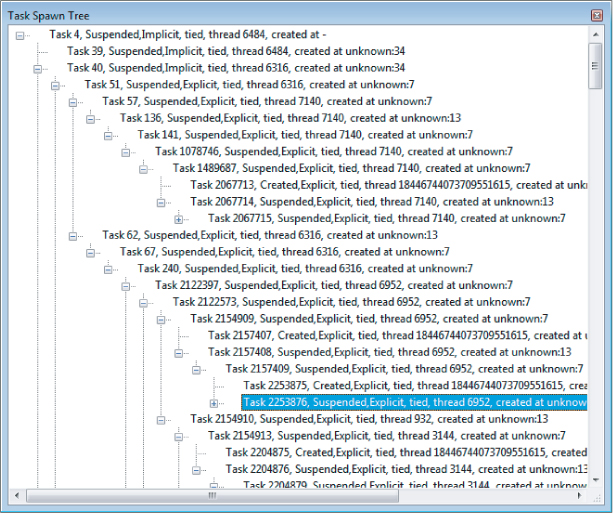
Listing 11.6 shows the modified code with the taskwait clause, and Figure 11.22 shows the spawn tree of the corrected code.
Listing 11.6: Right parallelization for the Fibonacci example
#include <stdio.h>
long long int fibonacci(int n) {
  if (n > 1) {
    long long int r_1, r_2;

    // create a task to calculate the n-1 number
    #pragma omp task  default(none) shared(r_1,n)
    {
      r_1 = fibonacci(n - 1);
    }

    // create a task to calculate the n-2 number
    #pragma omp task  default(none) shared(r_2,n)
    {
      r_2 = fibonacci(n - 2);
    }
     // wait here until both tasks have finished running.
     #pragma omp taskwait

    return r_1 + r_2;
  } else {
    // exit point for the recursion
    // this seeds the first two numbers in the sequence
    if (n==0) return 0;
    return 1;
  }
}

int main()
{
  int i = 50;
  long long int t  =0 ;
  // create a parallel region
  #pragma omp parallel
  {
    // run as a single thread
    #pragma omp single
   // calculate the 50th number in the fibonacci sequence
    t = fibonacci(i);
  }
  printf("%d
",t);
  return 0;
}
code snippet Chapter1111-6.c
Figure 11.22 The spawn tree after the correction of the parallel Fibonacci example
Summary
Viewing a parallel program while it is running is a very different experience from error-detection techniques described in other chapters. Finding data races and observing program behavior becomes a dynamic process rather than a batch-driven process.
Using the Intel Debugger to detect data races brings a new level of visibility and confidence when debugging. In this chapter you used the debugger to fix data races in the Tachyon ray-tracing program, and corrected the execution order in a Fibonacci calculator. You can see another example of using the debugger in Chapter 14, “Nine Tips to Parallel-Programming Heaven,” where you use it to detect data races in a Cilk Plus program.
Chapter 12, “Event-Based Analysis with VTune Amplifier XE,” shows how to use Amplifier XE to see how well your program is using the CPU architecture.