
Chapter 1
Parallelism Today
What's in This Chapter?
How parallelism arrived and why parallel programming is feared
Different parallel models that you can use, along with some potential pitfalls this new type of programming introduces
How to predict the behavior of parallel programs
The introduction of multi-core processors brings a new set of challenges for the programmer. After a brief discussion on the power density race, this chapter looks at the top six parallel programming challenges. Finally, the chapter presents a number of different programming models that you can use to add parallelism to your code.
The Arrival of Parallelism
Parallelism is not new; indeed, parallel computer architectures were available in the 1950s. What is new is that parallelism is ubiquitous, available to everyone, and now in every computer.
The Power Density Race
Over the recent decades, computer CPUs have become faster and more powerful; the clock speed of CPUs doubled almost every 18 months. This rise in speed led to a dramatic rise in the power density. Figure 1.1 shows the power density of different generations of processors. Power density is a measure of how much heat is generated by the CPU, and is usually dissipated by a heat sink and cooling system. If the trend of the 1990s were to continue into the twenty-first century, the heat needing to be dissipated would be comparable to that of the surface of the sun — we would be at meltdown! A tongue-in-cheek cartoon competition appeared on an x86 user-forum website in the early 1990s. The challenge was to design an alternative use of the Intel Pentium Processor. The winner suggested a high-tech oven hot plate design using four CPUs side-by-side.
Figure 1.1 The power density race

Increasing CPU clock speed to get better software performance is well established. Computer game players use overclocking to get their games running faster. Overclocking involves increasing the CPU clock speed so that instructions are executed faster. Processors often are run at speeds above what the manufacturer specifies. One downside to overclocking is that it produces extra heat, which needs dissipating. Increasing the speed of a CPU by just a fraction can result in a chip that runs much hotter. So, for example, increasing a CPU clock speed by just over 20 percent causes the power consumption to be almost doubled.
Increasing clock speed was an important tool for the silicon manufacturer. Many of the performance claims and marketing messages were based purely on the clock speed. Intel and AMD typically were leapfrogging over each other to produce faster and faster chips — all of great benefit to the computer user. Eventually, as the physical limitations of the silicon were reached, further increases in CPU speed gave diminishing returns.
Even though the speed of the CPU is no longer growing rapidly, the number of transistors used in CPU design is still growing, with the new transistors used to supply added functionality and performance. Most of the recent performance gains in CPUs are because of improved connections to external memory, improved transistor design, extra parallel execution units, wider data registers and buses, and placing multiple cores on one die. The 3D-transistor, announced in May 2011, which exhibits reduced current leakage and improved switching times while lowering power consumption, will contribute to future microarchitecture improvements.
The Emergence of Multi-Core and Many-Core Computing
Hidden in the power density race is the secret to why multi-core CPUs have become today's solution to the limits on performance.
Rather than overclocking a CPU, if it were underclocked by 20 percent, the power consumption would be almost half the original value. By putting two of these underclocked CPUs on the same die, you get a total performance improvement of more than 70 percent, with a power consumption being about the same as the original single-core processor. The first multi-core devices consisted of two underclocked CPUs on the same chip. Reducing power consumption is one of the key ingredients to the successful design of multi-core devices.
Gordon E. Moore observed that the number of transistors that can be placed on integrated circuits doubles about every two years — famously referred to as Moore's Law. Today, those transistors are being used to add additional cores. The current trend is that the number of cores in a CPU is doubling about every 18 months. Future devices are likely to have dozens of cores and are referred to as being many-core.
It is already possible to buy a regular PC machine that supports many hardware threads. For example, the workstation used to test some of the example programs in this book can support 24 parallel execution paths by having:
- A two-socket motherboard
- Six-core XEON CPUs
- Hyper-threading, in which some of the internal electronics of the core are duplicated to double the amount of hardware threads that can be supported
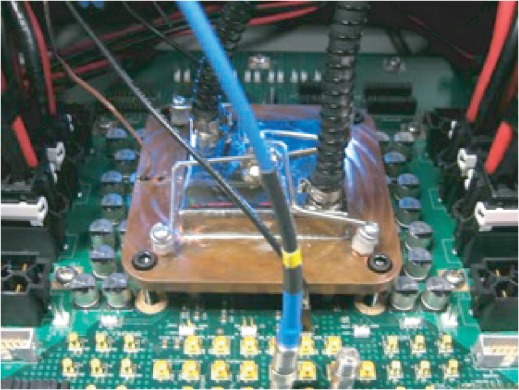
One of Intel's first many-core devices was the Intel Teraflop Research Chip. The processor, which came out of the Intel research facilities, had 80 cores and could do one teraflop, which is one trillion floating-point calculations per second. In 2007, this device was demonstrated to the public. As shown in Figure 1.2, the heat sink is quite small — an indication that despite its huge processing capability, it is energy efficient.
Figure 1.2 The 80-core Teraflop Research Chip
There is the huge difference in power consumption between the lower and higher clock speeds; Table 1.1 provides sample values. With a one-teraflop performance (1 ∞ 1012 floating-point calculations per second), 62 watts of power is used; to get 1.81 teraflops of performance, the power consumption is four times larger.
Table 1.1 Power-to-Performance Relationship of the Teraflop Research Chip
| Speed (GHz) | Power (Watts) | Performance (Teraflops) |
| 3.16 | 62 | 1.01 |
| 5.1 | 175 | 1.63 |
| 5.7 | 265 | 1.81 |
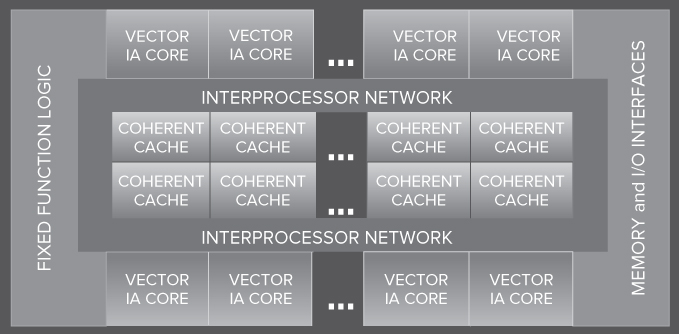
The Intel Many Integrated Core Architecture (MIC) captures the essentials of Intel's current many-core strategy (see Figure 1.3). Each of the cores is connected together on an internal network. A 32-core preproduction version of such devices is already available.
Figure 1.3 Intel's many-core architecture
Many programmers are still operating with a single-core computing mind-set and have not taken up the opportunities that multi-core programming brings.
For some programmers, the divide between what is available in hardware and what the software is doing is closing; for others, the gap is getting bigger.
Adding parallelism to programs requires new skills, knowledge, and the appropriate software development tools. This book introduces Intel Parallel Studio XE, a software suite that helps the CC++ and Fortran programmer to transition from serial programmer to parallel programmer. Parallel Studio XE is designed to help the programmer in all phases of the development of parallel code.
The challenge (and opportunity) for the developer is knowing how to reap the rewards of improved performance through parallelism.
The Top Six Challenges
In a recent open forum in Nice, France, a group of software programmers and project managers were asked, “What's stopping you adopting parallelism?” Many reasons were cited, but when the comments were collated, a picture began to emerge of a number of commonly held reasons.
Those who took part in this exercise were from some of the key players in the software industry in Europe, representing both well-established software houses and newer high-tech startup companies. The views they expressed were founded on commercial and technical concerns — both rational and irrational.
This book aims to show some practical parallel programming techniques you can use to address some of these challenges.
Legacy Code
Adding parallelism to existing code does not sound that unusual. It is common for a programmer to start off with serial code and incrementally introduce parallelism. In fact, the method described in this book focuses on how to analyze serial programs, find out the best place for introducing parallelism, and then debug and tune the parallel application.
Some developers spoke of having several million lines of code to maintain. Some of the code was 30 or 40 years old, with the original designers no longer working with the company. With such a large code base, it is not always easy to understand how the code works. The style of old code does not always lend itself to easy partitioning for parallelization. Concepts of information hiding, modularization, and other standard software engineering practices are not always present in legacy code.
Several years ago, while visiting a large telecom company, I found the following comment in some C code: “If anyone knows what this code does, ring me on extension 1234.” The code was startup code for a hand-rolled operating system and was part of a large monolithic code base, written 20 or so years earlier. Understanding legacy code is not a new problem that has just reared its head. When adding parallelism to legacy code, it is important that the legacy code is well understood.
![]()
Tools
Almost all the developers at the Nice conference expressed a desire to have better tools for creating and debugging parallel code. An ideal scenario was to have tools that just did all the parallelism automatically, but most of those present at the forum recognized that this sort of solution was not on the near horizon.
Tools should make implementing parallelism easier, not harder. They should integrate seamlessly into the current developer's environment to support both interactive and script-driven development.
Programmers need good thread-aware tools for debugging parallel applications. Using printf() to debug a serial application is fairly common; indeed, some developers do all their debugging using printf(), claiming it is much easier than using a debugger. However, when debugging a parallel program, using just printf() is impractical. At times it is necessary to be able to debug each thread in a program, to examine the contents of each stack, and to single-step or break in specific threads.
Education
The conference delegates were concerned about educating two different groups of people: programmers and customers.
Several of those present said that their companies had one parallel specialist. Whenever any parallelism was to be introduced into the code, the job was passed to the specialist. This kind of programming is perceived as a niche topic and difficult for the general programmer to achieve.
Some participants felt that customers needed to be educated about parallelism. The purpose was to set expectations. Developers feared that end users would expect unachievable performance improvements when moving to multi-core machines.
Fear of Many-Core Computing
Programming for two or four cores seems within the scope of most projects, but programming for 80 cores looks daunting. Making sure that programs written for today's multi-core machines will run on the many-core machines of the future is perceived to be a difficult task.
This concern has two aspects. First, being concerned about the number of cores probably indicates that there needs to be a change in the thinking of the developers. As in object-oriented programming, the concepts of information hiding and data encapsulation are central; so, in today's parallel programming practices, programmers should not be concerned with how many cores are available. When programming in parallel, the question “How many cores are there?” should not be asked.
The second aspect of this fear is the question of scalability. If a program runs well on 4 cores, is it possible to check if it will also run well on a 24-core machine? Will there be a corresponding speedup when moving to an architecture that has more cores?
Maintainability
Programmers want code that is easy to maintain. For some, the first thing they want is to avoid putting low-level, machine-specific code in their programs. The parallelism should be expressed with high-level abstractions that remain relevant across different generations of the project. Other developers look for help in tracking correctness and debugging applications.
Parallel Studio provides high-level parallel language support that makes code easier to understand and debug. Amplifier, Inspector, and the Parallel Debugger Extension help to maintain the code under development. The command-line versions of Amplifier and Inspector are ideal tools to add to regression testing. The ability to compare the results of different runs of these tools helps to spot potential problems.
Return on Investment
Some of the programmers were afraid the effort spent parallelizing a program would not pay off. Would the effort result in code that performs better? Would a parallelized program lead to increased sales of the product? Would it not be better just buying a faster machine?
You can use Parallel Studio to find which part of the code is the best place to optimize. You can then use this information to work out whether the likely effort will be considerable or easy.
Parallel Studio can help determine the performance benefit of adding parallelism. With Parallel Advisor, you can model parallelism in your code before implementing it, asking questions such as “What speedup will I achieve?” and “How scalable is my program?”
Parallelism and the Programmer
Today there is no “silver bullet” that will automatically make a serial program parallel. As a programmer, you have to make choices about what kind of parallelism you will use and in which programming language models you will implement the parallelism.
Types of Parallelism
You can achieve parallelism in a number of ways, including:
- Distributed parallelism — Complete applications are farmed out to different nodes in a cluster of computers. The Message Passing Interface (MPI), a send/receive message-passing protocol, is used to distribute and manage the applications.
- Virtualization — This technique involves running several operating systems on one CPU. Virtualization is often supported directly by the CPU. For example, a 2-core machine could host two virtual machines, one on each core. Each virtual machine hosts its own operating system with dedicated resources such as I/O and memory. Some resources are shared. A hypervisor helps manage the virtual machines and resources.
- Task-level parallelism — The focus is on work or tasks rather than threads. There may be many more tasks than there are threads, with each task being scheduled by a runtime scheduler.
- Thread-level parallelism — This parallelism is implemented within a program, with each of the parallel parts running on separate threads. In a multi-core environment, each thread runs on a separate core.
- Instruction-level parallelism — Most CPUs have several execution units; instruction-level parallelism is achieved by execution units executing in parallel. This is normally done automatically by the CPU, but it can be influenced by the layout of a program's code.
- Data-level parallelism — This parallelism relies on the CPU supporting single instruction, multiple data (SIMD) operations, such as can be found in the various Streaming SIMD Extensions (SSE). In this mode, one instruction operates on wide registers that could hold several variables. So, for example, it is possible to compute four 32-bit additions with one instruction, the results being held in a single 128-bit-wide register. The 2nd Generation Intel Core architecture supports Intel Advanced Vector Extensions (AVX), increases the register size to 256-bit wide registers, and introduces three operand instructions rather than the two operand instructions found in SSE2.
You can use all these types of parallelism together. In this book we use examples of task-, thread-, data-, and instruction-level parallelism.
Intel's Family of Parallel Models
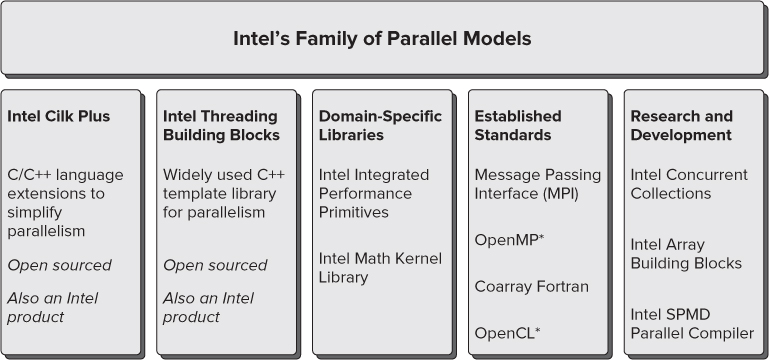
Intel's family of parallel models consists of Cilk Plus, Threading Building Blocks (TBB), domain-specific libraries, established standards, and some research and development products (see Figure 1.4).
Figure 1.4 Intel's family of parallel models
Cilk Plus and Threading Building Blocks
Cilk Plus and TBB are designed to work seamlessly together.
- Intel Cilk Plus is a C/C++ language extension that provides new keywords for describing parallelism and a new notation for performing parallel computations on arrays. The language extensions simplify task and vector parallelism and consist of keywords/reducers, array notations, elemental functions, and a new pragma, #pragma simd, which can be used to force the compiler to vectorize code. Using Cilk Plus is one of the easiest ways to make a program parallel.
- Intel Threading Building Blocks (TBB) is a C++ template library that provides tasks, parallel algorithms, and containers.
TBB is a library, whereas Cilk Plus is a set of C/C++ language extensions implemented in the Intel compiler.
Domain-Specific Libraries
All the functions in fixed-function libraries are thread-safe and can be used in parallel programs. Some functions are already threaded and can be used to add parallelism to a program.
- Intel Integrated Performance Primitives (IPP) is a large collection of functions spread across multiple domains, including cryptography, compression, signal processing, and multimedia.
- Intel Math Kernel Library (MKL) is a collection of math functions used by the high-performance computing (HPC) community. The library includes BLAS, LAPACK, ScalaPACK1, sparse solvers, fast Fourier transforms, and vector math functionality.
Established Standards
The following standards can be used to make programs parallel:
- Intel Message Passing Interface (MPI) is a well-established standard that uses a send/receive protocol for running programs in parallel on a cluster of workstations.
- Open Multi-Processing (OpenMP) is a pragma-based language extension for incrementally adding parallelism to C, C++, and Fortran code.
- Coarray Fortran is part of the Fortran 2008 standard and provides a standardized way of doing parallel processing in Fortran.
- Open Computing Language (OpenCL) is a standard for use on heterogeneous computing environments. The language is based on C99.
Research and Development
The following parallel models are experimental and to be used for research only — that is, not for producing a commercial product. They reside on the whatif.intel.com website.
- Intel Concurrent Collections (CnC) is a parallel programming model that enables programmers to write parallel programs without being concerned about the low-level detail. Based on C++, CnC is also available for use with Haskell.
- Intel Array Building Blocks (ArBB) is a library that provides data-centric parallelization for use on arrays. The run time involves a just-in-time (JIT) compiler.
- Intel SPMD Parallel Compiler is an open-source compiler for single program multiple data (SPMD) programs. At run time, multiple program instances execute in parallel on the CPU's SIMD execution units.
Choosing the Right Parallel Constructs
When writing parallel programs, it is not necessary to stick to one particular set of constructs; you can mix and match constructs. This is not a new phenomenon, but the idea of mixing and matching may be new to those who are not experienced in parallel programming. For some years the HPC community has been mixing OpenMP and MPI constructs; and Windows programmers quite often use the Win32 API InterlockedIncrement function rather than the #pragma omp critical construct within their OpenMP programs.
Parallel constructs have different levels of abstraction. Some constructs are concerned mainly with the manipulation of data, whereas other constructs are task-oriented (see Figure 1.5).
Figure 1.5 Different levels of abstraction
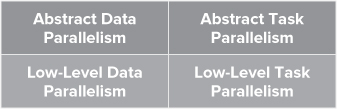
High-Level vs. Low-Level Constructs
The higher levels of abstractions are used to express intent and indicate to the parallel run time, or the compiler, the desire that some code should be parallelized. Using the highest levels of abstraction does not guarantee that code will operate in parallel; that decision is delegated to the run time.
The lower-level constructs exert more direct control over the parallelism. Using the lowest-level constructs can sometimes break the parallelism and require expert knowledge. For example, the careless use of locks in parallel code can lead to a situation in which the whole execution environment is stalled, unable to progress toward the completion of any task. Low-level constructs are often tied to specific core count and do not scale automatically in a many-core architecture.
Data Parallelism vs. General Parallelism
Data parallelism is concerned mainly with operations on arrays of data. Some types of data parallelism, such as SIMD, are supported directly in CPU hardware. Other techniques, such as the manipulation of arrays, are supported by library and language extensions. Data parallelism has a special significance in the era of the many-core computing, where huge numbers of cores are available on single-chip devices. Writing data-parallel code leads to code that is scalable and capable of benefiting on the trend toward increasing numbers of cores.
General parallelism is the execution of separate tasks in parallel. Nonnumeric code is usually implemented with task-parallel rather than data-parallel algorithms.
Examples of Mixing and Matching Parallel Constructs
The following two sections describe examples of mixing and matching parallel constructs. Intel's family of parallel models is intended to be used together, so mixing and matching the constructs is anticipated and supported in Parallel Studio.
Cilk Plus and TBB
The code in Listing 1.1 uses a TBB-scalable allocator in a cilk_for loop. Each iteration of the cilk_for loop dynamically allocates memory to the array of char pointers. The loop iterations are balanced among available workers and run in parallel.
 Listing 1.1: An example of using Cilk Plus and TBB
#include <stdio.h>
#include <time.h>
#include <cilk/cilk.h>
#include <stdlib.h>
#define MALLOC_SIZE 1
#define ARRAY_SIZE 10000000
#include "tbb/scalable_allocator.h"

char * array[ARRAY_SIZE];

int main(int argc, char* argv[])
{
  clock_t start, stop;

  // get the start time
  start = clock();

  // load balance scalable malloc between available workers
  cilk_for(int i = 0; i < ARRAY_SIZE; i++)
  {
    array[i] = (char *)scalable_malloc(MALLOC_SIZE);
  }

  // free the blocks of memory
  cilk_for(int i = 0; i < ARRAY_SIZE; i++)
  {
    scalable_free(array[i]);
  }

  // get the stop time
  stop = clock();

  // display the time taken
  printf("The time was %f seconds
",((double)(stop - start)/1000.0));
  return 0;
}
code snippet Chapter11-1.cpp
Using a scalable memory allocator on a two-core PC (Intel Mobile Core 2 Duo T7300), the code took 1.8 seconds to complete. When the normal malloc and free memory allocation functions were used, the code took 12.6 seconds to complete. The speedup was achieved by combining the Cilk Plus parallelism with the TBB scalable allocators together. The normal malloc function ensures thread-safeness by putting locks around some of its internal code. Locks make the code thread safe, but also slow down the code. The scalable_malloc function does not have locks, which means the parallel code runs much faster.
Cilk Keywords and Array Notations
Listing 1.2 shows an example of using different features of Cilk Plus. The code takes advantage of the parallelism provided by the CPU cores and the vector unit. The function declared in Lines 2 and 3 adds the two parameters x and y together and returns the new value. The _declspec(vector) keyword causes the compiler to generate short vector versions of the function ef_add. This elemental function is then applied to each element of the array in Lines 12, 18, and 24.
Listing 1.2: An example of using Cilk keywords and array notations
1: include <cilk/cilk.h>
2: _declspec (vector) double ef_add (double x, double y){
3:   return x + y;
4: }
5: int main()
6: {
7:   double a[5];
8:   double b[] = {1,2,3,4,5};
9:   double c[] = {6,7,8,9,10};
10:
11:  // apply function to whole array
12:  a[:] = ef_add(b[:],c[:]);
13:
14:  a[:] = 0;
15:  int n = 2;
16:  int s = 1;
17:  // apply function to a sub range
18:  a[0:n:s] = ef_add(b[0:n:s],c[0:n:s]);
19:
20:  a[:] = 0;
21:  // apply function in parallel
22:  cilk_for (int j = 0; j < n; ++j)
23:  {
24:    a[j] = ef_add(b[j],c[j]);
25:  }
26:}
code snippet Chapter11-2.cpp
Three arrays (a, b, and c), which are declared outside this code snippet, are arrays of doubles. The ef_add function is applied to array a in three different ways:
- To a whole array — Line 12 is an example of applying the function ef_add to complete arrays. Each element of array b is added to each element of array c, with the results written into each element of array a.
a[:] = ef_add(b[:],c[:]);
- To part of an array — Line 18 is an example of applying the function ef_add on part of an array. The calculation is applied on a subrange of the arrays, with n being the length of operation and s being the stride value:
a[0:n:s] = ef_add(b[0:n:s],c[0:n:s]);
- In parallel — Lines 22 to 25 present an example of loop-based parallelism. The cilk_for construct load-balances the loop iterations between the numbers of workers available. Lines 14 and 20 set all the values in the array a to zero.
 cilk_for (int j = 0; j < n; ++j)
 {
   a[j] = ef_add(b[j],c[j]);
 }
The code at Lines 12 and 18 results in the compiler generating serial code that calls the vector function. The example at Lines 22 to 25 produces parallel code that calls the vector function.
![]()
Parallel Programming Errors
Adding parallelism to code exposes developers to new categories of programming errors. Some errors can be spotted by doing a code inspection or by running the code through a static analysis tool, such as lint. Other errors are much more difficult to find and can be detected only at run time using a dynamic analysis tool. The following threading problems are the most prevalent.
Data Races
Data races are caused when two or more threads running in parallel access the same memory location, and at least one of them tries to write to that memory location without using any kind of synchronization mechanism.
You can avoid data races by:
- Making global data local to each task or thread.
- Demoting the scope of variables by using stack or automatic variables.
- Using atomic operations.
- As a last resort, using locks and mutexes to protect shared resources. Locks and mutexes are low-level synchronization primitives that effectively serialize the access to a shared resource.
The easiest way to detect data races is to use a correctness tool, such as Intel Parallel Inspector XE (see Chapter 8, “Checking for Errors”).
Determinacy Races
A determinacy race occurs when a program produces the right result only when the parallel parts execute in a particular order.
Imagine that you have a program that monitors the rise of temperature in a gas furnace:
Each step must be made in the right sequence; otherwise, the logic of the program will be broken. Making steps 1–3 run in parallel would be a mistake, because there would be no guarantee which step would run first.
A program can have a determinacy race even though it doesn't have a data race. Almost every data race is a determinacy race, but not vice versa.
Deadlocks
Deadlocks are caused when two threads are endlessly waiting for each other, neither progressing to completion. Consider the following two code examples. At first they seem to be identical; in fact, they are supposed to be identical. However, on closer inspection, you can see that the critical sections, L1 and L2, are used in a different order in the two code excerpts. The critical sections use Win32 synchronization objects that control access to the lines of code and act as gatekeepers.
The Win32 API calls EnterCriticalSection and LeaveCriticalSection to act as gatekeepers for the enclosed code. The code between these calls can execute only on one thread.
Walking through both sets of code shows the problem. Imagine a thread is executing this code:
DWORD WINAPI threadA(LPVOID arg)
{
  EnterCriticalSection(&L1);
    EnterCriticalSection(&L2);
      processA(data1, data2);
    LeaveCriticalSection(&L2);
  LeaveCriticalSection(&L1);
  return(0);
}
And at the same time a second thread is executing this code:
DWORD WINAPI threadB(LPVOID arg)
{
  EnterCriticalSection(&L2);
    EnterCriticalSection(&L1);
      processB(data2, data1) ;
    LeaveCriticalSection(&L1);
  LeaveCriticalSection(&L2);
  return(0);
}
When the first thread hits the line EnterCriticalSection(&L1), it claims the exclusive use of the code for itself, protected by the critical section object L1.
At the same time, when the second thread hits the line EnterCriticalSection(&L2), it claims the exclusive use of the code for itself, protected by the critical section object L2.
Now back to the first thread. It tries to execute the next line, EnterCriticalSection(&L2), but it has to wait because the critical section object L2 is already being used by the second thread.
Likewise, the second thread cannot execute the next line, EnterCriticalSection(&L1), because the critical section L1 is already being used by the first thread.
So, we have deadlock — the first thread is waiting for the second thread to release L2, and the second thread is waiting for the first thread to release L1.
Most deadlocks can be avoided by using a consistent order for acquiring locks. As with data races, the easiest way to detect deadlocks is to use a correctness tool, such as Intel Parallel Inspector XE.
Poor Load Balancing
Load balancing is the act of making sure all threads are working equally hard utilizing all available cores on the CPU. Ideally, all threads in a parallel program should do equal amounts of work — that is, the load is well balanced. Poor load balancing leads to some threads being idle and constitutes a wasted resource.
The most common cause of poor load balancing is having too coarse a granularity of work assigned to each task. This can be fixed by reducing the amount of work each task can do, along with making each chunk of work be of similar size. The easiest way to detect poor load balancing is to use a thread-aware profiling tool, such as Intel Parallel Amplifier XE.
Threading/Tasking Overhead
Launching threads consumes some processor time, so it is important that threads have a decent amount of work to do so that this overhead is insignificant compared to the work being done by the thread. If the amount of work that a thread does is low, the threading overhead can dominate the application. This overhead usually is caused by having too fine a granularity of work. This can be fixed by increasing the amount of work each chunk does.
There is a trade-off between the amount of work a thread does, its impact on threading overhead, and the load balancing that can be achieved. Getting the right amount of work per thread may need some experimentation before the best results are achieved.
Synchronization Overhead
Synchronization overhead comes from using too many locks, barriers, mutexes, or other synchronization primitives. If you are not careful, you can inadvertently use too many primitives by using them in oft-repeated code, such as loops or recursive code. In this case, you should try to use less expensive synchronization constructs or restructure the code so that the constructs are used fewer times. Some programmers try to avoid using locks altogether by designing their software to use just atomic operations. Most lock-free programming relies on atomic operations that compare-and-swap, or read-modify-write using atomic instructions provided by the CPU.
The easiest way to detect synchronization overhead is to use a synchronization-aware profiling tool. For example, Intel Parallel Amplifier XE is capable of profiling locks and waits.
Memory Errors
When a serial program is made parallel, any memory allocation errors that already exist could result in a program that no longer works. Parallel programming also brings two new types of memory errors: false sharing and real sharing.
Memory Allocation Errors
A memory leak — that is, the dynamic allocation of memory without returning the memory to the memory manager — can result in excessive consumption of memory. Symptoms will include out-of-memory messages and excessive disk-thrashing as virtual memory is swapped in and out by the memory manager.
Memory managers that rely on the C runtime library to allocate memory from the heap are poor parallel performers. An example is the function malloc, which uses a single block of memory known as the heap. To make sure that threaded calls to malloc do not corrupt the heap pointers, malloc uses a lock. This lock has the effect of serializing any parallel use of malloc, making the parallel program run slow.
Scalable and lockless allocation functions are available to overcome this problem — for example, scalable_malloc provided with TBB.
Some memory allocation problems can be detected by static analysis of the code, whereas others can be detected only at run time.
False Sharing
False sharing is quite a low-level concept, but it is worth being aware of because it can seriously impact a running program.
Reading and writing from memory is slow, so CPUs have local on-chip memory called caches that are used to store copies of code and data from external memory. Each cache is organized into cache lines of contiguous memory.
Most CPUs have two or three cache levels. For example, my laptop (Intel Mobile Core 2 Duo) has an L1 and an L2 cache, with the L2 cache being shared between the CPU cores. The L2 cache is nearest the external memory; the L1 cache is nearest the CPU. The cache nearest external memory is referred to as the last level cache. Sharing the last level cache can introduce false sharing.
Figure 1.6 shows an example of false sharing. Variables Var A and Var B have already been loaded from external memory into the L2 cache line; in turn, each core also holds its own copy in its L1 cache.
Figure 1.6 A 2-core CPU with shared caches
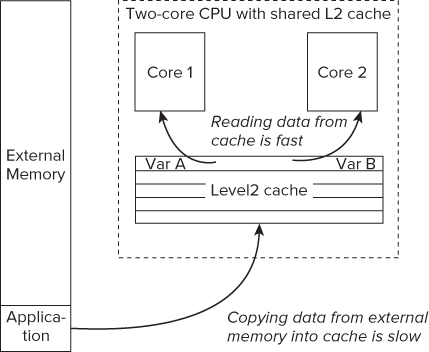
The variables are not shared between the two cores; Var A is only ever accessed by Core 1, and Var B by Core 2. Because of the close proximity in memory of the two variables, they end up sitting in the same cache line.
When Core 2 changes the value of Var B, the processor will see that Core 1 also has a copy of the cache line and mark Core 1's cache line as invalid.
When Core 1 then modifies the value of Var A, the CPU will first flush its invalid L1 cache line and then reload the cache line from L2. If Core 1 alters Var A and then Core 2 alters Var B in a repeated sequence, this will result in the cache lines being continually flushed and updated. The flushing and updating of the cache line adds extra cycles to the time it takes to read the variables.
Although the variables are not logically shared between the two cores, because the two variables sit on the same cache line, they are effectively being shared by the mechanism the CPU employs to keep the cache line values correct.
Detecting false sharing is difficult, but it can be made easier with a tool such as VTune Amplifier XE, which enables you to carry out an architectural analysis of the running program. Chapter 12, “Event-Based Analysis with VTune Amplifier XE,” describes how to do this.
Real Sharing
Real sharing is a variation on false sharing. The difference is that two threads share the same variable. Two cores that are constantly reading and writing to the same memory location will result in a similar cache-thrashing and will hurt performance.
Speedup and Scalability
One of the challenges of parallel programming is to write programs that perform better as you run them on processors with an additional number of cores. Well-written parallel software should display improved performance as you increase the number of cores, and should be agnostic as to how many cores are available.
Calculating Speedup
It is useful to be able to work out how fast a program will speed up if made parallel. The process is not difficult to understand but still worth spelling out.
Speedup
The following code snippet contains three calls to the function work(). At run time the function will be called six times, four of the calls coming from within the for loop. If the for loop is made parallel — for example, by using Cilk Plus or OpenMP — the projected speedup and scalability can be worked out.
1: work(1);
2: for(int i = 0; i < 4; i++)
3: {
4:    work(i+2);
5: }
6: work(6);
Figure 1.7 shows the parallelism that might be achieved on a different number of cores.
Figure 1.7 Calculating speedup
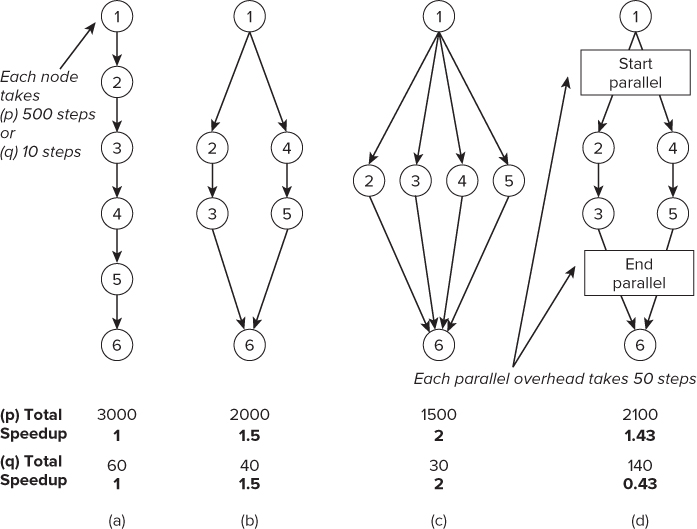
If each call to work() consumes 500 steps, the serial execution of the code would take 3,000 steps — see row (p), column (a).
Column (b) of Figure 1.7 shows what would happen if the for loop were parallelized and run on a 2-core machine. The speedup would be 1.5, which is calculated by dividing the original number of steps by the new number.
In column (c), the number of cores is increased to 4, so the new speedup is 2.
Parallel Overhead
In practice, an overhead is associated with implementing parallelism. The two squares in column (d) of Figure 1.7 represent this overhead. If we assume that the overhead in this example introduces 50 extra steps at the start and end of the parallel code, the total number of steps executed is 2,100, with the speedup becoming 1.43. In this example the overhead has had a slight negative impact on the speedup.
When making code parallel, it is important that there is sufficient work done in the parallel part of the code; otherwise, the overhead of the threading would dominate the performance. In row (q) of Figure 1.7, the same calculations are performed as in row (p), but the function work() now changes to consume only 10 steps. In this situation the speedup of the code, including the threading overhead, is only 0.43 — that is, the code will run at half the speed of the original serial code.
Amdahl's Law and Gustafson's Observation
Two laws are often cited when working out an expected speedup: Amdahl's Law and Gustafson's comments on Amdahl's Law (see Figure 1.8).
Figure 1.8 Two laws for calculating speedup
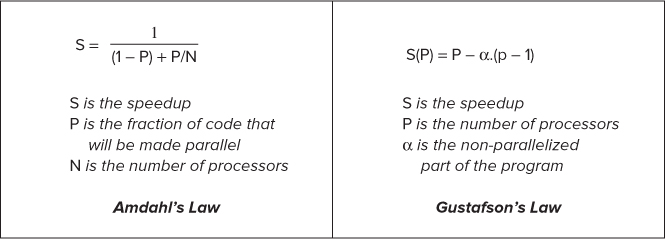
Amdahl says “…the effort on achieving high parallel processing rates is wasted unless it is accompanied by achievements in sequential processing rates of very nearly the main magnitude.” [Amdahl, Gene M., “Validity of the single processor approach to achieving large scale computing capabilities.” AFIPS Spring Joint Computer Conference, 1967]
Gustafson says “…speedup should be measured by scaling the problem to the number of processors not by fixing the problem size.” [Gustafson, John L., “Reevaluating Amdahl's Law.” Communications of the ACM; Volume 31, 1988]
Amdahl focused on the best speedup that could be obtained on a given problem size. Gustafson, on the other hand, contended that the problem size grows to match the resources available.
Amdahl's Law is sometimes used to paint a pessimistic picture of parallelism. Gustafson is far more optimistic, recognizing that programs grow to take up all resources available to them. Whether you use Gustafson's or Amdahl's Law, two things are true:
- The more code you remove from the serial part and make parallel, the better speedup you will achieve when executing code on modern multi-core architecture.
- The best parallel methods scale by solving bigger problems.
Predicting Scalability
Scalability is an observation of the speedup of a program as the number of cores is increased. A scalable program is one that responds well to an increased number of cores. A perfectly scalable program runs twice as fast on a 4-core machine than on a 2-core machine, and runs four times faster on an 8-core machine. In practice, it is rare to achieve perfect scalability.
You can forecast the scalability of the code by increasing the number of cores in the speedup calculation and plotting the trend. Figure 1.9 shows the same code as in the previous section, with calculations for 1 to 6 cores. The reading at zero cores represents the original serial code.
Figure 1.9 Calculating speedup
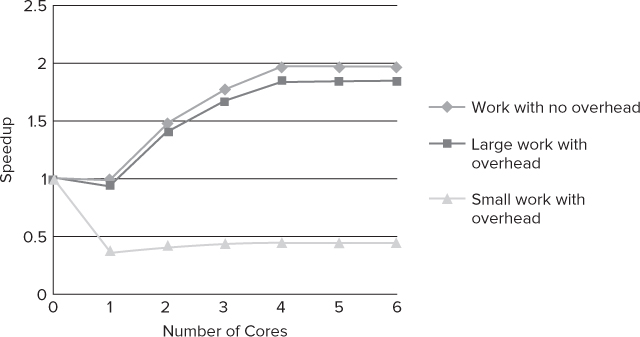
The Work with no overhead line represents the speedup values without the overhead element being added to the equation.
The Large work with overhead and the Small work with overhead lines represent the speedup values taking into account the synchronization overhead.
As shown in the Work with no overhead line, the speedup flattens when there are four or more cores. The reason for this is that when the for loop is parallelized, the number of loops is shared among the available cores. Because the code has only four loops, a maximum of four work() functions can be called in parallel.
The key point to note here is that the design of the parallel code has introduced an upper bound into the parallelism that can be achieved.
When the parallel overhead is added to the graph, you can see that with a large amount of work, the speedup is only slightly impacted.
When the work() consumes only ten steps, two things happen: the parallel version of the code runs slower than the original serial code, and the speedup does not improve as additional cores are added.
Using language models such as Cilk Plus or TBB, you should be able to write programs that scale well as silicon moves from multi-core to many-core. The work-stealing schedulers in these models will help you produce software that is automatically load-balanced, with the correct ratio of workload-to-overhead software that can be regarded as “future-proof.”
Parallelism and Real-Time Systems
Parallelism introduces some exciting opportunities for those working with real-time or embedded systems. One of the challenges is keeping as much of the program as possible at a high level of abstraction without losing the determinacy your program requires. Partitioning your real-time requirements between hard and soft real-time may help you.
Hard and Soft Real-Time
Timing requirements for real-time systems can be divided between soft real-time and hard real-time. In hard real-time, response rates to some events, such as external interrupts and timer events, need to happen within a guaranteed time, usually in the order of microseconds or within in a certain number of CPU clock cycles. In soft real-time, the requirements are less deterministic, with response rates being measured in the order of milliseconds.
The higher-level parallel implementations described in this book are not validated in a hard real-time environment. Some of the requirements of hard real-time, such as deterministic behavior, preemptive scheduling, and guaranteed execution times, are not designed into the underlying runtime libraries.
A Hard Real-Time Example using RTX
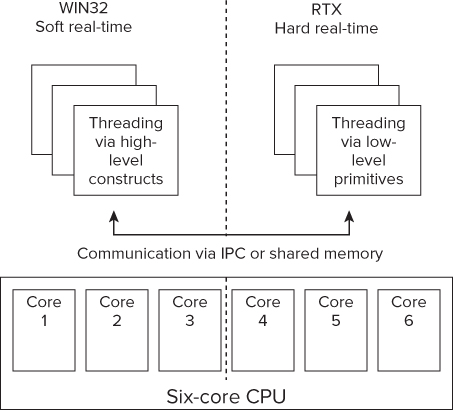
IntervalZeros's RTX is one example of how to use the higher-level parallel models in a real-time system. RTX is a runtime extension to Windows that provides the missing hard real-time behavior. As shown in Figure 1.10, the number of cores available on a system is divided between the Win32 side (which is running Windows) and the RTX side (the real-time extension). Any parallelism on the RTX side is programmed using low-level threading constructs provided by the Windows API. The parallelism on the Win32 side is programmed using higher-level constructs, such as Cilk Plus or OpenMP. Any threaded code that requires a hard real-time response is run in the RTX space. Communication between the two domains is via interprocess communication (IPC) or using shared memory.
Figure 1.10 A model of achieving hard real-time
Advice for Real-Time Programmers
Everything in this chapter about parallelism is just as relevant to real-time programming as it is to non-real-time programming.
If your programs have a real-time aspect, you should:
- Keep to a higher level of abstraction as much as possible. This will help you produce scalable, well-balanced applications.
- Look out for data races. Use static and dynamic analysis to detect them.
- Not be afraid to “borrow” bits from different parallel models.
- Be very conservative with hard real-time requirements. Most general-purpose parallelism libraries are not validated for real-time.
Summary
Multiple cores available on the latest generation of CPUs bring new opportunities for programmers to optimize their code. You can use a variety of different parallel programming models to add parallelism to your programs.
When writing your code, take special care to avoid introducing parallel programming errors into your newly parallelized programs. Aim to write parallel programs that exhibit good speedup, have good load balancing, and are scalable.
The next two chapters introduce Intel Parallel Studio XE, which is designed to help in all stages of the development of parallel code. Chapter 2, “An Overview of Parallel Studio XE,” gives an overview of Parallel Studio; Chapter 3, “Parallel Studio XE for the Impatient,” is a hands-on session to familiarize you with the different tools.