
Chapter 2
An Overview of Parallel Studio XE
What's in This Chapter?
An overview of Parallel Studio XE
An overview of Advisor XE
An overview of Composer XE
An overview of Amplifier XE
An overview of Inspector XE
This chapter gives an overview of Intel Parallel Studio XE, highlighting the main features of each tool.
Parallel Studio XE enables you to develop, debug, optimize, and tune both threaded and non-threaded applications on Linux and Windows. On Windows, Parallel Studio XE plugs into Visual Studio; on Linux, it works alongside the GNU Compiler Collection (GCC).
Developers use Parallel Studio XE in a number of different ways. The chapter concludes with a discussion on three different ways that you might want to use Parallel Studio XE.
Why Parallel Studio XE?
In Chapter 1, “Parallelism Today,” high on the list of the top six challenges was tools. Programmers need tools that work well together and help productivity. Intel Parallel Studio XE is a comprehensive tool suite that is designed to help you develop parallel applications.
Programmers and developers like to follow their own way of doing things. Not everyone follows the same methodology — some like top-down, others like bottom-up, and others mix and match methodologies. Some developers prefer to use tools with a graphical user interface, whereas others find using the command line much more productive. Some experienced programmers dive straight into adding parallelism to their code with a minimum of guidance, whereas others look for as much help as possible. Parallel Studio XE is designed to help developers add parallelism to their existing code and to develop completely fresh code, regardless of their approach and experience.
What's in Parallel Studio XE?
Parallel Studio is available in two versions:
- Intel Parallel Studio XE — Available on both Windows and Linux
- Intel Parallel Studio — A Windows-only product
This book is based on Parallel Studio XE, although you can use most of the concepts in the non-XE version, as well.
Intel Parallel Studio XE
Parallel Studio XE is a suite of software tools that contains the following:
- Intel Parallel Advisor — Parallel Advisor gives advice on how to add parallelism to a program. Advisor enables you to model the effect of parallelism before committing to the final implementation.
- Intel Parallel Composer XE — Composer XE contains a compiler and libraries used to create optimized and parallel code. Within Composer there is also the Parallel Debugger Extension (PDE), which is used to debug threaded code. A standalone debugger — the Intel Debugger (IDB) — is available with the Linux version of the tools.
- Intel Parallel Inspector XE — Inspector XE is used to check a running program for common parallel-type errors, such as deadlocks and data races, and memory errors, such as memory and resource leaks in both parallel and serial programs.
- Intel VTune Amplifier XE — Amplifier XE is used to profile an application to identify program hotspots and bottlenecks. It also analyzes parallel programs to show how parallel and how efficient they are. You can also use Amplifier XE to show how well the CPU is being used in an application, helping you identify any underlying problems.
On Windows, Parallel Studio XE is installed alongside Microsoft Visual Studio and is compatible with the Microsoft tools. The C/C++ compiler in Composer XE is a plug-and-play replacement for the Microsoft compiler.
On Linux, Parallel Studio XE is installed alongside the GNU software development tools and is compatible with GCC. The C/C++ compiler in Composer XE is a plug-and-play replacement for GCC on Linux.
Parallel Studio XE supports program development in C/C++ and Fortran. Table 2.1 lists the features that are in Parallel Studio XE along with the non-XE version.
Table 2.1 Key Features of Parallel Studio XE
| Composer | Non-XE | XE |
| C/C++ compiler | X | X |
| Fortran compiler | X | |
| Profile-guided optimization | X | |
| Parallel Debugger Extension | X | X |
| Intel Debugger (Linux only) | X | |
| Threaded performance libraries | X | X |
| Threaded math library | X | |
| Inspector | ||
| Memory and Thread analyses | X | X |
| Advanced Memory and Thread analyses | X | X |
| Static Security analysis | X | |
| Amplifier | ||
| Hotspot, Concurrency, and Locks and Waits analyses | X | X |
| Timeline | X | |
| Frame analysis | X | |
| Event-based sampling | X | |
| Source view | X | X |
| Assembly view | X | |
| Advisor | ||
| Threading advice for serial applications | X | X |
| User Interface | ||
| Visual Studio integration | X | X |
| Standalone graphical interface | X | |
| Command line | Basic | Advanced |
| Operating System | ||
| Windows | X | X |
| Linux | X |
Intel Parallel Advisor
Intel Parallel Advisor provides a methodology for modeling parallelism in code. The five-step model provides an implementation-neutral means of modeling parallelism in an application under development. Advisor guides the programmer through each step of the model without the need to commit to a particular parallel program implementation until the last step of the modeling.
The Advisor Workflow
Intel Parallel Advisor guides you through a series of steps to help you experiment with adding parallelism to your code (see Figure 2.1). In practice, programmers usually step back and forth between some of the steps until they have achieved good results. You can launch each step from the Advisor Workflow tab (in the Solution Explorer) or from the Advisor toolbar/menus.
Figure 2.1 The five-step Advisor workflow

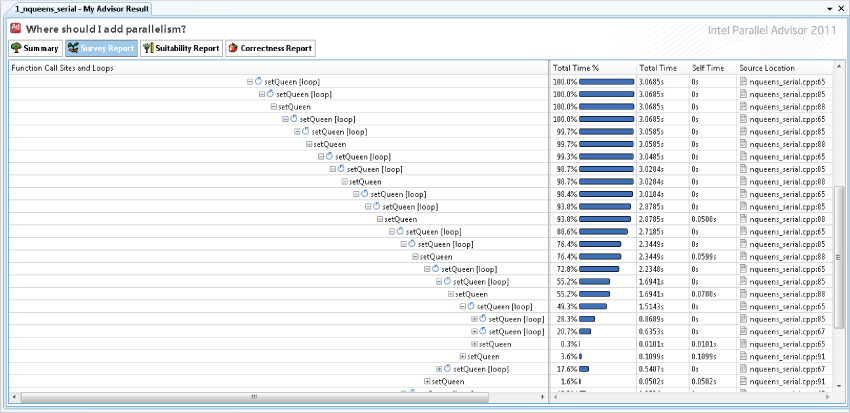
Surveying the Site
The first step in the Advisor workflow is surveying the site to find any hotspots — that is, code with significant CPU activity within the application. Once the survey is run, Advisor reports on screen how much time has been spent executing each part of the program. The amount of time of each function call and loop is displayed in the Survey Report. In Figure 2.2 the recursive call to setQueen is identified as the main hotspot.
Figure 2.2 A Survey Report in Advisor
Annotating Code
After identifying hotspots in the code, the next step is to add annotations to mark areas of parallelism. You can insert the annotations into the code by hand, or you can insert them via the context-sensitive menu. The Advisor modeling engine uses these markers to predict the effect of adding parallelism. Following is an example of code annotation:
#include <advisor-annotate.h>
void solve()
{
  int * queens = new int[size];

  ANNOTATE_SITE_BEGIN(solve)
    for(int i=0; i<size; i++) {
      // try all positions in first row
      ANNOTATE_TASK_BEGIN(setQueen)
        setQueen(queens, 0, i);
      ANNOTATE_TASK_END(setQueen)
    }
  ANNOTATE_SITE_END(solve)
}
You need to include the header file advisor-annotate.h before using the annotation macros.
The macros ANNOTATE_SITE_BEGIN and ANNOTATE_SITE_END mark the area of code that will contain one or more tasks. The task itself — that is, the block of code that will be run in parallel — is marked with the macros ANNOTATE_TASK_BEGIN and ANNOTATE_TASK_END.
Note that the code has one error purposefully included. Each task accesses the dynamically allocated array queens. This will cause a data race, but it will be detected when Advisor does the correctness modeling.
The annotations do not actually implement parallelism; rather, they help you answer the question, “What would happen if I inserted parallelism here?” When Advisor runs the code, the code is still run in serial, with Advisor using the annotations to predict what the parallel behavior will be.
The annotations ANNOTATE_LOCK_ACQUIRE and ANNOTATE_LOCK_RELEASE are used to protect a shared variable. Manipulation of the shared variable is performed within these two annotations:
ANNOTATE_LOCK_ACQUIRE(0);
  shared_variable ++;
ANNOTATE_LOCK_RELEASE(0);
Typically, you should add the lock annotations only after you have run the correctness tool and have found cases of unprotected data sharing.
Checking Suitability
After adding the annotations to the code, you can use Advisor to generate a Suitability Report. The Suitability Report shows the effect of parallelism and the likely scaling that will be achieved.
The All Sites pane of the Suitability Report displays the speedup of each site in a table (see Figure 2.3). You can model the number of CPUs to see how each site responds to different CPU counts.
Figure 2.3 Modeling speedup in the Suitability Report
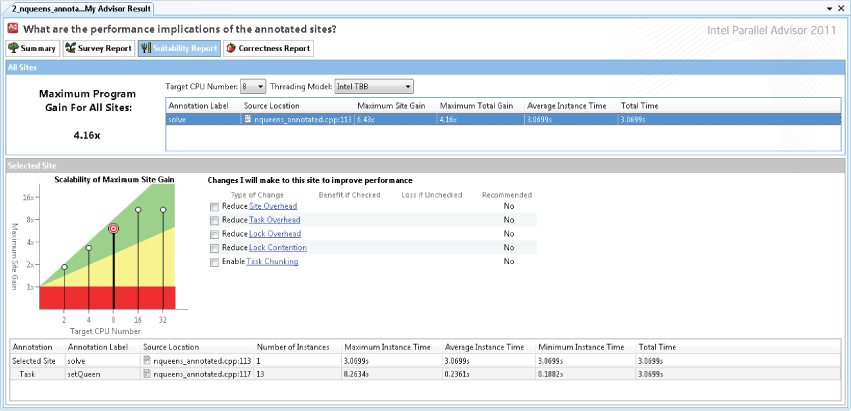
The Selected Site pane shows a graphical summary of the speedup. Advisor knows the impact the parallelism overhead has on the running program. You can use this pane to speculate on the benefit of reducing the overhead.
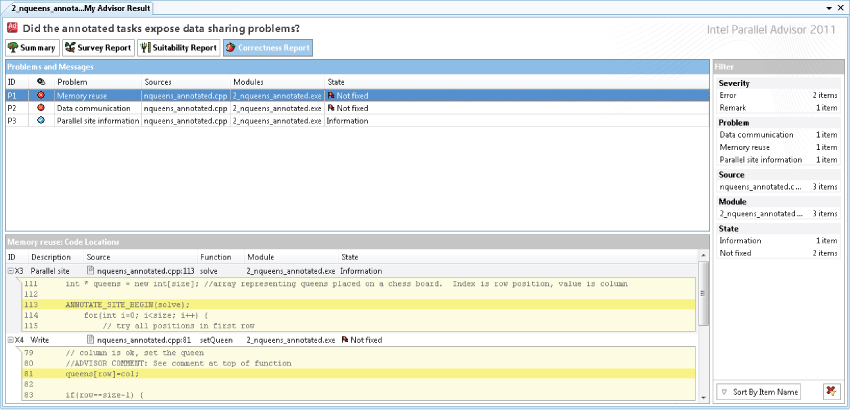
Checking Correctness
After creating the Suitability Report, you can use Advisor to check for any potential data-sharing problems. You can launch correctness checking by selecting the Correction analysis button on the Advisor toolbar. Advisor lists all detected errors in the Correctness Report (see Figure 2.4).
Figure 2.4 A Correctness Report in Advisor
Replacing Annotations
Once you are satisfied with the results of the Suitability and Correctness Reports, the final step is to change the annotations in the source code to real parallel programming constructs. You can choose these from the family of parallel models that are supported by Parallel Composer, as discussed in Chapter 7, “Implementing Parallelism.” The process is not automatic; you are responsible for making the changes by hand and fixing the potential correctness issues identified in the report.
![]()
Intel Parallel Composer XE
Intel Parallel Composer XE contains the following:
- An optimizing C/C++ and Fortran compiler
- A collection of threading and optimization libraries
- Threading Building Blocks (TBB)
- Integrated Performance Primitives (IPP)
- Math Kernel Library (MKL)
- Debugging tools
- Parallel Debugger Extension (PDE) for Windows
- Intel Debugger (IDB) for Linux
Intel C/C++ Optimizing Compiler
The compiler is a direct replacement for the Microsoft compiler and the GNU GCC compiler, and is used to create optimized code. Together, the compiler and libraries support Intel's family of parallel models, as mentioned in Chapter 1.
Table 2.2 lists some of the key features of the compiler (discussed in more detail in Chapter 4, “Producing Optimized Code,” Chapter 5, “Writing Secure Code,” and Chapter 7, “Implementing Parallelism”).
Table 2.2 Key Features of Intel C/C++ Compiler
| Optimization | Description |
| Automatic optimization | Optimizes an application for speed or size. Use the /O1 option to optimize for size, /O2 to optimize for speed, and /O3 for a more aggressive speed optimization. |
| Interprocedural optimization (IPO) | Performs cross-file optimization (sometimes referred to as global optimization). |
| Profile-guided optimization (PGO) | Initial run of the application drives compiler options. |
| Automatic vectorization | Converts calculations within loops to use SSE instructions. You often can achieve significant performance improvements with this option. |
| Floating-point performance | Controls the precision and speed of floating-point operations. For some applications, you can reduce the accuracy of the floating-point calculations (with compiler switches) to get faster results. |
| Intrinsic functions | Inserts SSE, data pre-fetching, and other optimized routines. |
| Parallelization | |
| Cilk Plus | Provides the easiest way to parallelize a program. |
| OpenMP | Provides support for OpenMP 3.0. |
| Automatic parallelization | Provides loop-centric automatic parallelism. |
| Tools and Reporting | |
| Guided auto-
parallelizaton (GAP) |
Advises on code changes required to satisfy auto-parallelization and auto-vectorization. |
| Optimization reports | Provides detailed reports on all stages of optimization. |
| Static Security analysis (SSA) | Checks for security issues that could compromise the application being developed. |
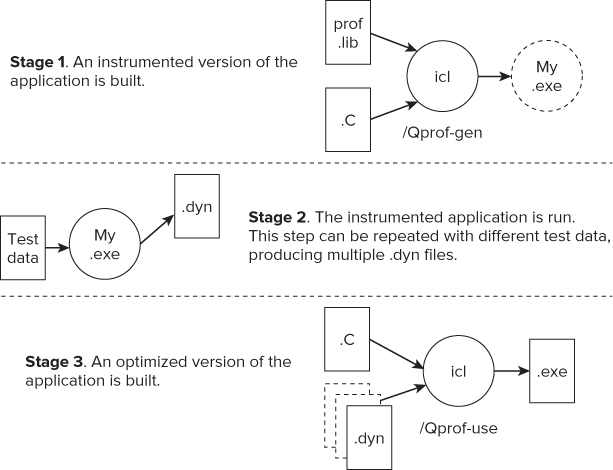
Profile-Guided Optimization
In PGO, you create a set of statistics, or profiles, by running the actual application being developed, and then feeding this information back into the compilation stage of the program, using the profile to automatically influence the behavior of the compiler. You conduct PGO in three stages (see Figure 2.5):
Figure 2.5 The three stages of PGO
PGO improves application performance by:
- Reorganizing code layout
- Reducing instruction-cache problems
- Shrinking code size
- Reducing branch mispredictions
Cilk Plus
Cilk Plus is an extension to C/C++ to support parallelism. Using just three new keywords, Cilk Plus is one of the easiest ways to add parallelism to a program. With Cilk Plus you express parallel intent, rather than parallel control.
Cilk Plus has the following key features:
- Keywords
- Reducers
- Array notations
- Elemental functions
- SIMD pragma
The Cilk Plus scheduler decides at run time whether to run the code in parallel. The scheduler automatically takes care of load balancing. You can influence the Cilk Plus program with the following keywords, environmental variable, and APIs:
- Keywords
- cilk_spawn
- cilk_sync
- cilk_for
- Environment variable
- CILK_NWORKERS
- APIs
- _cilkrts_set_param(“nworkers”,”4”)
- _cilk_get_nworkers()
- _cilkrts_get_total_workers()
- _cilkrts_getworker_number()
When you run a Cilk Plus program, a number of workers are created — usually the same number as the number of cores on the host system. You can override the default number of workers by using the Cilk Plus API. You can also set the number of workers by using the environment variable CILK_NWORKERS.
Listing 2.1 shows an example of using cilk_spawn and cilk_sync. The program calculates the 40th value of the Fibonacci series.
 Listing 2.1: A simple Cilk program
#include <stdio.h>
#include <cilk/cilk.h>

long fibonacci(long n)
{
  long x, y;
  if (n < 2) return n;

  // find the n-1 number
  x = cilk_spawn fibonacci(n-1);

  // find the n-2 number
  y = fibonacci(n-2);

  // workers wait here until all have finished
  cilk_sync;
  return (x+y);
}

int main()
{
  // work out the 40th value in fibonacci series
  long fib = fibonacci(40);
  // display the results
  printf("Fibonacci 50: %d
",fib);
}
code snippet Chapter22-1.cpp
The lines following the cilk_spawn statement (that is, starting with y = …) up to the cilk_sync statement are known as the continuation. The cilk_spawn keyword gives permission to the run time to run fibonacci(n-1) in parallel with the continuation code. At run time, if a spare worker is available, the scheduler steals the continuation code from the first worker and assigns it to a second worker. At the same time, the first worker continues executing the call to fibonacci(n-2).
Cilk Plus reducers are used to prevent data races by using them in place of nonlocal variables, In Listing 2.2, the variable j, which was originally an integer, has been changed into a reducer. This change prevents a data race from occurring. At run time, each worker is given its own view of the reducer.
Listing 2.2: An example of using a Cilk Plus reducer
#include <cilk/cilk.h>
#include <cilk/reducer_opadd.h>
#include <stdio.h>

int main()
{
    cilk::reducer_opadd<int> j;

    cilk_for(int i = 0; i < 100; i++)
    {
        j += i;
    }
    printf("J is %d",j.get_value());
}
code snippet Chapter22-2.cpp
The values of the individual views are combined back together when the parallel strands come back together. You retrieve the combined value in the printf statement by calling the reducer function get_value(). The operation used to combine the values is specific to the type of reducer that is being used. In this example the reducer type is a reducer_opadd, so the views are combined by adding the values together. Table 2.3 lists other available Cilk Plus reducers. You can also write your own reducers.
![]()
Table 2.3 Cilk Plus Reducers
| Reducer | Description |
| reducer_list_append | Adds items to the end of a list |
| reducer_list_prepend | Adds items to the beginning of a list |
| reducer_max | Finds the maximum value from a set of values |
| reducer_max_index | Finds the index of maximum values from a set of values |
| reducer_min | Finds the minimum value from a set of values |
| reducer_min_index | Finds the index of minimum values from a set of values |
| reducer_opadd | Performs a sum |
| reducer_ostream | Provides an output stream that can be written in parallel |
| reducer_basic_string | Creates a string using append or += operations |
Array notations provide data parallelism for arrays. Elemental functions are functions that can be applied to arrays and scalars to enable data parallelism. The SIMD pragma is used to enforce vectorization. The compiler issues a warning if it fails to vectorize the code.
Listing 2.3 is an example of using array notation and elemental functions. Each array element in a[] and b[] is added together, putting the results in c[]. The following lines perform the same calculations:
int sum = _sec_reduce_add(c[:])

for(int i=0; i<4; i++){c[i] = a[i] + b[i];}.
The call to _sec_reduce_add adds together all the elements of the array c. You can perform the addition in parallel if you have sufficient CPU resources available at runtime.
Listing 2.3: A simple array notation example
int main()
{
    int a[] = {1,2,3,4};
    int b[] = {2,4,6,8};
    int c[] = {0,0,0,0};

    c[:]=a[0:4] + b[0:4]; // 3,6,9,12
    int sum = _sec_reduce_add(c[:]);  // 30

    return sum;
}
code snippet Chapter22-3.cpp
OpenMP
OpenMP is a well-established standard for parallel programming. Intel Parallel Composer supports OpenMP version 3.0. OpenMP consists of pragmas, APIs, and environment variables that you can use to add parallelism to code incrementally.
The OpenMP task example in Listing 2.4 shows how tasks are used. To successfully build the code with the Intel compiler, you must use the /Qopenmp option.
Listing 2.4: A simple OpenMP task example
#include <stdio.h>
#include <omp.h>
int main()
{
  int j = 0;
  // create a parallel region
  #pragma omp parallel
  {
    // this task will run on just one thread
    #pragma omp single nowait
      {
         for (int i = 0; i < 10; i++)
         {
            // every time loop iteration hits this next line
            // an omp task will be created and will
            // be run the moment a thread is available
            #pragma omp task firstprivate(i)
            {
               #pragma omp atomic
               j++;
               printf("i: %d thread:%d
",i,omp_get_thread_num());
            } // end #pragma omp task
         } // end for …
      } //end #pragma omp single nowait
   } // end #pragma omp parallel
   return 0;
}
code snippet Chapter22-4.cpp
At the start of the #pragma omp parallel, a pool of threads is made available. The #pragma omp single statement ensures that the following block of code is run by only one thread.
Within the single running thread is a loop that causes the #pragma omp task statement to create ten tasks. Once a task is created, it is free to be executed by the first available free thread.
Once the single thread has created all the tasks, the thread on which it was running becomes available to the OpenMP runtime — the nowait clause makes sure the thread is released immediately.
There is an implicit barrier at the end of the #pragma omp parallel block: no thread can go beyond this point until all threads have completed their work.
The variable j has the potential to cause a data race, so it is incremented in an atomic operation.
Intel Threading Building Blocks
Intel Threading Building Blocks (TBB) is a C++ template library for parallelizing C++ programs. Using TBB to add parallelism to your program makes sense only if you wrote your program in C++ and you are comfortable with such concepts as templates, overloading, and inheritance.
TBB has had wide adoption, with a number of commercial software products having their parallelism provided under the hood by TBB.
The library is available under the GNU Public License (GPL) and non-GPL development. The version shipped with Parallel Studio is the non-GPL version.
TBB consists of the following components:
- Parallel algorithms
- Task scheduler
- Concurrent containers
- Thread local storage and scalable memory allocators
- Low-level synchronization primitives
The main unit of work is the task, which is scheduled by a work-stealing scheduler. Tasks are allocated to threads by the scheduler and are held in queues. When a thread's task queue is empty, the scheduler will steal a task from another thread's queue, thereby keeping all the threads busy.
You can mix TBB with other parallel language constructs. For example, you can write a parallel program using Cilk Plus and use TBB to supply memory allocation and synchronization. Table 2.4 lists some of the templates that are available in TBB.
Table 2.4 Some TBB Templates
| Algorithms | Description |
| parallel_for | Performs parallel iteration over a range of values |
| parallel_reduce | Computes reduction over a range |
| parallel_scan | Computes parallel prefix |
| parallel_do | Processes work items in parallel |
| parallel_for_each | Provides parallel variant of std::for_each |
| parallel_pipeline | Performs pipelined execution |
| parallel_sort | Sorts a sequence |
| parallel_invoke | Evaluates several functions in parallel |
| Containers | |
| concurrent_hash_map | Provides associative container with concurrent access |
| concurrent_queue | Provides queue with concurrent operations |
| concurrent_bounded_queue | Provides bounded dual queue with concurrent operations |
| concurrent_vector | Provides class for vectors that can be concurrently grown and accessed |
| concurrent_unordered_map | Provides container that supports concurrent insertion and traversal |
| Primitives | |
| mutex | Provides mutual exclusion of threads from sections of code |
| atomic | Used for atomic operations |
| Allocators | |
| tbb_allocator | Allocates memory (may not be scalable) |
| scalable_allocator | Provides scalable memory allocation |
| zero_allocator | Allocates zeroed memory space |
| aligned_space | Allocates uninitialized memory space |
Listing 2.5 shows an example of using the parallel_for algorithm to print the value of a loop variable.
Listing 2.5: A simple example of the TBB parallel_for algorithm
1: #include "tbb/tbb.h"
2: #include <stdio.h>
3: using namespace tbb;
4:
5: int main()
6: {
7:   parallel_for( size_t(0),size_t(20),size_t(1),
8:     [=](size_t n) {
9:       std::printf("%d ",n);
10:    }
11:  );
12:  return 0;
13:}
code snippet Chapter22-5.cpp
The first three parameters of parallel_for are the loop start, loop end, and loop increment values.
Lines 8 to 10 define a lambda function, which is supported by the C++0x standard. You have to use the option /Qstd=c++0x with the Intel compiler to successfully build the code shown in Listing 2.5. This parameter does not need to be a lambda function; you could use a normal C function instead.
Parameter n in line 8 is the current loop counter. The scheduler passes in the current loop count via this variable.
Lines 9 to 10 are the body of the lambda function, which gets executed once every iteration.
The TBB scheduler load-balances the loop iterations between separate TBB tasks, the order of execution being indeterminate.
Intel Integrated Performance Primitives
The Intel Integrated Performance Primitives (IPP) library is a vast collection of functions covering audio, video, speech, data compression, signal processing, and cryptography (see Table 2.5). Before writing your own libraries and algorithms, you should consider using IPP instead. This library might stop you from “reinventing the wheel” and significantly shorten your development time.
Table 2.5 IPP Libraries and Domains
| Library | Domain |
| ippAC | Audio coding |
| ippCC | Color conversion |
| ippCH | String operations |
| ippCP | Cryptography |
| ippCV | Computer vision |
| ippDC | Data compression |
| ippDI | Data integrity |
| ippGEN | Generated functions |
| ippIP | Image processing |
| ippJP | Image compression |
| ippMX | Small matrix operations |
| ippRR | Rendering and 3D |
| ippSC | Speech coding |
| ippSP | Signal processing |
| ippSR | Speech recognition |
| ippVC | Video coding |
| ippVM | Vector math |
The functions in IPP are optimized for different architectures. A top-level, architectural-neutral function determines at runtime which instruction set the host supports, and then calls the appropriate architectural-specific, low-level function. This technique, known as software dispatching, is done automatically at run time. Where dispatching is not required, it is possible to link directly to the lower-level optimized libraries. You can link applications with the IPP library either statically or dynamically.
An Application Example
Figure 2.6 gives an example of where the Fast Fourier Transform (FFT) functions of the IPP library are the real-time manipulation of a sound stream.
Figure 2.6 Real-time sound manipulation
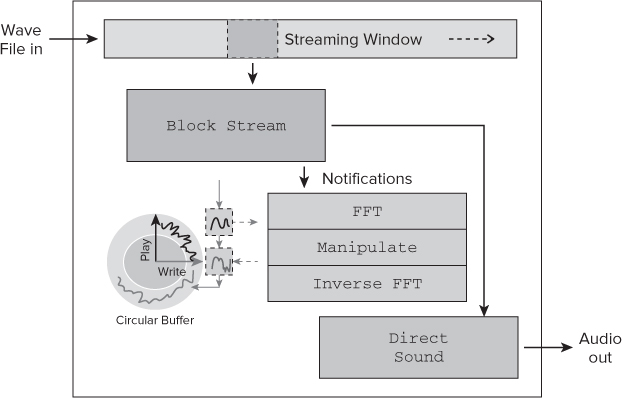
The design was part of a program that changes the characteristics of a wave file as it is being played. The reading and playing of the sound uses Windows DirectSound, with an FFT being applied in real time.
A block of data Block Stream is read from a wave file. As each block is read, the play and write pointers are maintained as a circular buffer.
The address of the circular buffer is passed to the FFT function, after which the sound is modified using the manipulate block; finally, the modified sound data is inverse FFT'd and written back to the circular buffer.
Listing 2.6 shows how the IPP FFT function is called. The code is not complete, but it shows how FFT is achieved using IPP. The FFT function ippsFFTFwd_RToPerm_32f does the actual FFT. Initialization is performed with the ippsFFTInitAlloc_R_32f and ippsZero_32fc functions.
Listing 2.6: Using the IPP FFT functions
// Function that will call IPP FFT
int FFT(float in[], const float out[], int len)
{
  int power = 12;
  Ipp32fc* pFilterCCS;
  IppsFFTSpec_R_32f *pFFTSpec;

  // allocate space for FFT
  pFilterCCS = (Ipp32fc*)ippsMalloc_32f(len+2);

  // FFT configure
  Ipp32fc one = {1.0, 0.0};

  // zero initialize the FFT space
  ippsZero_32fc( pFilterCCS, len/2+1 );

  //initialize the FFT
  ippsFFTInitAlloc_R_32f( &pFFTSpec,
                 power, IPP_FFT_DIV_BY_SQRTN, ippAlgHintFast );

  // do the FFT
  ippsFFTFwd_RToPerm_32f(in, (Ipp32f*)out, pFFTSpec, 0 );

  // free up the FFT space
  ippsFree(pFFTSpec);

  return 0;
}
code snippet Chapter22-6.cpp
IPP and Threading
Some library functions are already parallelized. A nonparallelized version of the library is also provided. You can find the list of threaded functions by looking at the file ThreadedFunctionsLists.txt in the documentation directory of your IPP installation.
All the functions in IPP are thread-safe, which means you can safely use them in your parallel code, knowing that the functions will be race-free.
The IPP library provides a series of performance tests for each application domain.
![]()
Intel Parallel Debugger Extension
The Intel Parallel Debugger Extension (PDE) provides:
- Thread Data-Sharing analysis
- Cilk Plus and OpenMP awareness
- SSE register viewing/debugging
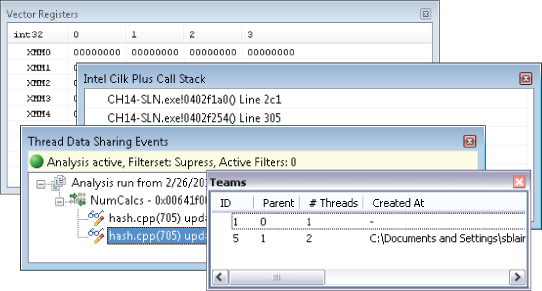
The PDE works alongside the standard Visual Studio debugger and provides additional functionality to help debug parallel applications. Figure 2.7 shows an example of some of the PDE windows.
![]()
Figure 2.7 Some of the windows in the Parallel Debugger Extension
Intel Debugger
The Intel Debugger (IDB) is a standalone debugger available on the Linux platform. It has all the features you would expect of a debugger, including breakpoints, watchpoints, single-stepping, source code, and disassembler views.
IDB has its own graphical user interface as well as a command-line interface. All the parallel debugging features mentioned in the previous section are available in IDB.
Math Kernel Library
The Math Kernel Library (MKL) is a collection of math routines for use in science, engineering, and financial applications. The library is well optimized and often gives superior results over hand-crafted code or other comparable libraries. The libraries and functions in MKL are well known in the HPC community, so they are not described further here.
MKL offers the following functionality:
- Dense linear algebra
- Basic Linear Algebra Subprograms (BLAS)
- Linear Algebra PACKage (LAPACK)
- Trust Region Solver
- Sparse linear algebra
- Sparse BLAS
- Sparse format converters
- Sparse solvers
- PARDISO direct sparse solver
- Iterative sparse solvers
- Preconditioners
- Fast Fourier transforms
- Optimized LINPACK benchmark
- Vector math library
- Vector random number generators
- Cluster support
- Scalable LAPACK (ScaLAPACK)
- Cluster FFT
You can use the library functions in either Fortran or C/C++ code. Some of the functions have variants that have parallelism implemented internally. All the functions are thread-safe.
Listing 2.7 shows how to perform a matrix multiplication using the MKL. Two matrices, A and B, and are filled with random numbers. The function cblas_sgemm is used to multiply A and B and write the results in C.
Listing 2.7: Using the MKL to perform a matrix multiplication
#include <stdlib.h>
#include <time.h>
#include "mkl_cblas.h"

#define MATRIX_SIZE 100
#define BUFFER_SIZE MATRIX_SIZE * MATRIX_SIZE
int main(void)
{
  float A[BUFFER_SIZE];
  float B[BUFFER_SIZE];
  float C[BUFFER_SIZE];

  // seed the random number generator
  srand( (unsigned)time( NULL ) );

  // initialize the matrices with random values
  for (int i = 0; i < BUFFER_SIZE; i++)
  {
    A[i] = rand();
    B[i] = rand();
    C[i] = 0;
  }

  // matrix multiply using MKL
  cblas_sgemm(
      CblasRowMajor,
      CblasNoTrans,
      CblasNoTrans,
      MATRIX_SIZE,  MATRIX_SIZE,  MATRIX_SIZE, 1.0,
      A, MATRIX_SIZE,
      B, MATRIX_SIZE, 0.0,
      C, MATRIX_SIZE
  );
}
code snippet Chapter22-7.cpp
Because the MKL is designed to work with a number of different combinations of compilers and operating systems, several variants of the libraries ship with Parallel Studio XE. You can use the online wizard at http://software.intel.com/en-us/articles/intel-mkl-link-line-advisor/ to help decide which MLK library to use.
VTune Amplifier XE
VTune Amplifier XE is a profiling tool to find bottlenecks in your application. You can conduct the analysis at the algorithm level, where the focus is on the code, or at a more advanced level, where the performance of code on the processor microarchitecture is considered:
- Algorithm analysis
- Hotspots
- Concurrency
- Locks and Waits
- Advanced analysis
- General Exploration
- Memory Access
- Bandwidth
- Cycles and uOps
- Front-End Investigation
The profiling results are displayed graphically. A comparison of several results can be displayed side by side.
Advanced-level analysis relies on event-based sampling, which uses counters in the processor to measure how well your code performs. Read more in Chapter 12, “Event-Based Analysis with VTune Amplifier XE.”
The first stage of the four-step tuning methodology (see Chapter 3) uses Amplifier to find code hotspots. In the final tuning step, Amplifier detects any parallel overhead and determines how parallel the code is.
All analyses should be carried out on the optimized version of your application.
![]()
Hotspot Analysis
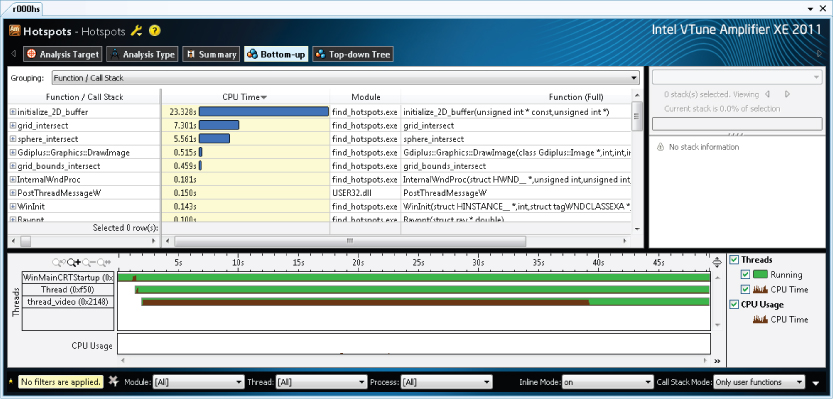
Hotspot analysis is used to find parts of the code that consume the most CPU activity. Hotspots are prime candidates for running in parallel (see Figure 2.8). The top part of the window gives a summary of the hotspots, the biggest being at the top of the list. To the far right is the call stack of the highlighted hotspot. The bottom of the window is a timeline view.
Figure 2.8 Hotspot analysis using Amplifier
Concurrency Analysis
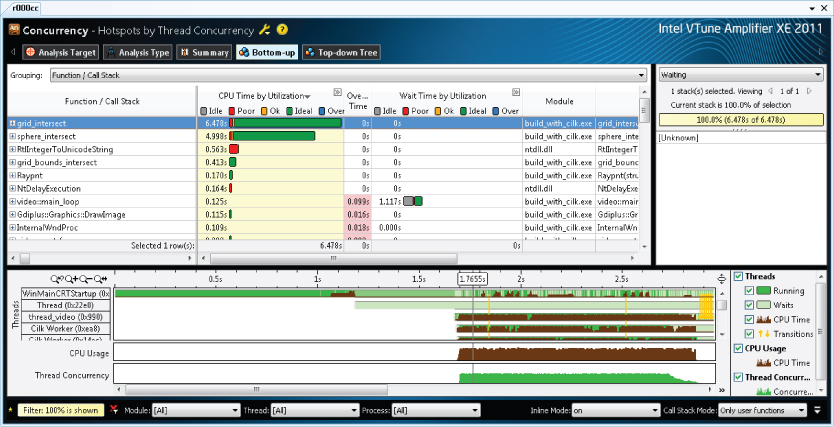
The Concurrency analysis gives a summary of how parallel an application runs. Concurrency is a measure of how many threads were running in parallel. The colored bars are a summary of how much time each function took, and the color of the bars indicates how much concurrency there is. You can filter the information in the graph by module, thread, processor, and utilization (see Figure 2.9).
Figure 2.9 Concurrency analysis using Amplifier
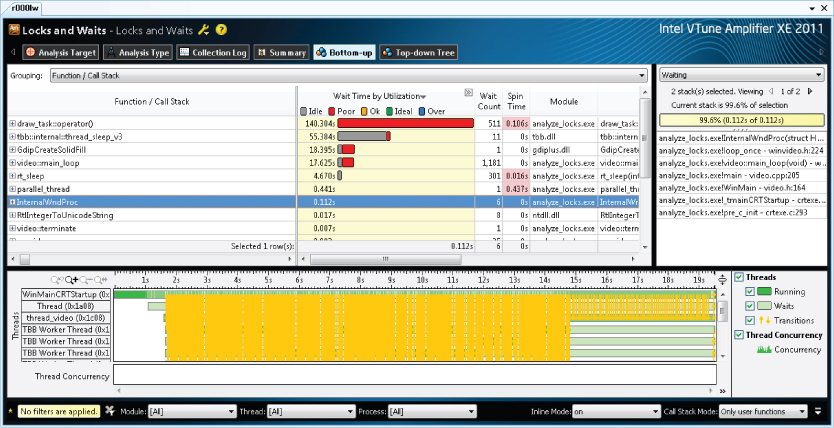
Locks and Waits Analysis
The Locks and Waits analysis shows where a program is waiting for synchronization. Two groups of synchronization objects are supported: objects used for synchronization between threads, and objects used with waits on I/O operations.
In Figure 2.10, the longest red bars indicate the synchronization objects that are causing the longest wait time. You should try to fix these first.
Figure 2.10 Locks and Waits analysis using Amplifier
You can also launch Amplifier XE from the command line. When you perform the profiling from the command line, the results are displayed as text. You can also view the results generated from the command line in the graphical version of Amplifier XE.
Dissassembly Source View
You can drill down to the disassembly view of your code with Amplifier XE. You can choose to display assembler, source, or interleaved assembler and source.
Parallel Inspector XE
Intel Parallel Inspector XE checks for threading and memory allocation errors. Inspector XE detects these errors at run time, usually working on an unoptimized version of the program under test. Data races and deadlocks are detected and their location pinpointed.
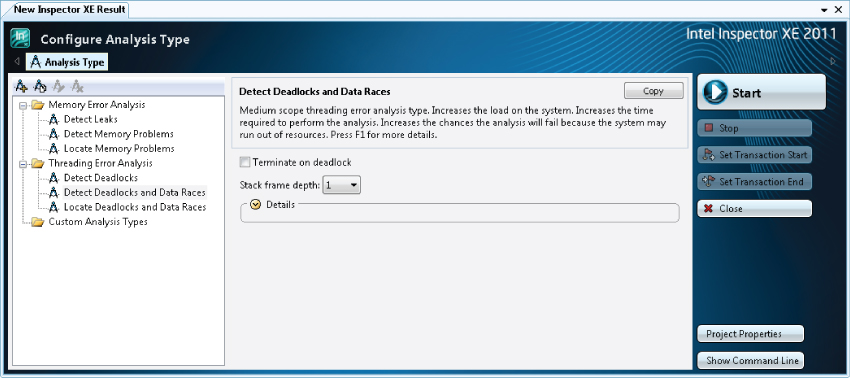
Predefined Analysis Types
Inspector XE is a dynamic analysis tool that observes the application under test while it is running. When Inspector XE launches an application, it first instruments the binary and then begins to capture runtime information. Several predefined analysis types are available (see Figure 2.11).
Figure 2.11 Controlling the analysis depth
When Inspector XE executes code, it flags errors even if they did not actually cause a problem at run time. For example, if you run code that has a potential deadlock but the deadlock did not actually happen, Inspector XE still recognizes the potential problem and reports it.
Errors and Warnings
Inspector XE reports for the following types of errors and warnings:
- Threading errors
- Data races
- Deadlocks
- Lock hierarchy violations
- Potential privacy infringements
- Other threading information
- Memory errors
- GDI resource leaks
- Incorrect memcpy calls
- Invalid deallocations
- Invalid memory access
- Invalid partial memory access
- Kernel resource leaks
- Memory leaks
- Uninitialized memory access
- Uninitialized partial memory access
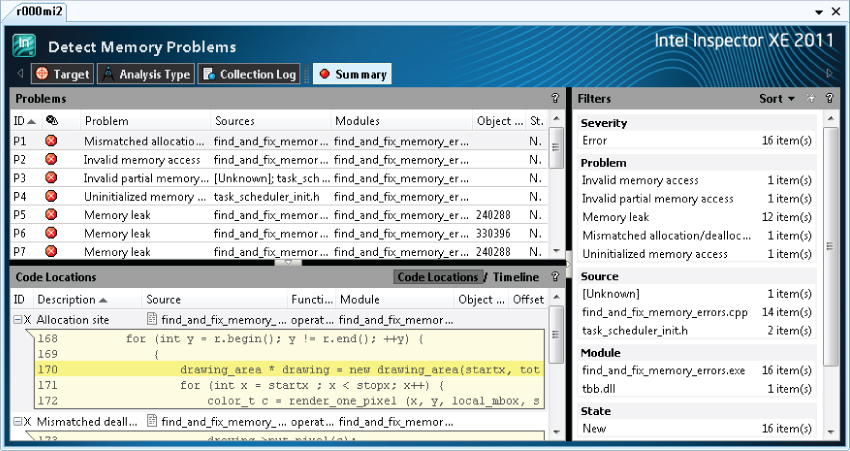
Figures 2.12 and 2.13 show how the results are displayed.
Figure 2.12 A threading error report in Inspector XE
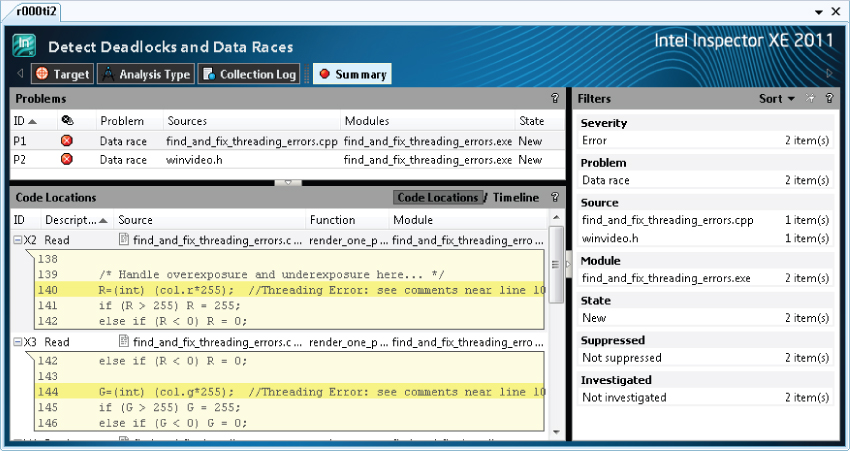
Figure 2.13 A memory error report in Inspector XE
Some errors that Inspector XE reports may be false positives — that is, they are not really errors but the tool thinks they are. Such errors can be added to a suppression file, and these errors are ignored in subsequent runs.
In addition to the GUI version of Inspector XE, a command-line version of Inspector is available, with the results displayed as text. You can also view the results generated from the command line in the graphical version of the tool.
![]()
Static Security Analysis
The primary goal of SSA is to harden applications against security attacks; it is also useful as a way to detect some programming errors. SSA relies on Composer XE and Inspector XE. The compiler performs the analysis, and Inspector XE displays the results.
The analysis checks for the following:
- Buffer overflows
- Misuse of pointers and heap storage
- Unsafe or incorrect use of C/C++ language and libraries
- Unsafe or incorrect use of Fortran language and libraries
- Misuse of OpenMP
- Misuse of Cilk Plus
When the compiler performs an SSA, it does not produce a working executable; however, it does produce intermediate object files, which contain extra information that is analyzed at the link stage.
![]()
Different Approaches to using Parallel Studio XE
Parallel Studio XE contains many different components to help you write parallel code and supports more than one model of use. Not all developers stick to one particular way of doing things. When using Parallel Studio XE, take a moment to consider which approach to using Parallel Studio might suit you. Here are some suggestions that might help:
- If you are looking for as much guidance as possible — Use Parallel Advisor, which offers a high-level methodology of developing parallelism. Advisor uses the technology of the underlying tools but does not rely on you firing up individual tools. This methodology doesn't suit everyone. If you are looking for a technique that helps model parallelism before implementing it, and keeps an overarching view of what you are doing, this might be for you.
- Chapters 10 and 18 are dedicated to developing code using the Advisor-driven methodology.
- If you prefer to control individual analysis and development steps — Use the individual tools from Parallel Studio XE, launching the tools directly from the toolbars (rather than relying on Advisor). You can use the tools in Parallel Studio XE (Amplifier XE, Composer XE, and Inspector XE) as part of the popular four-step development cycle.
Chapter 3 introduces the four-step development cycle: analysis, implementation, error checking, and tuning.
- If you hate graphical user interfaces or prefer script-driven development — Use a compiler-centric focus, with all development work being carried out from the heart of your code using just command-line tools. You can drive the compiler, libraries, Amplifier XE, and Inspector XE from the command line.
Summary
Parallel Studio XE includes most of the tools you need to write and debug simple and complex parallel applications.
Composer XE, which includes a C/C++ and Fortran compiler along with a set of optimized thread-safe libraries, can be used to write optimized/parallelized code. Amplifier XE and Inspector XE are used to profile and error-check your applications. Parallel Advisor enables you to model the effect of introducing parallelism into your code before committing to a particular implementation.
The next chapter gives you the chance to try Parallel Studio by following hands-on examples.