
The key to a fast Web application is to understand the application’s behavior from the user’s perspective. Naturally, this requires a combination of analysis tools and an investment of time to evaluate the resultant data from the analysis tools. Analyzing Web applications is far from a simple task. Developers must evaluate many facets of the application’s behavior, including but not limited to such items as the network traffic, the sequence of events that occurs during a page load, and the different rendering behaviors caused by client-side technologies like JavaScript and CSS. Unfortunately, Microsoft does not offer an end-to-end toolset that works in conjunction with Visual Studio to allow for a holistic analysis of Web application performance. There is, however, a collection of stand-alone tools available, both from Microsoft as well as other vendors, for conducting such an analysis, many of which we will discuss in this chapter.
As we discussed earlier in this chapter, when Web application pages are requested, the browser governs the flow of content from the server to the user and performs rendering based on several different factors. Much of the downloading of content is serial, meaning that, while the browser is retrieving a piece of content, it is delaying the retrieval of other content. To understand this and other interactions between the browser and the server, application developers should familiarize themselves with the diversity of tools that are available for analyzing these interactions. There are several tools that are freely available and very effective at analyzing certain parts of the browser and server interaction, including but not limited to Fiddler, Network Monitor, Visual Round Trip Analyzer, HTTPWatch, Firebug, and Y!Slow. The following information represents an overview of these products. A more detailed review of these tools is beyond the scope of this chapter.
This is one of the most widely used tools among Web application developers at Microsoft. Fiddler is a freely available HTTP debugging proxy application that captures all HTTP information between the client browser and the server and allows application developers to inspect and manipulate incoming and outgoing data. This tool was not designed strictly for performance analysis but rather for the broader purpose of enabling detailed inspection of the Web application’s HTTP traffic. However, it is quite useful for performance analysis and understanding the detailed HTTP interactions between the browser and the server. This enables developers to gain insight into HTTP transaction details like the number of requests for a given page load, header values, and many other page load characteristics. Most Web application developers would be pleasantly surprised by the power of this tool and are encouraged to spend some time playing with it.
This application has been available from Microsoft for several years and is primarily a protocol analyzer, or packet sniffer. It allows application developers to inspect network traffic at a very low level and analyze application behavior at essentially the packet level. Network Monitor is a great tool for conducting network-level analysis, but it is rather complex to understand and requires knowledge of networking, packet sniffing, and related technologies. It is not the tool you would use all that frequently, but it does provide a depth of information that other tools do not.
As a complement to Network Monitor, Microsoft recently released a tool for analyzing page performance and behavior over the network called Visual Round Trip Analyzer (VRTA). Although previously available as an internal Microsoft tool, VRTA is a solid (and free) addition to the commercially available set of performance analysis tools. VRTA works in conjunction with Network Monitor to capture the HTTP traffic between the client and the server, and it renders an informative, graphical representation of the transaction. This analysis includes information about the number, type, and download pattern of all file types in the transaction as well as their respective sizes. It further provides information about how well the page was leveraging the available bandwidth, as well as recommendations for where improvements can be made to the page. Generally speaking, this tool builds on top of the powerful things already being done by Network Monitor but distills the output in a way that presents actionable results for application developers.
Similar to Fiddler, HTTPWatch from Simtec Limited captures all HTTP traffic between the client browser and the server and provides a useful interface for analyzing the captured information. Unlike Fiddler, HTTPWatch provides a more powerful graphical representation of the page rendering behavior. This allows an application developer to easily acquire a deep understanding of the interaction between the browser and the server by simply exploring each step of the page rendering process. 4-2 (shown later in this chapter) illustrates an analysis of Microsoft’s Live Search home page.
In addition to those just described, there are other tools that are also helpful for developers when analyzing Web page performance. Those include the freely available Firebug, which is an add-on for the Firefox Web browser; the developer toolbar for Internet Explorer, which helps with page troubleshooting and debugging; and Y!Slow, which is a tool built by the performance team at Yahoo!. Each of these tools shares functionality similar to the tools mentioned above and will likely complement any Web application developer’s analysis toolset. Application developers are encouraged to investigate each of the tools discussed and to choose the tool or tools that best help to augment their analysis efforts. A list of these tools and their respective Web sites has been provided in Appendix B of this book.
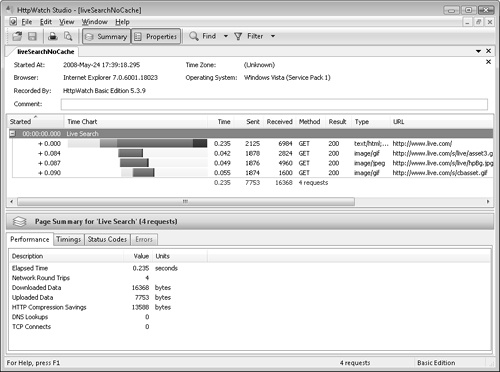
To further illustrate how developers can analyze their Web applications using the tools mentioned previously, we will review Microsoft’s Live Search application. Using HTTPWatch, which runs as an Internet Explorer add on, we clear the browsers cache and use the recording functionality to capture the results of a main page load from http://www.live.com. HTTPWatch generates the analysis shown in 4-2.
In the lower window, under the performance tab, HTTPWatch generates some statistics about the page load. Metrics such as the elapsed time, number of network round trips, size of the downloaded data, and the HTTP compression efficiency provide some indication about how this page is performing. Note that some of the features in this window may not be available in the Basic Edition of HTTPWatch, which is available for free. Specifically, we note the following to be true.
The elapsed page load time is 0.235 seconds.
The total number of network round trips was four.
The amount of data downloaded was 16.3 kilobytes (KB), which includes all relevant content, JavaScript, CSS, and image assets.
The amount of data uploaded was 7.7 KB, which includes the transmission of cookies and request header values.
HTTP compression saved 13.5 KB from being transferred to the client, which is an approximate 45 percent reduction.
DNS was served from a local machine cache, which saved remote DNS lookups.
TCP connects indicate that Keep-Alives are enabled on the Web servers.
This data helps us to understand what is happening between the browser and the server quite well. However, to better understand what the user is experiencing, we need to observe the interaction between the server and the browser through the illustration in the upper window. This Gantt chart–style illustration depicts the behavior of the application from the initial server request to the end of the page load, where each bar represents an instance of an HTTP request for a particular application asset or assets, like HTML, images, or JavaScript. Notice that the first bar shows how much time elapsed before the main content of the page was retrieved, and the subsequent bars show the point at which certain image assets are being rendered. In this case, the end point of the first bar indicates when the user actually sees the content get rendered, which is 0.235 seconds after the request was issued. As previously noted, the total page content was delivered to the browser in 0.235 seconds, which consisted of four total network round trips.
Based on the brief analysis of this data, we can conclude that this is an example of a page that is well optimized for performance. This is evident from the low number of HTTP requests, the size of the data being downloaded, and the use of several other best practices, all of which we will discuss later in this chapter. As an experiment, download a free copy of HTTPWatch and use it yourself against a few of your favorite pages. You may be surprised by what you find. Although the capabilities of the free version of HTTPWatch will be limited, you will quickly obtain a visual representation of your page performance.
Although this was a simple example, it does provide interesting data points that help depict the page load characteristics of the Live Search Web application. Tools like HTTPWatch and Fiddler provide developers the ability to evaluate the detailed HTTP information being transferred between the server and the browser, so each page load behavior can be better understood, and performance problems can be prevented. When combined with packet sniffing tools like Network Monitor, developers can quickly gain insight into the end-to-end page load characteristics from the network layer to the Web browser. In general, this toolset will allow Web application developers to get a better understanding for what their users are experiencing, so that performance issues or bottlenecks can be avoided before the application is released.