
You have the choice between live or post-mortem debugging. With live debugging, the debugger attaches to a running application. Live debugging is intrusive, and the program may be modified in the process of being debugged. It can affect the performance or even interrupt an application. For example, applying a breakpoint will modify an application. An int 3 assembly instruction is inserted into the application for the breakpoint. Imagine the repercussions of hitting a breakpoint on a production Web application while it is servicing requests from hundreds of users. Disastrous is an apropos description. Live debugging is appropriate on a development or test machine, where customers are not likely to be affected. Post-mortem debugging uses a snapshot of the application. You can then debug the application from the snapshot. The most useful snapshot is a dump. Once the dump is generated, you can debug the application anywhere. You do not have to debug on the production machine.
Debugging from a dump (post-mortem) is different from live debugging. As you know, a dump is a snapshot and not the actual running program. Therefore, you cannot perform any task that would assume a running application. Here are some tasks that cannot be done when debugging a dump:
Set a breakpoint
Suspend a thread
Change memory state
Load modules
As with live debugging, symbols are useful with post-mortem debugging. However, symbols from the operating environment where the dump was created are needed. Based on that, the symbols required to debug the dump may be different from the symbols for the local machine. If you have dumps on your local computer created in Windows 2000 Professional, Windows XP, and Windows Server 2003, then symbols are required for those three operating systems. The easiest way to gather these symbols is to use the Microsoft public server to automatically download the correct symbols.
Not every dump is the same. Dumps can be created with varying amounts of detail. The terms full dump and mini dump are commonly used to describe dumps. A full dump minimally includes heap memory, thread information, and handle data. The primary difference is that mini dumps, unlike full dumps, do not contain heap memory. Mini dumps also do not usually have handle information. While full dumps can be gigabytes in size, mini dumps are a few megabytes or less.
You cannot create a dump for a managed application in Visual Studio. However, Windbg can create dumps for managed applications. The following command creates an appropriate dump for a managed application. Dumpname.dmp is the name of the new dump file. You must start a debugging session for the target application before creating the dump.
.dump /ma dumpname.dmp
MinidumpWriteDump is the native API for creating dumps. No wrapper exists for this API in the .NET Framework class library. However, MinidumpWriteDump API can be called directly via platform invocation. You would call the API to create a dump programmatically. This is helpful for saving dumps just in time at program failure, such as an unhandled exception. Another advantage is the ability to create various shades of dumps—not just full versus mini dump. MiniDumpWriteDump supports fifteen flavors of dumps, each with varying levels of detail. You should not call MiniDumpWriteDump on the current application. This may create a corrupt dump. MiniDumpWriteDump should be called from a separate application.
ADPlus is an alternative to writing custom code for the MiniDumpWriteDump API. ADPlus has the ability to create a dump just in time as an application crashes or hangs.
ADPlus is a debugging tool for creating dumps and log files on demand or just in time. You can download ADPlus from the Debugging Tools for Windows Web site, as described earlier. ADPlus is a vbscript that automates CDB, which is the console debugger. When using ADPlus, you are likely to see the CDB icon appear in the task bar. Do not close that CDB session! It is being used by ADPlus to create a dump for you.
ADPlus can operate in two modes: hang or crash mode.
In crash mode, associate ADPlus with the application before it crashes. When the application raises an exception or crashes, ADPlus will create a dump just in time.
In hang mode, associate ADPlus with the application before or after the application hangs. Deciphering when an application hangs is a subjective observation; you must decide that this has occurred. Open the related debugger session, and press Ctrl+C to create the dump on demand.
When ADPlus is started, several message boxes are displayed to the user. This includes notifying the user of the output directory where ADPlus files are written. If you run in the quiet mode (the –quiet option), ADPlus will not display any of the message boxes.
ADPlus can send you an alert when an application crashes. In crash mode, start ADPlus with the notify option. When the application crashes, you will be alerted via Windows messenger service. This is a convenient option that can improve your productivity.
ADPlus will create a mini dump and log file for most first chance exceptions. For second chance exceptions, a full dump is created. When an application crashes or hangs, ADPlus creates the following files.
ADPlus_report.txt. This file contains version information about ADPlus, command-line arguments and other status information on the debugging script.
Log file. The log file contains debugging commands run on the application. The log file contains the call stack for each thread and separately a complete list of modules.
Process_List.txt. This file contains the list of processes running at the time the crash or hang occurred.
A new feature of ADPlus is a configuration file. This allows you to create and save complicated ADPlus environments.
You can configure ADPlus from the command line. However, entering a complicated configuration from the command line is often inconvenient and sometimes not possible. Configuration files can save the day. You can enter in complicated configurations and save them for future reuse. Configuring ADPlus properly may be a challenge for administrators, testers, or support engineers. Developers can now configure ADPlus in a configuration file that is provided to non-technical staff. Finally, the configuration file extends the behavior of the command line. Conditional statements are just one example of an option available in the configuration file that is not available from the command line.
Here is a sample ADPlus configuration file:
<adplus>
  <settings>
      <runmode>crash</runmode>
      <option>quiet</option>
      <outputdir>c:dumps</outputdir>
  </settings>
  <precommands>
      <cmd>.loadby sos mscorwks</cmd>
      <cmd>!eeversion</cmd>
  </precommands>
  <exceptions>
      <option>nodumponfirstchance</option>
      <config>
          <code>dz</code>
          <actions1>log;stack;eventlog</actions1>
          <customactions1>dd ebp</customactions1>
       </config>
       <config>
           <code>clr</code>
           <actions1>log;stack;eventlog</actions1>
           <customactions1>!stoponexception system.accessviolationexception 1;
               .if(@$t1==1){.dump /ma c:\dumps\mydump.dmp }
           </customactions1>
      </config>
  </exceptions>
</adplus>
Let us examine the above configuration file:
<settings> element. The settings element sets the operational mode of ADPlus. In the preceding example, ADPlus is set to run in crash mode, quietly, and the output directory is c:dumps.
<precommands> element. The precommands element sets commands to run when ADPlus is first attached to the application. In the example, SOS is loaded for managed debugging. Next, the version of the .NET runtime is displayed.
<exceptions> element. The exceptions element defines exception handling. You can handle multiple exceptions, each described in a separate <config> section.
<code> element. The code element defines the exception type. The dz type is the divide-by-zero exception, while clr is for Common Language Runtime exceptions.
<actions1> element. The actions1 element has the commands to be executed upon a first chance exception. This is the exception defined in the Code element. In our example, the Log, Stack, and Eventlog keywords are used. The Log keyword means to log the exception. The Stack keyword displays the call stack for the thread where the exception occurred. The Eventlog keyword means the exception is recorded in the event log. The Actions2 element is similar but used with second chance exceptions.
<customactions1> element. Enter specific debugging commands in the customactions1 element. These commands will be run when a first chance exception occurs. The type of exception is defined in the Code element. The second customactions1 in the example configuration file is more complex. It demonstrates how to trap specific managed exceptions. When a System.AccessViolationException occurs, the mydump.dmp is created. The double slashes (\) in c:\dumps\mydump.dmp are translated into single slashes, which is appropriate for delimiting a path.
The perfect application does not exist. Historically, applications have been short run. You start an application, perform a discrete task, and then shut down the program. The application is restarted for the next task. In this scenario, the program does not execute long enough for problems to accumulate. For example, memory leaks do not have time to accumulate and potentially crash the program. However, the paradigm has changed with Web applications. Web applications run for an extended period of time—several days and even months. Small problems that were inconsequential before can accumulate and become a considerable issue. For this reason, the ASP.NET worker process may be recycled. Proactive recycling recycles an otherwise healthy application. This will periodically give you a fresh worker process to handle future requests. This is helpful in preventing denial of service attacks on a Web server. For example, the worker process can recycle after a specified number of requests. Reactive recycling recycles the worker process when a problem occurs. For example, the worker process can be recycled when memory exceeds a set threshold.
When the worker process recycles, current requests are completed by the active worker process. A new worker process is started that handles future requests. The old worker process exits after handling the final request. The recycling of the worker process is then reported in the event log. You can always check the event log to determine if the worker process has been recycled and the reason for it.
For IIS 6.0, worker process recycling is controlled by the processModel tag in the web.config file. The processModel tag is allowed solely in the root web.config file. In addition, the allowDefinition attribute of the tag must be set to Everywhere. 9-3 lists some of the relevant attributes.
Table 9-3. Attributes Of The ProcessModel Tag That Affect Recycling
Attribute | Description |
|---|---|
requestLimit | The number of requests allowed before the worker process is restarted. Default is infinite. |
responseDeadlockInterval | The time allowed for outstanding requests not to respond before recycling the worker process. |
memoryLimit | Percentage of virtual memory (relative to the system) that the worker process can use before it is recycled. Default is 60. |
Timeout | The number of minutes before a worker process is recycled. Default is infinite. |
For IIS 7, you configure worker process recycling through the application pool. First, start IIS 7.0. Open the context menu for a specific application pool. Select Recycling. The Edit Application Pool Recycling Settings window will open. Select the appropriate recycling options, and enter parameters in the related text box. See 9-8.
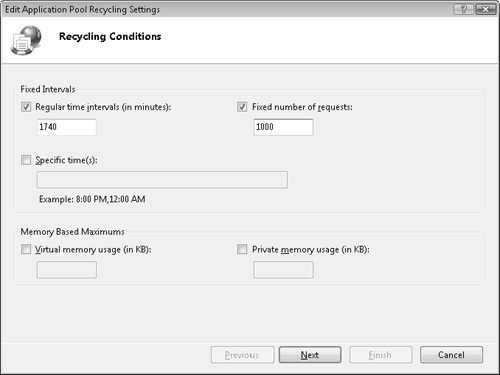
Figure 9-8. Edit Application Pool Recycling Settings window for configuring recycling of the worker process.
When a worker process recycles, that is usually, but not always, an indication of a problem. Getting a dump at the moment would be useful for post-mortem analysis. You can use ADPlus to create a dump when the worker process is recycled. The following ADPlus configuration file accomplishes this task. The ExitProcess function is called just before the worker process is recycled. You can set a breakpoint on that function and create a dump at that very moment.
<ADPlus>
    <Settings>

        <RunMode>crash</RunMode>
    </Settings>
    <Breakpoints>
        <NewBP>
            <Address>kernel32!ExitProcess</Address>
            <Type>bp</Type>
            <Actions>FullDump</Actions>
            <ReturnAction>G</ReturnAction>
        </NewBP>
    </Breakpoints>
</ADPlus>
Here are the specifics pertaining to the configuration file.
The NewBP element sets a breakpoint.
The Address element specifies a breakpoint at kernel32!ExitProcess. ExitProcess is located in kernel32.dll.
The Actions element indicates that a full dump should be created when the breakpoint is hit.
The ReturnAction element indicates that, after the dump is created, regular program execution should continue. "G" is for go. The worker process will then be recycled.
Finally, ADPlus can capture the state of a Web application. Run ADPlus in crash mode on the worker process, which is w3wp.exe. However, for the complete picture of a Web application, you should run ADPlus on inetinfo.exe and dllhost.exe also. Run ADPlus on these programs individually. Alternatively, run ADPlus with the IIS option. The following command will automatically attach to w3wp.exe, inetinfo.exe, and dllhost.exe.
adplus -hang -IIS