
Whether debugging a release or debug version of an application, symbols make debugging more user friendly. With symbols, you don’t have to manually interpret addresses for function names or line numbers for source code. Symbols provide symbolic names, source code line resolution, and other information when debugging. The symbol engine uses this information to convert symbolic information into memory addresses and vice versa. The source code information in a symbol file facilitates the setting of breakpoints using line numbers. When debugging a managed application, some of this symbolic information is available via reflection. However, reflection cannot provide everything, such as the names of local variable and source code information. Here are two partial listings of a call stack. Both listing were done in Windbg. For this example, Windbg was attached to Notepad. The first listing displays a call stack when the appropriate symbols are not available. Each row of information represents a stack frame or generally a method call. Each row ends with an offset that references the function relative to the module (Notepad). Is the function name apparent? No.
ChildEBP RetAddr Args to Child

000bf950 00941971 00940000 00000000 000d316f notepad+0x149c

000bf9e0 76983833 7ffdb000 000bfa2c 77bea9bd notepad+0x1971
Next is the call stack when the symbols are available. The function name is apparent and appears at the end of each row. The call stack is more readable and that makes debugging easier. This highlights another benefit of symbols—increased productivity. Symbols allow you to focus on debugging rather than the challenges of interpreting low-level memory addresses.
ChildEBP RetAddr Args to Child

000bf950 00941971 00940000 00000000 000d316f notepad!WinMain+0xec

000bf9e0 76983833 7ffdb000 000bfa2c 77bea9bd notepad!_initterm_e+0x1a1
The debugging engine and symbol server are required by any application needing symbol resolution. The debugging engine is dbghelp.dll, while the default symbol server for Windows is symsrv.dll. You can download a complimentary copy of both from the Downloading Tools for Windows Web site (more about this later). The debugging engine and symbol server are also distributed with some compilers and debuggers, such as Visual Studio.
Program Database (PDB) files are the current format for symbol files. In the past, there have been several formats for symbol files, such as COFF, Codeview, and C7. Some of these formats embedded the symbols in the binary. The PDB format stores symbols in a separate file. Placing the symbols in a separate file reduces the footprint of the application. However, this creates a potential version problem when matching a symbol file with an incorrect application. To help prevent this problem, the application contains the fully qualified name and path for the related PDB file. This is a hard-coded path. For versioning, an identical globally unique identifier (GUID) is placed in the assembly and PDB. You can display the GUID of the assembly with the dumpbin utility: dumpbin /headers assemblyname. This GUID is checked to confirm that version of the symbol file is correct for the target assembly or binary. When looking for a symbol file for an application, debuggers generally first check the embedded symbol path for the correct symbols. Second, the directory from where the assembly loaded is checked. Visual Studio will not allow you to use the incorrect version of a symbol file. That is also the default behavior of Windbg. However, you have the ability in Windbg to override this behavior and use a disparate version of an assembly and symbol file. This is done with the symopt command.
Convenient debugging requires both product and operating system symbols. You provide the product symbols, while Microsoft provides the operating system symbols. The Microsoft symbols can be downloaded from the Debugging Tools for Windows Web site. The link is provided later. Alternatively, most debuggers can be configured to download the operating system symbols automatically.
You may also need symbols for any third-party assemblies or binaries that are integrated in your application. It is important to check for availability of symbols before acquiring third-party products. Do not assume that symbols are automatically provided. This is a frequent mistake. Some vendors do not provide symbols to avoid disclosing proprietary information. Alternatively, they may provide public (stripped) symbols, which contain enough information to accurately depict a call stack but not much more.
For native debugging, there is the concept of public versus private symbols. The differences are as listed in 9-1. Private symbols are created by a company for their employees, partners, and others with a close relationship with the company. Because of the closeness of the relationship, there is a high level of trust. For this reason, private symbols are not filtered and contain full symbols necessary for debugging. Specifically, private symbol files contain both private and public symbol information. Conversely, public symbol files are for customers and are stripped of nearly everything. For this reason, public symbol files are also called stripped symbols. A public symbol file only includes the public symbols. You can configure Visual Studio to create a stripped symbol file. From the Project menu, choose Properties. From the Linker item, select the Debugging pane. Enter the location to create the stripped symbol file in the Strip Private Symbols option. Alternatively, you can also create stripped symbols using the PDBCopy tool, which is included in the Debugging Tools for Windows. PDBCopy can create a public symbol file from private symbol file.
Table 9-1. A Comparison of Private versus Public Symbols
Private Symbols | Public Symbols |
|---|---|
Static and non-static functions | Non-static functions |
Global variables | Global variables |
Local variables | |
Source file and line number information | |
User-defined type information |
Maintain separate symbols for each public or released version of a product. This means having symbol sets for all versions of the product available to customers. Customer support problems, and there will be some, may necessitate debugging a specific version of the product. You need the specific symbols for that version. Re-creating symbols for that version after the fact may be difficult, if not impossible. For example, the original compiler that created the application may no longer available. Of course, maintaining multiple versions of symbols could be a challenge. Symbol servers to the rescue!
A symbol server locates required symbols, which are then downloaded to a local cache. You can download from multiple symbol stores. It is recommended to download symbols from the closest symbol store first. Download from the furthest symbol store last because it is the least efficient. The symbol path sets the search path to locate and download missing symbols. Each debugger has a specific way for setting the symbol path. However, you can also set the symbol path using the _NT_SYMBOL_PATH environment variable. Most debuggers read this environment variable to obtain the default symbol path. This provides a convenient location to set the symbol path once for multiple debuggers. The following is the syntax for setting the symbol path.
SRV*downloadcache*symbolstore1*symbolstore2*symstore3
The first item of the symbol path is SRV. SRV refers to the symsrv.dll symbol server. The next item is the download cache. A debugger will load the symbols first from the download cache. If required symbols are not found there, the symbol server will attempt to download those symbols from symstore1 to the download cache. From there, the debugger can access the symbol. For symbols in neither the local cache nor symstore1, symstore2 is searched, and so on. Here is a typical symbol path.
SRV*c:symbols*f://symbols/ossymbols*http://msdl.microsoft.com/download/symbols
Microsoft has made available a symbol store, which contains operating systems’ symbols and some binaries. The address is http://msdl.microsoft.com/download/symbols. This symbol store contains only public, or stripped, symbols.
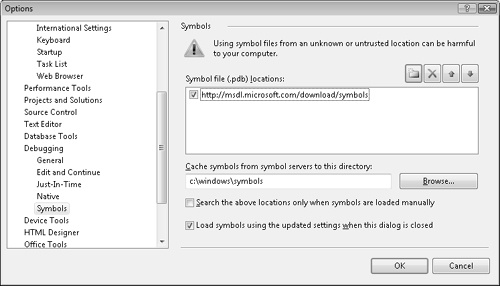
You should also enter the symbol path directly into Visual Studio. From the menu, choose Tools and then Options. From the Options dialog box, select Debugging, and then select Symbols. The Symbols pane will appear. (See 9-1.) Enter the location of the local cache in the Cache Symbols From Symbol Servers To This Directory text box. Add the search paths in the Symbol File (.pdb) Locations list box. The symbol server will search the list top-down.
Vendors, such as Microsoft, provide symbol stores that are connected to by symbol servers. A symbol store is a repository of symbols for an operating system or product. The repository contains a set of symbols for each version and iteration of the product. Before the advent of symbol servers, you were responsible for finding and downloading the correct symbols. This can be daunting for a product such as an operating system. For most of us, that is Microsoft Windows. There is a variety of sets of symbols for the various iterations of the operating system over a span of several years. Furthermore, there are occasions when the symbols required are not the ones for your local operating system. This is often true with dumps, which may have been created on another machine in a different operating environment. In these situations, having the correct symbols automatically downloaded from a symbol store is invaluable.
You can create a symbol store for your product to download the appropriate symbols to peers, partners, or clients. Symstore.exe is a utility provided by Microsoft. Use this tool to create a symbol store for your product. You can then publish the symbol store as a public share or a server available outside the local domain. Download symstore.exe at the Debugging Tools for Windows Web site.
In addition to symbols, effective debugging often requires the source code files. Without appropriate symbols, you sometimes must convert arcane memory addresses while debugging. Without the source code files, debugging code requires reading disassembly, which can be equally arcane. The source server can automatically download source files related to a particular assembly.
The default location of source code files are written into the PDB file. The PDB file contains the fully qualified path and name of each source file in the project when the assembly was built. Using source control tools, the version number can be added to the source file reference. In addition, statements for retrieving the source file from source control are written into the PDB file. The process of adding this information is called source indexing. The debugger uses the information written into the PDB file to automatically retrieve the correct source files from the related source control program. This assumes your source control program is known to the source control tools provided by Microsoft. If not, these tools are extensible. Using Perl, you can extend the existing source control tools to update a PDB file with commands to retrieve code from most any source control program. The following source control programs are supported by default.
Srvsrc.dll is the standard source server and is installed with the Debugging Tools for Windows. The source server depends on indexed PDB files. Source control tools for indexing a PDB file are installed with the Debugging Tools for Windows. They are placed in the srcsrv subdirectory of the install directory. The following is the list of source control files and tools:
Srvsrv.ini. Srvsrv.ini is a configuration file for the source server (srvsrc.dll). The source server reads this file, if available, at startup for proper configuration instructions. Some of the information included in the configuration is the location of source servers.
SSIndex.cmd. SSIndex.cmd is a Perl script. SSIndex first assembles a list of source files from the target project. Second, it compares this list with the list of source files in each PDB file. All matches are recorded. Finally, SSIndex uses PdbStr to actually index the PDB file with this information, including the commands necessary to retrieve those files from source control.
SrcTool.exe. SrcTool.exe is a tool that reads from a PDB file the list of indexed source files. The list includes the fully qualified path, version number, and other information pertaining to the indexed file.
PdbStr.exe. PdbStr.exe writes the stream that indexes a PDB file.
John Robbins has written a helpful article about source indexing and using the various source control tools. Here is the link: http://msdn.microsoft.com/en-us/magazine/cc163563.aspx.
The source path is a list of directories and it lists in what order to search for source files. Each debugger has a different procedure for setting the source path. Alternatively, you can create the _NT_SOURCE_PATH environment variable. Some debuggers, such as Windbg, will check this environment variable at startup for the default source path.
We have now discussed symbol and source servers as part of the preparation for debugging. It is time to discuss actual debugging. This chapter is as much about preventing problems as it is about finding bugs after the fact. Any problem you preempt early may prevent a crisis later. Taking a preemptive approach to debugging can translate into substantial time and financial savings.