
16
Organizational Structure, Performance Measurement, and Cost Systems
I’VE DEVOTED CONSIDERABLE DISCUSSION to the need for a mind-set change to support the implementation of QRM. The preceding chapter identified the types of thinking that need to be changed and mechanisms for accomplishing the change, and the following chapter provides concrete steps to implementing QRM, including steps for creating the new mind-set in the company. In order to support such a mind-set change, however, you need to thoroughly rethink existing performance measures. Otherwise your QRM efforts are doomed to fail because your traditional measures will continue to reinforce the traditional mind-set. I’ve given examples on the pitfalls of traditional performance measures. This chapter provides more precise statements of those problems and presents new measures that are based squarely in the QRM approach.
Although one aim of performance measurement is to show people such as stockholders how a company is doing, another equally important aim is to motivate and reward the company’s employees. Since QRM requires a new organizational structure, the incentive and reward schemes must also be consistent with this structure.
Performance measurement is also intimately tied to the cost accounting system. Again, this is for similar reasons: one, the company must have an accepted way of reporting its status to its stockholders; and two, managers need to have controls in place to ensure fiscal responsibility and against which their performance can be measured. So a third topic in this chapter concerns issues of accounting. However, this will not be another discussion on the need for whole new accounting systems such as activity-based costing (ABC). Instead, I will provide two simple remedies that you can use to supplement existing accounting systems to enable them to better support your QRM implementation.
From this discussion, you’ll see that performance measurement, organization structure, and accounting systems are three facets of the same issue. This chapter looks at these facets and presents a unified approach for dealing with this trio—for you cannot tackle one facet without considering the others.
DRAWBACKS OF TRADITIONAL MEASURES
Traditional measures employed in manufacturing companies are either financial measures, or metrics derived from cost-based strategy. I’ve discussed at length the pitfalls, from a QRM point of view, of two such derivative measures—utilization and efficiency. Now let’s discuss the drawbacks of traditional measures in general.
The purpose of financial accounting is to ensure that the basic fiduciary responsibility of the company is carried out for its stockholders, for government reporting, for potential investors, and for other people outside of the company. The aim of management accounting, on the other hand, is to provide information to people within the company to help them in running the company effectively. Both these aims seem reasonable; for example, if one is to invest in a company, then one wants reassurance that its financial health has been measured according to some generally accepted practices. Similarly, if one wants to hold management accountable for the health of the company, there should be measures by which you can judge if managers are doing their job. Ironically, our use of the metaphor “holding management accountable” serves to illustrate how deep in the marrow of our society—in the marrow of our language even—is the connection between accounting and measurement of managers! In principle, then, both these aims should serve companies and their stockholders well. In practice, there are problems with each.
The First Problem—Preoccupation with Financial Measures
The preoccupation with financial measures is exacerbated by the way the stock market works. In today’s financial markets, institutional investors such as mutual funds own a large proportion of company stocks. The managers of these funds are driven (by their performance measures) to show short-term returns on their portfolio.1 So they, in turn, exert pressure on the companies whose stock they own, for them to show returns. Since mutual funds have substantial shareholdings, their managers command a significant amount of attention at these companies. This means executives at the companies have an incentive to show short-term returns or else risk having their stock “dumped” with disastrous consequences for their stock price. This financial “bottom-line” view percolates down to each performance measure used at each level of the company. Every lower level measure is meant to tie in to some financial measure, and by motivating managers to improve these measures the company hopes to make its overall financial health look good.
The Second Problem—No Room for Manufacturing Strategy
The second problem is therefore a consequence of this tendency to be preoccupied with financial measures. Although management accounting is intended to help managers run the company effectively, traditional accounting practices require a strong link between the financial accounting reports and the management accounting numbers. As a result, the management accounting systems end up being driven by the bottom-line measures desired from the financial accounting systems.
The upshot of all this is that there is no room for long-term manufacturing strategy. Not only do employees have little incentive to work on efforts that have a long-term return, but even at the investor level, most decisions are made based on financial measures with little appreciation for manufacturing strategy. Two examples serve to drive each of these points home.
Example One: A President’s Talk
In 1995 I was invited to speak to the managers of a company that made industrial equipment. I was instructed that the company was placing a great deal of emphasis on lead time reduction, and that my purpose was to help create the new mind-set that would enable them to apply QRM methods. Immediately prior to my talk, the president of the company spent half an hour showing the managers his vision for the company over the next decade. He displayed chart after chart with sales numbers on each product line, sales growth in different markets, market share, and profitability. Then he followed with charts about goals for individual department costs and profitability. Having been revved up about the importance of QRM for the company, I kept waiting for the charts with specific lead time goals to appear. They never did.
Example Two: An Annual Report
I gave this second example in Chapter 3 so I will repeat it briefly. In 1996 I was asked to deliver a training session for the management of a publicly owned company in the packaging industry. Again, I was told short delivery time was essential in their industry and all their divisions were working hard at reducing their lead times. Prior to the seminar I received the annual report for this company. Although it contained descriptions of the company strategy and many performance statistics, nothing in the report mentioned or measured responsiveness. Since annual reports are a key instrument used by potential investors, it is clear that companies, their managers, and their stockholders only want to see the bottom line in financial terms. On the other hand, as I’ve shown in many places in this book, many financial measures will only show short-term health if the company takes decisions that run counter to QRM.
Consequences of Traditional Measurement Systems
The preceding stories make the case that both management and financial accounting methods are not sufficiently synchronized with manufacturing strategy. It is not surprising, then, that statements such as the following abound in today’s literature:
The following points make concrete the drawbacks of traditional accounting methods and related performance measures:
- Traditional cost-based performance measures motivate employees and managers to do the wrong things. In the context of QRM, I’ve provided many examples of measures such as “efficiency,” “unit cost,” and “utilization,” which promote behavior resulting in increasing lead times. Worse, even in an apparently enlightened company that implements a time-based strategy, the weight of the traditional entrenched measures can cause it to abandon that strategy and revert to cost-based manufacturing methods: “A stubborn refusal to abandon traditional performance measures put the brakes on an automotive supplier’s efforts to compete.”3
- Traditional measures mislead company managers and result in poor strategic decisions. Incorrect understanding of overhead costs, and thus invalid allocation of these costs, can result in cost distortion to the point where companies pursue product lines that actually cause them to lose money, while giving up their profitable product lines. In a similar way, a purely financial approach to measurement, combined with a superficial understanding of overhead costs, has led to companies closing down portions of their operation and outsourcing the production of those parts. This, in turn, led to more overhead being allocated to the production of fewer parts, which were then deemed to be too costly and, as a result, were outsourced. Eventually such a spiral led to the closure of whole divisions of companies.4
- Traditional measures were designed for traditional management methods. The traditional organization has a hierarchical structure with functional departments. Each department has cost goals and other goals based on measures like utilization and efficiency. Top managers in divisions have aggregate goals, which they translate into targets for their subordinates. These managers, in turn, translate the targets into goals for the people working for them, and so on. Traditional reporting systems are therefore designed to produce reports for each layer of this hierarchy to ensure that the goals at its level are being met.
- Cost-based measures are not cell-oriented. QRM’s approach to the role of people in the organization is fundamentally different. The traditional approach views each person as a specialized resource that has to perform at a certain rate in order to justify its cost. However, QRM views the organization as composed of cellular teams that own processes that deliver products to their customers. Existing management systems typically have little in terms of reports to measure the effectiveness of this type of organization in achieving these particular goals.
- Cost-based measures are backward looking. Effective manufacturing strategy today requires a clear vision of where a company should be headed. Yet most reporting systems, and financial systems in particular, only tell management where the company has been, not where it is going. To drive this point home, ask yourself, how effectively could you drive a car if you were only allowed to look in the rear-view mirror?
It is not my purpose in this book to reinvent accounting systems; considerable effort has been spent over the last decade in designing new systems that do a better job of allocating overhead. Also, much work has gone into rethinking financial justification methods. My goal is to make the reader aware of the drawbacks of traditional measures so that the company is willing to let go of its attachment to them, and second, to focus on new measurement systems that are relevant to the QRM effort.
NEW MEASURE OF PERFORMANCE-INTRODUCING THE QRM NUMBER
I’ve emphasized that if you are concerned about lead time you should measure lead time. This much is not new; others have made the observation that despite making noises about long lead times and late deliveries, management does not put sufficient emphasis on measurement of lead time.5 However, I have an additional observation. QRM is not just about lead time and meeting certain lead time targets. QRM is about lead time reduction. So if management desires the benefits of QRM, then it should reward lead time reduction. To do this management needs a fair and equitable measure of lead time reduction. However, in the last decade I have not seen any measures that truly fit the bill. As Tom Malone, president of Miliken, said, “If you are not measuring it, then you can’t be serious about it.”6 Therefore, in order to help companies be serious about lead time reduction, I have developed a new measure suited to this task. It is called the QRM Number. This number can be used to measure an individual cell, a set of cells, or a whole factory.
In order to establish the QRM Number for any entity, say a given cell, you first measure the lead time of that cell for jobs over an initial period, called the base period. (Even the task of just measuring lead time can be tricky; in the next section I will discuss more precisely how to measure lead time, along with potential pitfalls in this process.) The average lead time over the base period will be called the base lead time. Then, for any subsequent measurement period (e.g., each quarter), you also measure the average lead time during that period, which is called the current lead time. The QRM Number of the cell, for the current measurement period, is then defined as:
Note, in particular, that the current period’s lead time is in the denominator. The reason for this choice will become clear.
To make this approach concrete, let us consider a newly established manufacturing cell. After the cell is in place and functioning, you measure the average lead time for the first quarter. Suppose this is 12 days. Thus the base lead time is established at 12 days. In the second quarter, through several obvious improvements put in place by the cell team, the average lead time drops to 10 days. By the third quarter, the team is working well together, many ideas for continuous improvement emerge and are implemented, and the team manages to bring the average lead time down another 2 days, to 8 days. In the fourth quarter, the pace of improvement seems to slow down. The team has detected most of the obvious problems and put in place the easy solutions, so in this quarter they only reduce the lead time by 1 more day, to 7 days, on average. How does this performance stack up using the QRM Number?
Table 16-1 summarizes the calculations for this cell. By putting the lead time numbers in the formula above you derive the QRM Number for each quarter. (The QRM Number for the first quarter, which is also the base, is 100. The base period will always have the value of 100, as is obvious from the formula.)
| Calendar Quarter | Average Lead Time | Details of Calculation | QRM Number |
|---|---|---|---|
| 1. Jan.-Mar. | 12 days |
|
100 |
| 2. Apr.-Jun. | 10 days |
|
120 |
| 3. Jul.-Sep. | 8 days |
|
150 |
| 4. Oct.-Dec. | 7 days |
|
171 |
Desirable Properties of the QRM Number
At this point you might ask, why such a complicated procedure? Why not just record the average lead time, which is in the second column, and make it the team’s goal to bring this number down? The QRM Number has the following attractive properties:
- The desired performance results in an increasing number. A fundamental rule of performance measurement is that humans react better to graphs and numbers going up, as opposed to going down. As stated by one expert, “Psychologically, people are motivated more by seeing the results of their improvement as an increase in the measures, a graph going upward, rather than by seeing a reduction.”7 Clearly, if the desired performance is reduction in lead time, then graphing raw lead time (Figure 16-1) results in a graph going down when the team is doing well and going up when the team is doing poorly—this is the opposite of the expert rule. On the other hand, graphing the QRM Number (Figure 16-2) gives the desired properties.

Figure 16-1. Average Lead Time for a Manufacturing Cell
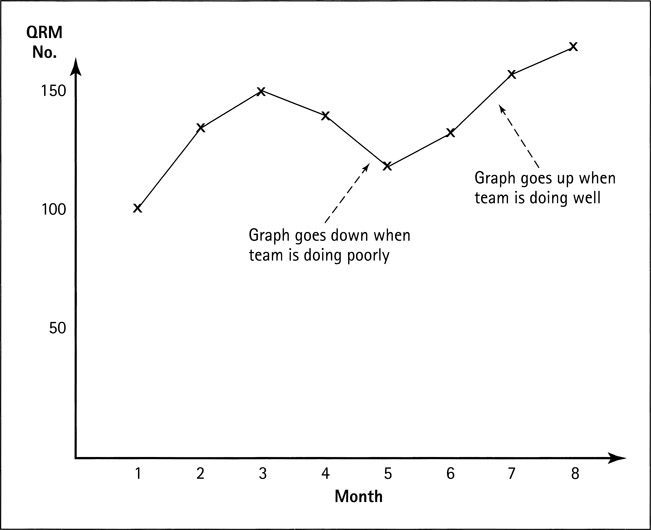
Figure 16-2. The QRM Number for the Same Manufacturing Cell
-
An equal reduction of lead time in the future produces a larger increase in the measure. To illustrate this property, consider the cell’s improvement from the first to the second quarter. The team cut its lead time by 2 days, and the QRM Number went up by 20 (from 100 to 120). Now consider the change from the second to the third quarter. This was also a reduction of 2 days—the exact same amount—but the QRM Number went up by 30 (from 120 to 150). Why should this be, and is it reasonable?
Intuitively, it is indeed reasonable to show a higher QRM Number increase for the second improvement. You would expect that, compared with the reduction from 12 to 10 days, it would be harder to reduce lead time from 10 to 8 days, for two reasons: one, the percentage reduction is greater for the second improvement, and two, there are usually fewer opportunities remaining the second time around—the easiest and most obvious steps are implemented right away, leaving the harder problems and more difficult solutions for later. So it seems fair to give the team more recognition for cutting the lead time by 2 days the second time around. The QRM Number does exactly that.
- The QRM Number continues to motivate people, even when additional lead time reduction becomes difficult. This is an extension of the previous observation. Consider a team that has reduced lead time from 12 to 6 days and appears to be approaching the limits of its ability to improve. A conventional graph, just plotting the raw lead time, would make it appear that improvements have almost stalled (Figure 16-3). Yet the QRM Number continues to motivate people, because even small improvements will create significant increases in the QRM Number graph (Figure 16-4).

Figure 16-3. The Average Lead Time Graph Plateaus
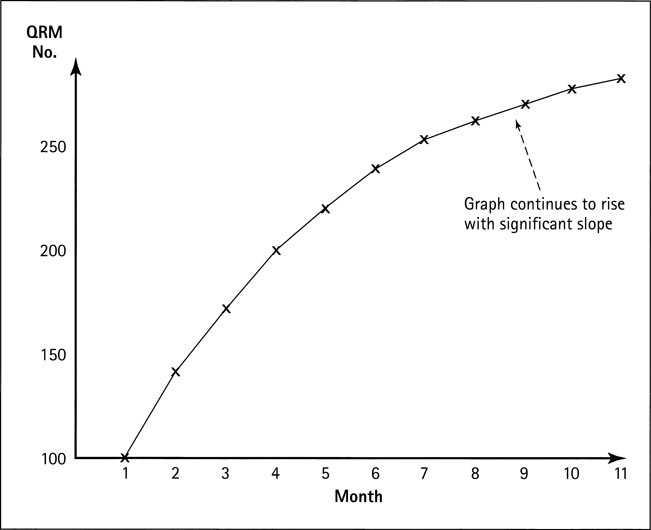
Figure 16-4. Increase in the QRM Number for the Same Time Period
-
It provides a single unified measure that can be used throughout the organization, regardless of team size or type of work. You can use the QRM Number to compare different teams across the organization: manufacturing cells, office cells, entire factories, and even whole organizations with each other. For example, consider a company that implements three cells: a manufacturing cell that has a base lead time of 14 days, an assembly cell with a base lead time of 6 days, and a Q-ROC with a base lead time of 3 days. While the manufacturing cell may cut its lead time by 1 day quite easily, the Q-ROC may struggle to take even half a day out of its lead time. In this environment, the QRM Number is the great equalizer. You can judge all three cells on a relatively equal footing by looking at their QRM numbers. In fact, management can use this approach to foster a spirit of friendly competition between teams across the company.
In addition to measuring individual teams, you can use the QRM Number to measure groups of teams to compare whole market segments or entire factories. Suppose, in the previous example, that the Q-ROC, the manufacturing cell and the assembly cell together serve a focused target market subsegment (FTMS), which was defined in Chapter 11. Customer orders arrive at the Q-ROC which does the order entry, along with some design work and preparation of manufacturing routings. Then the orders are released to the manufacturing cell for parts fabrication, and the final product is put together in the assembly cell. In this case, you could measure the three cells together by another QRM Number, which would help management track the improvement seen by the end customer. The overall team for this FTMS would start its QRM Number with a base lead time of 23 days (3 + 14 + 6). Management would not need to choose between this measure and the individual team measures. They should publish both, because they serve different and complementary purposes. The individual team measure motivates improvement within each cell; the overall measure encourages improvement across cells. You could also use the overall measure to foster competition between this FTMS and groups of teams serving other FTMSs. In the same way, entire factories or organizations could be measured as well. Using this approach, we could compare a factory in Wisconsin making electric motors with one in North Carolina making complex parts for aircraft, and still feel that it was fair to compare these very different organizations.
Problems with Alternative Lead Time Measures
As the alert reader already will have deduced, the QRM Number is none other than a measure of speed, normalized to allow measurement across different teams. Other similar measures could be proposed; one such measure might be the percentage of lead time reduction, which would also be normalized across teams since it could be a percentage of the base lead time. It also has the property of being an increasing number: The more lead time is reduced, the higher is the percentage reduction. However, the problem with this measure is that after initial improvements, as teams face harder and harder targets, using this measure their progress will appear to have stalled.
Another measure used by some companies, including several leading electronics firms, is a cycle time ratio. Two alternatives have been proposed for this; one is simply the reciprocal of the other. The first measure, which we call Ratio A, is defined as the ratio of value-added time to total lead time (also called cycle time in these companies):
For example, if the value-added time in a manufacturing cell (e.g., the time a part is actually being machined) is 3 hours, while the lead time is 25 hours, then Ratio A has the value 0.12 for this cell. The aim in these companies is to increase this ratio, because they want to maximize the proportion of time that value is being added. However, there are two immediate drawbacks to using this ratio.
- If a team discovers how to reduce value-added time, for example, by eliminating an operation or speeding up an operation, the team might end up being penalized for this improvement, because the ratio will go down unless the proportional reduction in lead time is at least as great. For instance, if an operator in the above cell eliminates a 15-minute deburring operation, bringing the value-added time down to 2.75 hours, but the lead time only goes down by 45 minutes to 24.25 hours (this will be the case if the deburring operation doesn’t have much queue time associated with it), then the new value of Ratio A is 0.11. The operator has made an improvement and yet the measure has gotten worse!
- This disadvantage is more subtle and is caused by the behavior just noted above. Teams soon find out that the ratio depends heavily on the value-added time, and they make every effort to increase the number that measures value-added time. Similar to traditional labor union approaches that attempted to maximize the standard times associated with each operation, incentives have been created for operators to make each value-added operation appear as long as possible, at least for the sake of measurement.
What the two behaviors above show is the fundamental principle of performance measurement: By measuring something that is not clearly related to our goal, we’ve lost sight of the goal altogether. The goal is lead time reduction. It is not clear what the connection is between Ratio A and this goal.
The other cycle time ratio measure, which we call Ratio B, is simply the inverse of the previous ratio:
For the same example as above, the value of Ratio B is 25/3, which equals 8.3. Now the goal is to make this number smaller. You can use the exact same arguments as above to show the disadvantages of this ratio as well. The QRM Number, on the other hand, is directly related to our goal of lead time reduction and does not suffer from these unexpected consequences.
KEY ISSUES IN MEASURING LEAD TIME
Although the QRM Number seems relatively straightforward and simple, there are subtle points to consider when measuring lead time, as well as pitfalls to be avoided in implementing this measure.
Some Problems in Defining Lead Time
Since the QRM Number involves the ratio of a base lead time to a current lead time, the first issue is exactly what is meant by lead time. For instance, if a cell makes the same part frequently, it can stock extra quantities of that part and then supply them to the next operation on demand, with a lead time-the time from the next operation requesting it to the time it can ship the parts-that is virtually zero. (In fact, this is what happens with a pull system, as we pointed out in Chapter 9.) However, in measuring lead time for the QRM Number you should really measure the lead time for material to flow through the whole system being measured. The manifold benefits of QRM discussed in this book result from focusing on reduction of this total time. Thus in the preceding example, the lead time should not be zero, but the time from when the raw material arrived at the cell to the time when the finished part was eventually shipped to the next operation. This is also called flow time or cycle time by some companies.
However, even with this clarification, there are some complications in ascertaining lead time. Specifically, for each job, when does the clock start ticking and when does it stop? It is important to identify these checkpoints early in the project to avoid later pitfalls. Using two examples I’ll illustrate these issues.
Example One: Office Lead Time
One company attempted to measure its lead time in order processing for a line of products, for which it had established a new Q-ROC. Data was recorded via computerized transactions at each step of the process. After they had collected several weeks of data I was asked to analyze the data to help establish a base lead time. Upon examining the data I became a little suspicious and spent some time talking to people at the front end of the process. It turned out that the first computer transaction only occurred when someone in the Q-ROC logged the order onto the computer system. However, a purchase order might arrive by mail or fax and sit in the company’s mail room, the fax area, or the in tray of the Q-ROC for up to three days. This literally doubled the premanufacturing lead time for some orders. After discussions with the Q-ROC team, we agreed that it would be best to measure the lead time from the time the order first arrived at the mail room or at the fax. Even though the team knew that these processes were not under its control, it realized that from the customer’s point of view, time was passing regardless of where the order was sitting. The team decided that in order to best serve the customer, it wanted to be responsible for the lead time as soon as the company received the written order by mail or fax.
As a result of this decision, several changes occurred in the company and in the behavior of the team. First, the team convinced management that mail room personnel should time-stamp each envelope as soon as it arrived. Second, instead of waiting for the mail room to deliver the mail, the delivery process was modified. The mail room sorted the mail into boxes for each major department. This had been done before, but now these boxes were made into pigeon holes accessible from both inside the mail room and outside. This enabled team members to visit the mail room several times a day and pick up their mail, while other departments still had the option of waiting for their mail to be delivered. Interestingly, addition of the time-stamping process, plus watching the team members pick up their mail regularly, also motivated the mail room workers to minimize delays in the process.
As regards the faxed orders, again two changes occurred. One, the team convinced management to give it a dedicated phone line and fax machine, and it publicized this phone number to its customers and related sales staff. Two, for customers that still used the company’s main fax number, the Q-ROC ensured that several times a day someone from the team went to the main fax area. As a result of all these changes they reduced lead time by one to three days for most orders.
Example Two: Manufacturing Lead Time
I was asked to review computer records of lead time for some manufacturing cells at a consumer products company. Curiously, the cell lead time seemed short enough, and yet customer service people were complaining that lead time was actually much longer and resulting in unhappy customers. As I investigated the issue, analogous to the problem with the Q-ROC’s lead time measure, I found that the measurement started when the first manufacturing operation was logged onto the computer. This was because the company was using a shopfloor control system that only “knew” a job had arrived when it was logged at the first operation. After that the system accurately tracked the job’s status through the other shop operations. However, a job might be released from the office to the shop floor and sit for days—more than two weeks in some cases—before beginning its first operation. We only found this out by going back to the paper records, which had handwritten dates from the office, and comparing those with the first-logged computer dates. The discrepancy was quite large in some cases. Worse, in looking at the difference in dates between the last office operation and the first manufacturing operation, we could not identify why there was a long delay for some jobs. Was material not available? Was the first machine backed up with too much work? Was a machine broken? Or did the job just sit because the cell did not know it was there? Whatever the reason, the data gave us no insight.
Guidelines for Lead Time Measurement
The preceding examples crystallize some general rules that I have developed for measuring lead time.
- Identify unambiguous start and end points for the lead time. In particular, there should be no gaps in the measurement, particularly at points where there is a hand-off from one part of the company to another, or between the company and the outside. Also, be sure that the start and end points do a good job of measuring the total time for material to flow through the system, as discussed earlier in this section.
- Ensure that responsibility for each segment of lead time is clearly identified. As far as possible, give the responsibility to the Q-ROC or manufacturing cell that is handling those jobs. Even if it appears, at first glance, that this lead time is outside their control, gauge whether giving them responsibility for that segment might result in some improvements—you saw two examples of such improvements with the Q-ROC above. On the other hand, if the team is made responsible for a lead time segment over which it has little hope of influence—such as parts from a supplier whose delivery is managed by the materials department—then it could lead to frustration and even apathy regarding the lead time measure.
-
Use a “status indicator” in the recording template. This is a data field that indicates what is happening with a job at any time. The purpose of this data item is to clarify the ownership of lead time for every moment of a job’s progress through the company. You can record this manually on a sheet that accompanies each job, or better still, make it part of a computer transaction. I’ll illustrate this with a manufacturing job involving housings, starting with the lead time measurement from the moment of releasing the job from the office to manufacturing. This occurs via electronic notification to the cell that a job is ready. I’ll assume that all job data, such as blueprints and routing, are available on-line and no folder is needed. Table 16-2 shows the progress of the job and the way it is logged into the system, along with status indicators at each stage. The explanation in the table provides additional insight into use of this method.
Table 16-2. Example of the Status Indicator Use Time Status Indicator Employee Coments Explanation Oct. 4 9:30 a.m. Released Notified housings cell via electronic message. The last step in the office is to notify the appropriate cell, and change the status indicator to “Released” when this step is completed. As of 9:30 a.m., the cell now “owns” this job. Oct. 4 11:14a.m. Review The first chance the team leader gets to review the newly released job is at 11:14 a.m. As soon as she opens the record to look at the job, the status changes to “Review.“ Oct. 4 11:27 a.m. Materials Castings not here. Left voicemail and electronic message. Now the materials dept. “owns“ the lead time until the castings are delivered. Oct. 5 1:42 p.m. Ready Castings delivered to cell. Team leader notified verbally. A material-handling operator delivers the castings and changes status when delivery is complete. Oct. 5 2:28 p.m. Review The team leader again reviews the job, and assigns it to lathe #1066. Oct. 5 2:33 p.m. Queue 1066 However, since 1066 is busy, the leader puts the job in its queue. Oct. 6 8:01 a.m. Operating 1066 An operator starts the job on 1066. (The team has decided not to measure details such as setup and run, just the start and end of jobs.) Oct. 6 11:52 a.m. Queue 2001 Moved job to 2C01, m/c is busy. 2001 is a CNC mill. As soon as 1066 is complete, the job becomes part of the mill’s queue. Oct. 7 7:02 a.m. Operating 2001 An operator begins the job on the mill at 7:02 a.m. Oct. 7 7:21 a.m. Engineering Question about tolerance. Left voicemail. The operator has a question about the engineering drawing. Now engineering “owns” the lead time. Oct. 7 7:44 a.m. Operating 2001 The question is answered, and the job continues. Oct. 7 10:17 a.m. Assembly Delivered to assy. A cell operator delivers the shafts to the assembly dept. Two important issues are brought out by the table. The first is that ownership of the lead time must be clear at each moment. The advantage of this is that as lead time statistics are analyzed in the future, the company can ascertain the contribution from each team or department to overall lead time. Knowing this, each of the support functions, such as materials, will also be diligent about serving the customer (in this case the cell). Also, since times such as when the team is waiting for a casting or input from engineering are not made part of the team’s lead time, team members will not be frustrated that they are being measured on actions out of their control. The second is that even within the cell, it is useful to have some breakdown of lead time into components such as queue and operating. Additional status indicators such as “machine down” should also be added. These details will help the team’s QRM detectives in their quest for continuous improvement. The issue of how much detail to include is to be discussed by the team. On the one hand, operators might want to measure details such as setup time separately; on the other, they might prefer some autonomy on how they do a job, and only want to be responsible for total time. Such an issue should be resolved by the team.
-
Think through the units and weighting to be used. Consider a manufacturing cell that deals with orders ranging in size from one piece to 50 pieces. It is to be expected that the 50-piece order takes longer to complete. But should you compute the average lead time by weighting each order equally, or should it be weighted by the number of pieces? One could say that each order represents a customer, and each customer is important. Or one could say that large orders represent more business, or will be sent to more customers, and should receive greater weight. It could even be argued that you should weight orders by their cost or profitability—although this would lead right back to the debate on whether these numbers were fairly computed in the first place! Nevertheless, the question still remains, should the lead time for each order be counted equally, or should it be weighted in some way to account for the size or complexity of the job?
The first point to note about this question is that simply raising the issue ahead of time is important, because it makes everyone think about the goals of the team. Second, the way to answer it is addressed by the next item in this list. Third, don’t be shy to reexamine this issue after the cell has been in operation for a while. The team and management should meet and see whether the measure of lead time being used is helping the company head in the right direction in terms of QRM.
-
Use organizational goals to resolve issues of how and what to measure. One company had an ongoing debate about partially completed orders. If a customer ordered 100 parts, and 95 were completed but 5 needed to be reworked, the company would ship the 95, and then ship the next 5 later, or with another order going to the customer. The rework often involved several days of time, so the company did not want to delay the rest of the batch. Let’s say the 95 parts took 4 days and the rework took another 3 days, so that the remaining 5 parts had a 7-day lead time. The cell team wanted the lead time for the order to be measured as follows:
Customer service, on the other hand, wanted to measure the lead time based on when the order was finally completed. In this case, that would mean a lead time of 7 days. The difference between 4.15 and 7 was quite substantial and was giving rise to considerable tension between the two groups.
To resolve this issue, management went back to the original goals of their QRM program. One goal was to remain a preferred supplier of their customer. Upon checking with their customer’s materials department, they found that the customer did not record a shipment as received until it was complete. So this company’s delivery performance, as recorded by the customer, was based on receipt of the final 5 parts. This left no ambiguity as to which mea sure the company should use.
Interestingly enough, once it was clear to the cell that their lead time was dependent on getting the full batch of parts completed, two things happened. One, the cell worked hard on improving quality and reducing the occurrence of rework, and two, the team put procedures in place to enable them to perform the rework very quickly, if it was needed. Hence our approach to this issue assisted both the company in pursuing its goals and the cell team in obtaining relevant performance improvements. You should use a similar approach of examining the organizational goals to resolve the issue of weighting of lead times, which was brought up in the preceding point.
Leveling the Playing Field
An issue with the QRM Number that you need to tackle periodically is called renormalization. Some teams that have been in place for a while and have been successful may have QRM numbers that are very high, easily 300 or more. Other teams that are relatively new or have not had as much success could have much lower numbers, around 150 or so. This might be discouraging to the point where these other teams could give up on improvements. This problem can be resolved in two ways.
First, you should set up reward systems so that the primary motivator for a team is improving its own QRM Number relative to its previous values. So the actual value of the QRM Number is less of a concern, as long as the team is working to make that value go up. Second, management should periodically renormalize all the QRM numbers. This means that at preset intervals, such as once a year, you should reset all QRM numbers to 100. You can do this by making the period with the best past performance the new base period, and the lead time during that period becomes the new base lead time. This will help to periodically level the playing field and give all teams a new and equal chance of competing with others.
Additional Attributes of Performance Measures for QRM
Although lead time reduction measured via the QRM Number is the primary measure used under QRM, secondary measures should also be used to help teams and management understand the progress of the enterprise. There are some general guidelines to be followed in the use of such measures:8
- Supplement the primary measure by a small number of secondary measures. The key word here is “small.” Too many measures create confusion and deliver a mixed message. Many leading companies have a corporate policy of focusing on no more than five measures.
-
Ensure that the measures are directly relevant to your manufacturing strategy. How does one choose these secondary measures? Let the major elements in your manufacturing strategy drive the choice.9 For example, if your strategy involves achieving certain quality standards in order to capture a given market segment, then make one of the measures relevant to quality improvement. If cross-training is critical to your strategy, then you could measure the number of skills each person has. Since this measure is aimed at the process needed, not the specific results, such a measure is called a process-oriented measure, as opposed to traditional measures that tend to be “results-oriented.” This is where one sees the difference between cost-based measures and the ones advocated here. At the minimum, cost-based measures have little connection to manufacturing strategy, and at worst, they work against the tactics needed to implement the strategy.
In a similar way, one also has to be alert when implementing a lead time measure, because it doesn’t necessarily result in the best manufacturing strategy, unless the measure is carefully thought through. At one factory that made cooking equipment for the fast-food industry, management was under pressure from its owners to reduce lead times to under eight days in order to retain market share. The factory had a fabrication area that made components and an assembly area to put together the final product. The total lead time, including fabrication of all components and assembly, was six weeks for a typical product. However, the assembly lead time was under five days. While there were too many end items to stock in finished goods, the number of unique fabricated components was smaller. Hence the factory manager decided to build up a large inventory of fabricated components. In this way, he could assemble to order and also achieve the desired lead time. However, the factory ended up with over a million dollars of component inventory, whose carrying cost ate into most of the profits of the business. In addition, there was always the problem that one component was not in stock when needed, which led to a cycle of expediting in the fabrication area. And finally, the long lead times in fabrication meant that the Response Time Spiral was impacting the operations in a big way, with its loss of quality and its other effects leading to high overhead costs.
What this anecdote illustrates is that a naive policy that measures lead time is just as perilous as a traditional cost-based measure. The solution in the above case would have been to institute three measures: one, lead time to respond to a customer order; two, lead time of material through fabrication and assembly; and three, the value of component inventory. Indeed, knowing that the best manufacturing strategy would be to have the ability to fabricate and assemble only to order, and that the major obstacle to this is fabrication lead time, reducing fabrication lead time should be made the primary measure (specifically, the QRM Number would work well for this), and the other two ought to be secondary measures.
- Keep the measures simple. Don’t go for complicated measures involving a composite of many different individual measurements. These have two drawbacks. First, they obscure an individual person’s contribution, thereby removing the incentive for that person to try harder. Second, they are subject to manipulation. Employees may attempt to maximize the index by focusing on portions of it, to the detriment of the rest of the operation. I witnessed an example of this a few years ago when I studied the operations of a capital equipment manufacturer. One area of the company had a very long lead time, and on closer examination I found that it had an unusual amount of machine down time. The workers in that area were measured on efficiency, and on a hunch, I asked what happened to the measure when machines were down. It turned out that many years before, the union had negotiated a clause stating that workers were credited a certain proportion of productive work hours whenever their machine was broken. The aim was not to penalize operators who couldn’t make parts through no fault of their own. However, over the years as batch sizes had become smaller, workers in this area found that the amount of credit they received when a machine was broken was more than the average they could achieve with the setup and run time of a typical batch. It was no surprise, then, that for one reason or another, machines were down in this area! This example is a classic instance of the oft-cited dictum: “You get what you measure.”
- Display the measures clearly. Some companies are reluctant to share performance details with workers, for fear that workers may want a greater piece of the pie if the company does well. The QRM approach involves complete openness with employees about the company’s strategy and direction—after all, you are going to rely on these same employees and tap into their skills and suggestions to help you get there. As part of this openness, all areas of the company should be willing to share their key performance measures with others. This is true even when an area is performing poorly: Such an occasion should be an opportunity for others to rally around this area and assist them in rooting out problems to help the company improve as a whole. “If you want a goal to be met, share the progress with those that can make it happen,” says Jim Riihl, manager of production planning at Beloit Corporation, who worked together with me for several years to train Beloit’s employees on implementing QRM. In order to effectively display measures, company management should use charts, graphs, and other visual aids to communicate the measures in pictorial form, not just in reports with numbers. Also, you should prominently display these charts and graphs for all to see, in a central location, in each area, or both.
- Supplement the QRM Number and other summary numbers with detailed and direct measures. The QRM Number is a summary number, involving an average of a number of observations. Such a summary statistic can hide potential problems, such as occasional very long lead times, or when lead times fall into two main groups, or whether there is a trend during the observation period. So it also pays to plot the raw lead times on a chart (one point for each order, say). This helps the team focus on issues such as, why do we occasionally have a very long lead time? Also, if we consider that in the QRM Number formula, the base lead time and the “100” are essentially constants, then the QRM Number involves the reciprocal of the average lead time. Even though this is a simple calculation, there are benefits to showing some direct observations so people can see the actual lead times before they are aggregated and turned into a reciprocal. The same is true with other performance measures. In addition to the summary statistics for each period, show the individual detailed observations so that employees and managers can derive any insights possible and take corrective action where needed.
THE TEAM-BASED ORGANIZATION
You’ve seen that the core building block of the organization structure for QRM and the backbone of all QRM efforts involves cells, which in turn derive their benefits from teamwork. So QRM performance measures must be compatible with and supportive of this cellular team structure.
The first implication is that measures must be much more people-oriented than they have traditionally been. What is interesting is that even as far back as 1956, this was well recognized. More surprising (given all that I’ve said about accounting systems), the following statement came from a text on accounting: “People, not figures, get things done.” The author goes on to say:
Or “unless it results in action relevant to the current manufacturing strategy,” we might add as a friendly amendment to the last sentence.
QRM strategy refines this view of organizations versus people further—the organization is constructed of cells, and people come together in cell-based teams. However, transitioning entire companies to a team-based cellular structure is not going to be easy for U.S. companies, given several hundred years of American history, which values the independent spirit:
And:
To make matters more difficult, even if workers were fully convinced, many managers are still not on board, despite all the publicized results on successes achieved via teams. As one instance of this, in the spring of 1996, a few weeks after we concluded a study for a Wisconsin division of an international company, a key recommendation being that they adopt a Q-ROC for a given line of products, the vice president wrote to us saying, “Many of your recommendations were going to be implemented; however, due to a change in upper management, all of this work was abandoned. Our new manager doesn’t believe in a permanent team-oriented work environment.”
Since teams, through their implementation in cells, are a vital element of a successful QRM effort, and employees and managers continue to have difficulty in accepting teams, it is worth devoting time to understanding more about what it takes to successfully implement teams.
Why Teams Fail
One way to enhance the chance of success in building a team-based organization is to have a good knowledge of why teams fail. Since teamwork is all the rage today, there has been an explosion in the literature on teamwork. In fact, there are several publications—from short articles to entire books-on the very topic of why teams fail.13 This section summarizes the insights from such publications, as well as my own experiences in the context of QRM.
Among two primary reasons cited for the failure of teams are unclear goals and changing objectives. Fortunately, for QRM these two reasons are easy to combat. The clarity of purpose of QRM, in terms of its focus on lead time reduction-indeed, the relentless emphasis on lead time reduction that QRM calls for-can eliminate these two problems. Related to these are two other major reasons: lack of accountability and lack of role clarity. Again, by making lead time reduction the focus of the team and through measures such as the QRM Number, team accountability and the roles of team members both crystallize.
Other reasons for failure of teams include lack of management support and low priority of the team in the organization. These issues go deeper, because to tackle the first, one needs to change the mind-set of management. The issue of priority goes to the heart of the mind-set issue, because it really asks, is management truly committed to the lead time reduction it has stated? If it is, the team will not have a problem with being a priority. If, on the other hand, management is simply paying lip service to lead time reduction and is really focused on more traditional measures, then indeed the team will find itself a low priority item when requesting support or resources. This can be demoralizing, leaving employees disillusioned and eventually apathetic, thus completely destroying the reason for creating cells in the first place.
Another potential problem with teams occurs when companies institute teams but stick with existing individual compensation systems. This lack of team-based pay works counter to teamwork. Without team-based pay, the team members get a confusing message. While desiring the members to work together, the organization still rewards them based on individual accomplishment.
Teams also fail when their members don’t incorporate a sufficient skill set or if lines of authority are fuzzy. These issues are addressed in the next section.
A major cause of failure in team implementation is fear. This emotion pervades the whole organization when the term team is used. Managers and supervisors fear that they will lose their jobs. In fact, you must not use team implementation as an excuse to fire supervisors and middle managers. People will begin equating team formation with downsizing and job elimination, and this will create resistance at all levels. In particular, experts note that teams fail 75 percent of the time if managers and supervisors are dead set against the idea.14 Remember, as I’ve said and conveyed throughout this book, QRM is about growth, not downsizing.
Front-line employees fear the move to teams because of their ingrained mistrust of management’s motives—maybe this is a way to get more work for the same wages. Likewise, unions fear the implementation of teams, seeing it as management’s way to undermine their influence. Support departments and specialists fear that their entire function will disappear as the company disperses knowledge into teams via cross-training. In addition, these people worry that if they are assigned to a product-oriented team they will no longer have peers who understand their profession and can help them stay current. More important, who will be able to appreciate their technical progress and decide their pay raises? Who will be their technical leader, providing career guidance and mentoring in the field of their specialization? And what hopes do they have of a career path if their specialization has disappeared in the organization?
These fears and the other issues in this section will now be addressed with specific recommendations for QRM teams.
GUIDELINES FOR SUCCESSFUL QRM TEAMS
Let us emphasize that I am not advocating the type of team that is simply a group of people getting together periodically. That would be more of a committee than a QRM team. To review an issue raised in Chapter 11, many companies make the mistake of creating teams whose members remain located in their functional departments and report to their traditional functional managers. Such “teams” have to schedule their meetings in company conference rooms, and they do not approach the full potential of a cellular team that delivers products to a focused target market segment (FTMS). Indeed, let us revisit the misconception about teams:
It is worth repeating—a QRM team must be collocated, and it will cut across functional boundaries and change reporting structures. Before proceeding with the issues related to implementing teams, readers may wish to reinforce their understanding of what constitutes a QRM team by revisiting the discussion on shopfloor cells in Chapters 4 and 5 for a definition of QRM teams, and looking at Chapters 11 and 12 for the issues involved in implementing Q-ROCs. This section discusses 10 guidelines for implementing effective QRM teams.
Creating Clear Focus and Goals
Studies on teams have repeatedly found that to ensure success, it is imperative that teams begin with clearly understood goals. Even better is when the focus is not very broad at all: “Many companies are finding that teams work best when their focus is narrow and goals clear.”15 Fortunately, QRM provides teams with a clear focus-investigate the causes of long lead times-and an unambiguous goal—reduce the lead time. Further, use of the QRM Number as the primary performance measure reinforces the clarity of the team’s focus toward this goal.
Another rule of thumb that contributes to the success of teams is to give them challenging goals, often called “stretch goals.” The aim is to make the goals such that you cannot achieve them via tweaking current methods, forcing teams to “think outside the box.” At the same time, the goals should not be so far out that the team perceives them as completely impossible to attain. In fact, you should perform goal-setting in joint sessions between management and the team, to ensure buy-in from team members. Again, in the context of QRM, there is substantial experience that enables us to do this goal-setting effectively: goals of 50–75 percent lead time reduction are normally in the domain of stretch-yet-achievable.
Educating All Employees and Managers on the Need
Everyone in the organization has to begin the process of understanding why the organization must change, why the traditional methods are no longer good enough, and why there needs to be radical change. The only way to do this is through repeated training on the latest developments and exposure to what is happening at other companies. Although, despite all this education, you can expect resistance to such changes, sometimes there are refreshing surprises. In 1994, I was in the midst of a discussion with union members at an Illinois factory of a metalworking company, explaining to them the need for cross-training to improve the quality of a particular set of operations. How would their union leaders react to this suggestion, I asked them. I was not fully prepared for the depth of the answer a worker gave: “We have to change the way we work. We’ve been doing things the same way for over 50 years. We can’t go on like this! How can we expect to compete with companies all over the world if we aren’t willing to try new ideas? We will take this suggestion to our leaders.”
It is critical to get not just the employees, but also managers and supervisors lined up behind the changes. This includes not only training to change their mind-set, but also acknowledging and addressing their fears. They should understand that a successful QRM program means there will be enough work for everyone. At the same time they need to understand that most everyone’s roles and responsibilities will change. For example, many supervisors will turn into coaches with plenty to keep them busy. Managers may also end up with more rewarding jobs, being team trainers, quality trainers, facilitators, or champions, instead of being under pressure to always solve problems and make decisions (and to be right all the time). If managers can see such successes at other firms, it will help to bring them on board early in the program. Invest in visits by managers and supervisors to companies that have accomplished these changes. Also, be sure to involve them in planning the changes. Finally, make sure the people in the human resources department fully understand what is happening, and then get them to hold meetings and answer questions to allay fears at all levels.16
It is helpful to review the strategy used by U.S. Gauge, a division of AMETEK Inc., in implementing the concepts of work teams in its Barlow, FL plant. This division has been highly successful in implementing teams, although the success did not come easily at first:
Selecting a Team—Use Volunteers
Chapter 5 gives an example of the failure of a cell because the company decided who the cell members would be. In our experience, the best teams are formed when you use a selection process that involves people applying or volunteering for membership in the team. Companies should post job descriptions for the proposed members of the team and then engage in a selection process. However, there is a key step that precedes even the job postings, as demonstrated from an anecdote. When Ingersoll Cutting Tools Company was forming its Q-ROCs, the initial job postings got a very low response rate, because the company did not do a good job of communicating its “Fast Track Team” program to the rest of the organization. Hence management must start with a foundation of education for the whole company, explaining the need for the new structure, as well as the career opportunity for people moving into these teams. The idea is to get employees to buy in to the QRM vision, and then have them implement that vision. This education for the company is only the beginning of a great deal of training required along the QRM journey.
Training, Training, and More Training
In addition to providing general training for the whole organization regarding the journey to QRM, companies must invest in specific training for each team. Do not underestimate the amount of time your organization will have to invest in training. Successful companies note that employees spend up to 25 percent of their time in activities such as cross-training and learning new skills, short-term problem-solving meetings, and other team meetings for longer term improvement. As a QRM team is being put in place, team members will need training in a number of areas:
- Team dynamics. How to work together as a team, and how each person can be an effective team member. Often this involves outdoor physical activities where team members have to learn to trust each other in slightly dangerous or challenging situations. Many managers pooh-pooh this “touchy-feely” topic; yet every company I know that has invested in team dynamics training has stated that it was critical in getting the team off to a good start. It is not necessary, though, that the team be in a constant state of chumminess; some element of conflict is healthy for a team. There should be degrees of both friendship and combat along the way to achieving the best teamwork.18
- Interpersonal and communication skills. How to be a good listener, how to make an effective presentation, and how to interact with others in constructive ways. In the traditional organization, where many employees could do their part for the company without much interaction with others, these skills were not part of the job description. “In 1980 an immigrant without much English could just throw the right switch on the machine. Now he has to join ‘team’ meetings and read memos.”19 Employees will not magically change overnight once the team is formed; the company has to invest in training them in these skills.
- Meeting management. How to run meetings, and how to participate effectively. Again, employees may never have had to do this. Without specific training, a lot of time could be wasted in meetings where the team was just spinning its wheels. Basic skills like using an agenda, keeping a meeting focused, and ending meetings with action items need to be taught.20
- Team leader/facilitator skills. The role of the leader or facilitator is discussed below. However, everyone in the team should have some basic training in this area, under the assumption that this role will rotate around the team.
- Skills enabling team improvement. These involve problem-solving skills, kaizen methods, project management, and other tools to help the team find root causes of problems, brainstorm about solutions, and then manage their implementation and follow-up.
-
Multifunctional training (cross-training). This involves both technical training to gain the skills needed for another job, as well as empathic or experiential training, which means actually doing that job for a while and experiencing it. Here are two specific examples.
A U.S. design expert noted from his observations in Japan that deliberate efforts are made to broaden rather than narrow engineers: “At a camera company, mechanical design typically falls into four areas: film transport, mirror box, autofocus lens, and shutter. Even though shutters, for example, are very difficult to design, there are no shutter gurus. Instead, each designer rotates from area to area until he has worked on all of the elements.”21
I described at length the success that Ingersoll Cutting Tool Company had with implementation of a Q-ROC. In recruiting people for this Q-ROC, Ingersoll’s management made cross-functional training part of the job description for potential Q-ROC members in two ways: Employees had to be willing to learn new skills, and they had to be willing to engage in training coworkers and sharing knowledge with others. Further, when they posted the jobs, looking for volunteers, they also posted a formal training matrix for each job description showing what skills would be needed. Finally, each person who joined the team had to fill out on this original matrix the skills that they already had, and which ones they needed to learn via training. This training was then done on the job, primarily by others in the team, and tended to be informal.
- Miscellaneous skills. This catch-all category is meant to indicate that there will always be additional skills that each particular team will need. For instance, a team may take on administrative jobs involving record-keeping that was typically handled by managers. Or it may need customer-service training; a team always has customers, whether internal or external, but in some cases the interaction may require special training. Some team members may need to be trained in computer skills to use the tools that the team relies on.
Determining Team Size and Structure
Effective teams seldom exceed 15 members. In my own experience, it often pays to set the limit even smaller, around 10 or even 7 people. If serving an FTMS requires more than 15 people, consider splitting the subsegment into two finer subsegments, or breaking the delivery process into a “front half’ and “back half,” with a team for each.
Regarding the leadership role in a team, there are several models, including those that suggest not having a leader, only a facilitator. My own preference, to be most consistent with QRM principles, is to create a position with the title of Team Leader. This person has three key roles.
- Acts as an interface with the rest of the organization. Other teams and departments find it useful to have one person to call with questions, problems, complaints, etc. In this context, it is best for the person to have the title of leader, so that the other person feels they are talking to someone who can make things happen.
- Coordinates and facilitates team meetings and interactions. It is important that the team leader not give directions at such events, but have the same decision-making authority as any other member. However, their role is to set meeting times, create agendas, move the meeting along, and compile action items at the end. It pays to train the team leader in both how to facilitate and how not to grab control.
- Advocates for the team, to management or to other parts of the organization. This includes lobbying for resources that the team needs, or defending it against efforts to undermine it.
Another important part of this model is how the leader is chosen. Some experts suggest a voting process. My preference is to go with the rule that the position will rotate among team members, with a time period ranging from three months to a year, depending on the experience of the team with the startup time it takes for a leader to gel. The reason for my choice on this issue is that it creates a truly equal team; the leader is not a superior being, just a regular team member who is filling that role for this period. Also, this forces everyone in the team to learn the skills needed for this position and to appreciate what it takes to be in that position. In exceptional cases and under extenuating circumstances a team member can “pass” on their turn to be the leader, but this situation should be discussed in a team meeting and accepted by the team ahead of time. In the long term this means the team supports the leader better and the leader serves the team better.
Supporting Empowerment
Everyone talks about empowered teams these days, but what does empowerment really mean? I can best answer this in the context of cellular teams for QRM.
You must provide the team with some resources and authority to utilize those resources as it sees fit, e.g., a budget for training or tooling. One important resource to have available for the team is an experienced facilitator. This person is not part of the team but is available as required, to participate in occasional team meetings, to provide guidance, and to be available for consultation when team progress is stalled or a barrier arises.
In addition to providing the team with authority, management must clarify the boundaries of the team’s authority; within these limits, the team should have full authority to make decisions. Examples of boundaries to be set are: To what extent can the team sign off on quotes or proposals to customers? Can it accept orders from customers? Can it decide vacation time? Can it quote delivery dates? And so on.
Empowerment also means encouraging risk-taking. If the team takes an initiative that fails, and management comes down hard on the team, this will be a sure-fire way to kill future improvements. Instead, management should convey the attitude: “We’re happy that you tried something new. Too bad it didn’t work. Why don’t you try to understand why it didn’t work and learn from this exercise, so that you can decide what your next initiative will be.”
A good way to support the team’s empowerment is to make sure it has a champion outside the team. This is someone with significant authority who can make things happen. For instance, this person can be an advocate for the team when organizational policy changes are required or barriers need to be dismantled.
When you create a team it is a good practice to state right off the bat that there will be periodic reviews of how the team is working together and how it is progressing toward its goals. By institutionalizing such reviews, they are not seen as signals that management feels something is wrong; rather, they become part of the regular team process. The expert facilitator can be helpful in conducting these reviews. Initially, when the team is starting up, these reviews could be as frequent as a one-hour meeting every week. Later, they could become much less frequent, say, a two-hour meeting every three months.
Providing the team with adequate support also means the occasional support it will request from existing specialized departments, such as engineering, materials, or purchasing, to get expert help on an issue. This is not trivial; these departments may be resentful of the team effort in general because they are losing personnel to teams, or because they feel the teams are taking over some of their jobs. Management must tackle this issue ahead of time in two ways, similar to the issue with supervisors. First, the support department personnel must understand why it is imperative for the company to change its mode of operation. Second, they should understand their long-term role and career paths-this issue is discussed separately below. In addition, during the transition period to the new organization structure, management should give support departments a clear signal that it considers the success of the newly formed teams to be critical, and that it expects the support departments to contribute in positive ways to this new direction.
Changing the Traditional Reporting Structure
Since it is the goal of QRM to eventually dismantle the functional structure of the organization, the reporting systems for the teams must be outside the traditional departments. Having a manufacturing cell under the milling department manager or the grinding department manager would be counterproductive. If you examine the QRM organization that I’m creating, you’ll see that it is oriented toward market segments. This means cellular teams should ideally report up through an organization structure that reflects these segments. In the absence of such a market-segmented organization-during the transition period when the organization is still being restructured—cells should report directly to “neutral” (i.e., nondepartmental) higher-level managers such as the director or VP of operations.
Involving the Union
In cases where companies have labor unions, management can make several efforts to involve them in the progress toward the team-based organization. But first, it is worth making two observations. One, the presence of unions is not automatically an obstacle to success. Recall the observation that manufacturing cells have typically been more successful in union shops rather than nonunion shops. Two, in many cases unions have taken the initiative in forming teams, and approached management with the idea. I’ll give more examples of this at the close of this chapter. To get a union lined up behind the team effort, Hitchcock and Willard offer four specific suggestions:22
- Make the union a partner in the change process by involving the union early in the thinking. Include union representatives in visits to other companies and in the mind-set training.
- Show unions that the team organization helps to further, not undermine, the very values for which unions were originally created.
- Allow the union to share responsibility for implementing the changes, such as being involved in detailed decisions about the implementation and conducting some of the worker training sessions.
- Put effort into helping the union redefine its own role. This isn’t only something a company must do with managers and employees, it is just as crucial to ensure the union evolves in its role, or there may be backtracking later in the process.
Providing a Vision for the New Organizational Structure
As all these pieces come together, what does the new organization structure for QRM look like? It has three main characteristics. First, in place of functional departments there are FTMS-oriented teams.
Second, the large support department functions become dispersed within the teams; however, core groups of experts still exist in support functions. These experts are the repository of highly specialized knowledge in their area. Their key role is to support teams that occasionally need skills beyond what their members have; secondary roles include mentoring the specialists who are now actively on teams and providing training to team members who wish to learn some of their skills.
To elaborate on this, what you are creating is a company where your teams become experts on the whole set of processes required to serve the customer in their FTMS—as opposed to departments that are experts on one specialized task. However, the specialized expertise is not completely eliminated; it is retained in the small support departments. The flow of orders, however, is not zig-zag through the functional departments, it is direct through one or two teams, and the support departments are true to their name-they support, without impeding the flow (see Figures 16-5 and 16-6).
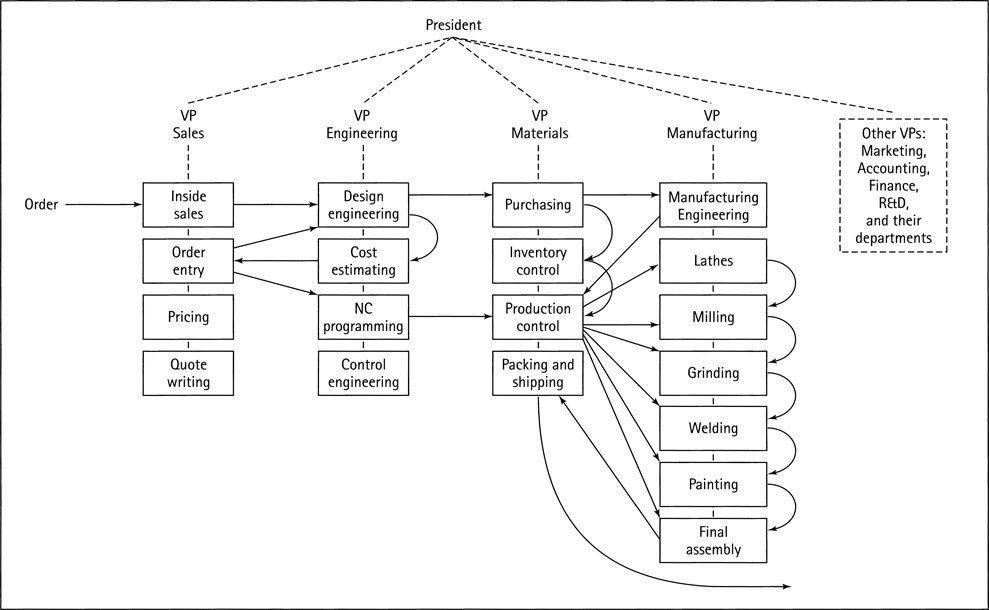
Figure 16-5.
The Traditional Functional Organization Structure

Figure 16-6.
The Focused Market-Oriented QRM Organization
Third, the organization realizes it will be in a constant state of flux as markets change, customer demands shift, and you need to create or disband cells to best serve the new segments. Unlike the apprentice who joins the engineering department as a drafting person, works his way up to being an expert designer, then a chief engineer, and maybe even head of the engineering department-a career path of more than 20 years in one department—unlike this path, people in the QRM organization can expect to be in many different teams over their career span. As an engineer (and team member) at Hewlett-Packard said to me when I asked him about his future: “I don’t know what I’ll be doing two years from now, but I do know that there will be a job for me, and I do know that it will be challenging and rewarding.”
What is the career path of people such as the apprentice above, in the new organization? It involves quickly learning the key ways that their specialized knowledge (e.g., design) can assist in serving the particular FTMS of their team. It involves demonstrating that the person can move from one team to the next, and quickly adapt to the new circumstances. Instead of pay raises being decided by the head of the specialist department, team results and team members now decide them (more on this below). And so it should be, if this individual is to contribute effectively to the organization’s goals. The career path may evolve in other ways too: It may involve becoming a trainer or facilitator. This designer may end up being part of the small central functional department that supports designers in many teams. The challenges and rewards of this work environment are just as many as in the previous one. The key difference is that career growth is not so much upward as forward.
And what of the employees who do not want to cross-train or take on responsibility? A manager quoted some of his employees during their transition to cellular teams: “I don’t want to be multiskilled-don’t ask me to learn new skills”; “Don’t ask me to make decisions; tell me what to do.” It’s not that these are poor workers, he explained to me. In many cases they are excellent employees, but they just don’t want to take on any more. The bittersweet realization is that in the QRM organization there will be limited scope for such dedicated workers who do not wish to expand their repertoire. Over time, such people will be replaced by those who do. Herein lies an important lesson for human resource departments. As they look to the future in terms of people to hire, they must bring in those who will be open to multiskilling, accepting responsibility, continuous improvement, and constant change.
One company adopted an even more stern approach. Rather than relying on attrition or voluntary departures of employees who couldn’t stand the pressure, the company and its employees agreed to a “three strikes and you’re out” policy. In this policy, team members had the opportunity to vote out a team participant after a few months, if that person had not gelled with the team and was perceived as not contributing sufficiently. Such a person would have three “lives.” If they were voted off three teams, their employment would be terminated.
The changes I envision may seem too difficult to pursue. And yet, as company after company has shown, the rewards from these changes are clearly worth it. For example, as General Electric moved parts of its organization to team-based structures, the company noticed that “the more responsibility it gave the workers, the faster problems got solved and decisions were made.”23 Also, despite all the obstacles, fears, and transition problems, the grass-roots enthusiasm one eventually finds can be a refreshing change. As a shopfloor worker at an 80-year-old company that makes heat-transfer equipment said to me a few months after we implemented the first QRM team in the company’s main plant, “This is the best thing that has happened at our company in a long time.” Management should also realize that investing in the people and team-based organization isn’t just a matter of making people happy; it is a core element of competitive strategy: “Very quickly, the raw materials, the production equipment… and the marketing techniques that are employed by a company… are available to its competitors. What cannot become quickly available are the knowledge, skills, initiative, motivation and dedication of its work force…”24
Making Incentive and Reward Systems Compatible with QRM
An important observation to make about incentive systems is that study after study shows that rewards are not synonymous with monetary compensation. In fact, nonmonetary rewards are perceived to have more lasting value. Examples of such nonmonetary rewards are public recognition via plaques, award ceremonies, and the like; picnics, field trips and other outings that include family members; and special parking privileges or other organizational privileges that are given to individuals for limited periods. The plant manager of one General Electric facility echoed this sentiment: “A monetary reward goes in their pocket and is forgotten in a week. We go for something that they can see and display for a longer time, such as hats, T-shirts, badges, and plaques.”25 Harley-Davidson has had a similar experience in their team-based Sportster assembly operation: “…but [their pay rate] is not substantially higher. Apparently, working on the Sportster line involves something intangible—like pride and identity.”26 Another expert on teams says: “… it is well known that many of the most successful reward programs are not monetary. A $12 plaque awarded in front of the entire organization is often more effective than many times that amount given in the employee’s check as bonus.”27
Nevertheless, team members have to pay their mortgage, send their children to college, save for retirement, and have money with which to enjoy life, and so you must also carefully choose the mechanism for monetary rewards. For QRM, these rewards should consist of the following components:
- Team-based rewards. If you subscribe to all that has been said so far, then these should be the primary rewards. The QRM Number can form the backbone of measures used to set these rewards, with the secondary measures complementing them to a limited extent. To ensure that team goals indeed come first, the team-based measures should carry significant weight.
- Team redistribution of rewards. A majority of the team-earned reward should go to all team members. However, a small amount (e.g., 10–20 percent) should be kept in a pool and redistributed by team members after evaluating everyone in the team. This allows a recognition of those who worked particularly hard, and also provides an incentive for others not to slack off and shove their tasks onto their teammates.
- Individual growth rewards. The purpose of this portion is to encourage people to learn new skills. Skill-based pay schemes (also called “pay for knowledge”) are appropriate for this, as are other schemes for people to set personal objectives and be compensated as they achieve them28
- Multiteam rewards. Where a group of teams must work together to serve an end customer-such as an office team, multiple component fabrication teams, and an assembly team—a portion of the reward should be based on the performance of the group as a whole. Once again, you can use the QRM Number to measure the whole group.
- Divisional rewards. At the broadest level, where many teams serving different markets comprise a factory or division, it may be appropriate to make a small portion of the reward dependent on the performance of the broad division. This helps to keep some spirit of camaraderie among the various groups under the same roof. In this case, it may be acceptable to base the reward on a financial measure. Even though I have concerns about the short-term or invalid perspective that results from financial measures, this might suffice for three reasons: (1) the teams and markets could be so disparate that something like the QRM Number may not be easily accepted across the board; (2) the systems are already in place and it will be simple to implement; and (3) this should only be a small part of the total compensation so that the financial systems will not significantly distort people’s behavior.
Also, you should set up the compensation system so that team members do not have to take a pay cut in order to join the team. One misconception about teams is that you have to pay everyone the same amount. Not at all. It is entirely reasonable to have experienced members join the team at a higher pay scale than novices. However, what is important is that all team members see the distribution of rewards and pay raises as equitable, using the components listed above.
ADJUSTING THE ACCOUNTING SYSTEM FOR QRM
In several places in this book I’ve discussed many of the drawbacks of traditional accounting systems when it comes to implementing QRM. In the last decade, whole new accounting systems have been proposed to make them more compatible with modern manufacturing strategy. Prominent among these new approaches is activity-based costing (ABC). Traditional accounting systems allocate indirect costs based solely on direct labor hours or machine hours, and they use an allocation ratio that is fixed for all products. Instead, the ABC system estimates the demand for support resources based on numerous characteristics of each product and the processes it uses. This requires a substantial amount of data to be gathered on the “drivers” of cost for each activity performed by the company, as well as data on the demand for each activity generated by each product or process, again based on various characteristics of that product or process.29
However, it is not my intention to propose a whole new accounting system here. Instead, I’ll present two quick fixes to existing accounting systems. While relatively simple, these two mechanisms could go a long way toward enabling QRM efforts.
Strategic Overhead Allocation Approaches
The ills of the traditional accounting system, and in particular its aspects that deter QRM implementation, stem mainly from overhead allocation schemes.30 As I showed in Chapter 2, such allocation schemes can make cells look as if they are causing the company to lose money.
The problem arises because while cells actually reduce the overhead expenses for a company, they continue to be “burdened” with existing overhead rates. Therefore it is my proposal that management create a strategic overhead rate, lower than the regular one, for each new cell put in place. They should calculate this rate based on rough values of expected reductions in overhead activities required by the cell. (While this may sound like ABC, it is not, because QRM does not require detailed calculations to be carried out, just rough “ballpark” estimates, for reasons that become clear in the following discussion.) With this revised overhead in place, the cell’s performance will appear more reasonable.
However, because this overhead rate is lower than the regular one, it is to be expected that when the cell is first put in place, there may well be some underabsorption of overhead. What this means is that the company may incur more overhead expenses than will be allocated to all its regular operations (which include the new cell plus all the remaining operations). The company should collect this underabsorbed amount in a pool that management should view as an investment—much as one would view the purchase of a new machine or a building. As time goes on, more cells are implemented, and the QRM efforts start to yield significant results, the actual overhead costs and material costs will decrease significantly. Since the costing system will continue to use the standard material costs for products, this plus the existing overhead rates will mean that costs will start being overabsorbed. The company can use this overabsorption amount to recover the costs that were put in the earlier pool, much as depreciation is used to recover the cost of a building.
In conducting this exercise, it is key that management not be under pressure to predict these changes precisely and exactly cancel out all the pools. This is not supposed to be an exact science. Rather, it is a way to retain some sanity while implementing QRM, without needing to revamp the entire accounting system. As you bring many programs on line and you realize many improvements, as long as the pools remain manageable (not too excessive) and roughly cancel out, you have achieved the goal of this exercise.
Knee-jerk reactions to the above description might include: “How can we guess the reductions in overhead that might take place?” Or: “This is entirely too risky a process!” Put these comments in perspective by examining the criticisms I’ve leveled against accounting systems: They are backward looking, and they don’t encourage any risk taking. By creating the strategic overhead rates and pools, haven’t we accomplished what we wanted, that is, forcing managers to look ahead and encouraging them to take risks?
Remember, too, that we are only concerned with the management accounting portion and are not proposing that you change the entire financial accounting system. The financial accounts will not be able to use this approach because government regulations require full absorption costing for financial reporting. However, my intention is that you can use this alternative approach for management accounting purposes, to support managers in driving the company in the right direction. It is not unreasonable to expect a divergence in these two systems. As Robert Kaplan, an expert on accounting and one of the inventors of ABC, once said:
Why ABC Is Not the Answer
Kaplan, Cooper, and others have proposed ABC as a solution to this problem of misleading accounting reports. However, I now explain why ABC is not the answer to the issues that I have raised with respect to QRM implementation. There are four reasons.
- As I explained earlier, implementing ABC requires a substantial data gathering and analysis effort, and this alone could impede the progress of a QRM project for months or even years. Your company would be embroiled in the details of figuring out its cost allocations, while the competition continued to make advances in reducing its lead times. However, the reason why ABC is not the answer goes much deeper, as we see from the next three more fundamental points.
- ABC attempts to provide an accurate analysis of indirect costs for the current operation. However, when you implement QRM, the structure and dynamics of your manufacturing enterprise change substantially. Also, as we have seen from the numerous examples in this book, the behavior of individuals and other organizations such as suppliers also changes in significant ways. Entire feedback loops are modified or eliminated. But the drivers in the ABC model are based on the current system structure and dynamics, and thus predictions of future costs are based on this structure. At first blush ABC advocates would claim that their approach would enable us to estimate the new demands for activities, and then the ABC system would quickly calculate the new costs. But on deeper inspection, we find that not only would demands for activities change, but the whole structure of cost drivers would change as well. The only proper way to apply ABC would be to recalculate all the major cost drivers under the new situation, a task as daunting as the establishment of the original cost drivers. Plus, the values of the current drivers are based on a lot of existing operating data such as, how do the features of a product affect the number of engineering change orders generated for it? Since the future scenario is being hypothesized, it would take a great deal of discussion and difficult judgment calls to guess the new values for the drivers in such complex situations.
- Even if one could quickly “guesstimate” the values for these drivers, there is another, fundamental problem to be overcome. We saw in Chapter 7 that changes in setup time and lot size can have a dramatic impact on lead time and WIP; further, this impact is nonlinear (recall the U-shaped graphs there). Similarly, a 10 percent change in capacity utilization can double or triple lead time and WIP. Hence WIP carrying costs and other related costs bear a nonlinear relationship to drivers such as lot size, setup time, and capacity. But the ABC model is a linear model. What this means is that all costs go up in a fixed proportion to the value of some driver. No linear model could ever predict the organizational impact of changes that result from QRM decisions. In more rigorous terms, we can say that a linear model such as ABC can only be meaningfully applied to “what-ifs” that are in the neighborhood of the current operating methods. QRM makes drastic changes in the operating methods, and thus goes beyond the applicability of the ABC model.32
- The final reason is also fundamental. In a nation where a high proportion of top managers come from the accounting and finance side of the business, we have long assumed that fixing the accounting system will put a failing company back on the path to manufacturing competitiveness. Even well-known accountants have by now realized that nothing could be farther from the truth.33 Instead, the prerequisite for manufacturing competitiveness is for top managers to understand the fundamentals of manufacturing enterprise behavior, and then to combine this understanding with a vision of how to exploit the behavior to create competitive advantage.
In the context of QRM, once managers have developed such an understanding and corresponding vision, as well as the conviction to accompany the vision, then the simple accounting fixes I propose here will be sufficient for them to carry out their decisions. There will be no need for implementation of complex accounting systems to support this effort.
QRM Projects Justification via Strategic Funding
The previous section looked at how to keep a QRM initiative alive after you’ve put it in place, by not having it burdened with unfair costs. Now we look at solving the up-front issue, namely, the pervasive problem of justifying QRM projects, given the obstacles of cost-based measures. (As examples of this, review the discussion of the $200,000 CNC machine required by MPC in Chapter 5, or the $15,000 printer needed by the breakdown department in Chapter 11.)
The QRM solution is to have management create strategic funds, which they will hand out based on lead time reduction proposals—not traditional cost justification calculations. Management itself should create the strategic fund pool through some high-level cost and return calculations; however, giving out the money is based on very different criteria. I’ll illustrate this approach through the following example.
From an accounting point of view, the strategic fund for QRM approach is no more complex than, say, investing in a building for a new product line or in an R8tD project for a potential new product. I do not envision any significant accounting system hurdles for companies that wish to adopt this approach. What is required is the management will to push for it.
The key point to note about this procedure is the criterion you use to select projects. Conventional justification methods use financial criteria such as payback period, return on investment (ROI), internal rate of return (IRR), or net present value (NPV). The QRM approach uses lead time reduction as the primary criterion for evaluating projects.
Not that the QRM approach is ignoring financial returns altogether. What it does accomplish is to have senior management engage in macrolevel planning to gauge the financial returns and justify an investment. But unlike cost-based management methods, QRM methods do not reduce these macrolevel financial goals to microlevel financial goals for individual departments. Instead, the QRM approach reduces the macrolevel financial goals to microlevel lead time reduction targets. Herein lies the key difference, and in my view, the strength of QRM-and note that this is key, not just in this one instance, but in all my examples in this book.
EPILOGUE: DEMOCRACY IN AMERICA (REVISITED)
Our society is coming full circle from the 150-year-old observations by the French historian Alexis de Tocqueville quoted in Chapter 3. To understand what this full circle is, first note that during the twentieth century, the United States and most of the free world has lived a contradiction: While fighting for the cause of democracy within our countries and around the world, we have accepted dictatorship in our workplace. Witness this observation:
Amazingly, this divergence between our political and work systems was observed 150 years ago by de Tocqueville:
To put this all in perspective, and see the connecting thread, observe that most organizations have a four-way separation of fundamental roles.
- Ownership is represented by the stockholders.
- Decision-making is performed by management and supervision.
- Productive work is done by the employees.
- Protection of employee rights is represented by unions.
Much of the organizational dynamics and resulting nonproductive time spent by everyone comes from this separation, with each camp lobbying for its own goals. The key to understanding the team-based organization is that if you fuse these four roles together, the interests of all parties coincide. Everyone can focus their energy on making the company successful.
United Airlines demonstrated the huge impact of combining worker, manager, union, and stockholder roles when employees bought 55 percent of the company and acquired 3 of the 12 seats on the board of directors.36 “Join the side you’re on,” stressed Chairman Gerald Greenwald to the employees, as he encouraged them to buy in to the company when it was in severe trouble. A union leader at United echoed the sentiment, “No one washes a rental car.” In other words, you take care of what you own. In fact, while traditionally unions have wanted to increase the number of employees, United’s pilots’ and mechanics’ unions have now had an incentive to minimize new hirings, and—even more radical-have encouraged the hiring of nonunion temporary workers. The results of the employee ownership were already phenomenal by the end of 1996. United’s stock had more than doubled. Sick time and workers’ compensation claims declined 17 percent. Operating revenue per worker rose faster than at American and Delta, even though United ended up hiring an additional 7,000 people. Merging the interests of capital, labor, and management is breaking new ground in the evolution of capitalistic society.
Distributing some ownership to employees does not necessarily mean that employees must own stock. In the QRM context, ownership is an attitude as much as it is a physical or legal term. While you can spread around some ownership through employee stock options, nonstock ways of distributing ownership include team-based rewards, profit sharing, allowing participation in decision-making, and giving teams “cradle-to-grave” responsibility for certain activities.
It isn’t just management that is reaching out to workers. Unions have also taken some radical steps. In 1994, the International Association of Machinists (IAM) offered to help David Groetsch, president of an Alcoa division, create team systems and joint decision-making councils involving workers and managers at a Denver Alcoa plant. Said Groetsch in an interview: “If someone from [a consulting company] had said: ‘We can improve product delivery, customer satisfaction, and profitability—hire me,’ I would have yawned. But when the union walked in and said all that, it got my attention.”37 This approach by the IAM was not an anomaly at one plant, but part of a recent trend: “After years of skepticism, some unions are now advocating partnerships with management. A few examples: AFL-CIO, Laborers, Machinists, Needle Trades, Steelworkers…”
Lest my aim be misinterpreted, let me also clarify that the involvement of workers, employees, and unions in the management and ownership process is not a step toward some form of socialism or communism. This is not a trite observation, as a manager at Motorola pointed out to me in a written note while he was in a class at the University of Wisconsin-Madison:
These observations help to crystallize the point that the team-based organization is a natural step in our quest for complete democracy in our society. “Organizational democracy is this self-governance within an organization: of the employees, by the employees, for the employees.”39 Even an organization with strong authoritarian management styles, such as a military support organization, can change sufficiently to implement such democracy and benefit from work teams.40
However, democracy in the workplace alone will not guarantee a successful company. The democratic workplace must be designed with a viable business goal in mind. QRM offers just such a focused and highly viable goal, one that is ideally suited to the team-based democratic organization, and one that can launch us into the twenty-first century where our workplace and societal goals can be more equal than they ever were. The final chapter of this book shows you how to ensure the success of this groundbreaking venture.