Chapter 7
Electrical Impedance Tomography
Electrical impedance tomography (EIT) produces cross-sectional images of an admittivity distribution inside an electrically conducting object. It has a wide range of applications in biomedicine, geophysics, non-destructive testing and so on. Considering the fact that structural imaging modalities such as X-ray CT and MRI provide images with a superior spatial resolution to EIT, the primary goal of biomedical EIT is to supply functional diagnostic information of organs with a high temporal resolution. It may provide diagnostic information on functional and pathological conditions of biological tissues and organs. Following a brief introduction to EIT, we summarize bioimpedance measurement methods, on which an EIT system is based, to acquire data for image reconstruction. Its forward problem is introduced in the context of a practically feasible measurement setting. Modeling of the forward problem and sensitivity analysis will be the key to understanding and designing an inversion method. Three kinds of EIT inverse problems, including static imaging, time-difference imaging and frequency-difference imaging, will be described.
7.1 Introduction
The material properties of electrical conductivity and permittivity may produce image contrast in EIT. The conductivity (σ) and permittivity (![]() ) values of a biological tissue are determined by its ion concentrations in extra- and intracellular fluids, cellular structure and density, molecular composition, membrane characteristics and other factors. In the frequency range of a few hertz to megahertz, numerous experimental findings indicate that different biological tissues have different electrical properties, and their values are influenced by physiological and pathological conditions (Gabriel et al. 1996a,b; Geddes and Baker 1967; Grimnes and Martinsen 2008). In biomedical applications of EIT, we deal with the admittivity
) values of a biological tissue are determined by its ion concentrations in extra- and intracellular fluids, cellular structure and density, molecular composition, membrane characteristics and other factors. In the frequency range of a few hertz to megahertz, numerous experimental findings indicate that different biological tissues have different electrical properties, and their values are influenced by physiological and pathological conditions (Gabriel et al. 1996a,b; Geddes and Baker 1967; Grimnes and Martinsen 2008). In biomedical applications of EIT, we deal with the admittivity ![]() , where the angular frequency
, where the angular frequency ![]() is in rad s−1 with the frequency f in Hz. For most biological tissues, we may assume that γ ≈ σ at low frequencies below 10 kHz. With abundant membraneous structures in an organism, the
is in rad s−1 with the frequency f in Hz. For most biological tissues, we may assume that γ ≈ σ at low frequencies below 10 kHz. With abundant membraneous structures in an organism, the ![]() term is not negligible beyond 10 kHz and we should deal with the admittivity
term is not negligible beyond 10 kHz and we should deal with the admittivity ![]() in general at high frequencies.
in general at high frequencies.
We consider an electrically conducting object such as the human body with its internal admittivity distribution γ(r) as a function of position r = (x, y, z). To probe the object with the intention of non-invasively sensing γ, we inject current through electrodes attached on its surface. This induces internal current density and voltage distributions that are determined by the admittivity distribution, object geometry and electrode configuration. In the frequency range up to a few MHz, we may adopt the elliptic partial differential equation (PDE) introduced in Chapter 3 to describe the interrelations among the injection current, current density and voltage. By measuring induced voltages on the surface subject to multiple injection currents, an EIT system produces images of the internal admittivity distribution using an inversion method.
Mathematical theory has been developed to support such an EIT system especially for the unique identification of the conductivity σ from knowledge of all possible boundary current-to-voltage data at low frequencies where we can assume γ ≈ σ (Astala and Paivarinta 2006a,b; Brown and Uhlmann 1997; Calderón 1980; Kenig et al. 2007; Kohn and Vogelius 1984; Nachman 1988; Nachman 1996; Sylvester and Uhlmann 1986, 1987, 1988). After the early attempt to build an EIT system (Barber and Brown 1984), numerous studies have accumulated knowledge and experience, summarized in the fairly recently published book on EIT (Holder 2005). The nonlinear inverse problem in EIT suffers from its ill-posedness, related to lack of enough measurable information and insensitivity of measured data to a local change of an internal admittivity value. Though there exist numerous image reconstruction algorithms (Barber and Brown 1984; Berenstein et al. 1991; Brown et al. 1985; Cheney et al. 1990; Fuks et al. 1991; Gisser et al. 1988, 1990; Isaacson and Cheney 1991; Isaacson et al. 1989, 1996; Lionheart et al. 2005; Newell et al. 1988; Santosa and Vogelius 1990; Somersalo et al. 1992; Wexler et al. 1985; Yorkey 1987), it is difficult to reconstruct accurate admittivity images with a high spatial resolution in a practical setting, where modeling and measurement errors are unavoidable. In this chapter, we focus on robust image reconstructions that may overcome the technical difficulties of the ill-posedness.
7.2 Measurement Method and Data
7.2.1 Conductivity and Resistance
We consider a cylinder filled with saline. The saline contains mobile charged ions, and their migration under an external electric field characterizes its conductivity σ (siemens per meter, S m−1). Attaching two electrodes on the top and bottom surfaces, we measure its resistance R (ohms, Ω). Neglecting interfacial phenomena between each electrode and the saline, the resistance R is denoted as
7.1 ![]()
where L and A are the length (m) and cross-sectional area (m2) of the cylinder, respectively. If we inject DC current I (amperes, A), the induced DC voltage V (volts, V) follows Ohm's law as
7.2 ![]()
Injecting a known DC current I and measuring the induced DC voltage, we may find the resistance R, as is done in an electrical multimeter. If we have geometrical information about L and A, we can find the conductivity σ. For materials such as biological tissues, we denote the conductivity as ![]() to emphasize its frequency dependence. We may measure
to emphasize its frequency dependence. We may measure ![]() by injecting a sinusoidal current
by injecting a sinusoidal current ![]() to measure the induced AC voltage
to measure the induced AC voltage ![]() , where t is the time (seconds, s). Assuming a linear component, the resistance R at
, where t is the time (seconds, s). Assuming a linear component, the resistance R at ![]() also follows Ohm's law as
also follows Ohm's law as
7.3 ![]()
Note that the current and voltage are in phase. Repeating this measurement for multiple frequencies, we may get a conductivity spectrum, which plots conductivity ![]() as a function of frequency
as a function of frequency ![]() .
.
7.2.2 Permittivity and Capacitance
We consider a dielectric sandwiched between two parallel conducting plates. When we apply a DC voltage V between the plates, it induces an electric field inside the dielectric. The dielectric contains immobile charges, and their polarization or rotation in the electric field produces surface charges Q and − Q (coulombs, C). The induced charge is proportional to the applied voltage as
7.4 ![]()
where the proportionality constant C is called the capacitance (coulombs per volt, C V−1; or farad, F). The capacitance C between the two plates is given by
7.5 ![]()
where ![]() is the permittivity (F m−1), A the surface area and d the gap between the plates. The permittivity is a material property determined by the polarization of the dielectric under an external electric field. For most dielectrics, including biological tissues, the permittivity changes with frequency, and we denote it as
is the permittivity (F m−1), A the surface area and d the gap between the plates. The permittivity is a material property determined by the polarization of the dielectric under an external electric field. For most dielectrics, including biological tissues, the permittivity changes with frequency, and we denote it as ![]() .
.
If we assume a perfect dielectric, there is no mobile charge and its conductivity σ is zero. Applying DC voltage V to the dielectric, we get zero DC current through it. If we apply a sinusoidal voltage ![]() , there occurs an AC displacement current through the dielectric due to time-varying polarizations with frequency
, there occurs an AC displacement current through the dielectric due to time-varying polarizations with frequency ![]() :
:
7.6 ![]()
Note that the current and voltage are out of phase by 90° or the voltage is in quadrature with the current. Assuming that there is no polarization initially, we can express the induced voltage v(t) subject to an injection current i(t) as
7.7 ![]()
With known ![]() and I, we may find the capacitance C in farads (F), which equals A s V−1 or s Ω−1. If we have geometrical information on A and d, we can find the permittivity
and I, we may find the capacitance C in farads (F), which equals A s V−1 or s Ω−1. If we have geometrical information on A and d, we can find the permittivity ![]() (F m−1). Repeating this measurement for multiple frequencies, we may get a permittivity spectrum, which plots permittivity
(F m−1). Repeating this measurement for multiple frequencies, we may get a permittivity spectrum, which plots permittivity ![]() as a function of frequency
as a function of frequency ![]() .
.
7.2.3 Phasor and Impedance
Given an electrically conducting object with both mobile and immobile charges, we may view it as a mixture of resistors and capacitors. In this section, we adopt a circuit model using lumped elements since this provides intuitive understanding about the continuum model. Let us consider the series RC circuit in Figure 7.1(a). Injecting a sinusoidal current ![]() , we can express the induced voltage v(t) across the series connection of R and C as
, we can express the induced voltage v(t) across the series connection of R and C as
7.8 ![]()
where
![]()
Figure 7.1 (a) Series, (b) parallel and (c) series–parallel RC circuits

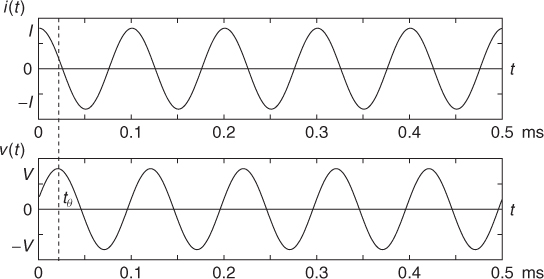
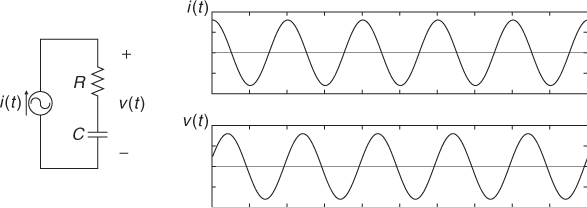
Figure 7.2 shows current i(t) and voltage v(t). Noting that there is no change in frequency between current and voltage for all linear components, we adopt the phasor notation. The current and voltage phasors are defined as complex numbers I = I∠0 and V = V∠θ, so that we can recover time functions i(t) and v(t) from
7.9 ![]()
respectively. Using the phasor notation, we can handle the relation between time functions i(t) and v(t) as an algebraic equation instead of an integrodifferential equation of time.
Figure 7.2 Current and voltage waveforms
We define the impedance Z (Ω) as the ratio of the voltage phasor V to the current phasor I, and it is a measure of the total opposition to current flow through a component or a collection of components. For the case of the series RC circuit, the total impedance is
7.10 ![]()
The real part of Z is the resistance (Ω) and its imaginary part is the reactance (also Ω). Note that, for a single resistor R, its impedance ZR = R. For a single capacitor C, ![]() .
.
7.2.4 Admittivity and Trans-Impedance
When we consider a material including both mobile and immobile charges, its electrical property is expressed as the admittivity γ (S m−1). To express its frequency dependence, we denote it as ![]() . Note that
. Note that ![]() and
and ![]() have the same unit (S m−1). We now assume a cylinder filled with a biological tissue whose admittivity is
have the same unit (S m−1). We now assume a cylinder filled with a biological tissue whose admittivity is ![]() . The impedance Z between the top and bottom surfaces is
. The impedance Z between the top and bottom surfaces is
7.11 ![]()
where L and A are the length and cross-sectional area of the cylinder, respectively. If ![]() , that is,
, that is, ![]() , then
, then ![]() and the material is resistive. If
and the material is resistive. If ![]() , that is,
, that is, ![]() , then
, then ![]() and the material is reactive or capacitive.
and the material is reactive or capacitive.
Most biological tissues are resistive at low frequencies of less than 10 kHz, for example. Since the capacitive term is not negligible beyond 10 kHz, we will denote the admittivity of a biological tissue at position r as ![]() . We assume an electrically conducting domain Ω with its admittivity distribution
. We assume an electrically conducting domain Ω with its admittivity distribution ![]() , as illustrated in Figure 7.3. Attaching E electrodes
, as illustrated in Figure 7.3. Attaching E electrodes ![]() , we inject current
, we inject current ![]() through a pair of electrodes
through a pair of electrodes ![]() and
and ![]() . Between another pair of electrodes
. Between another pair of electrodes ![]() and
and ![]() , we measure the induced voltage
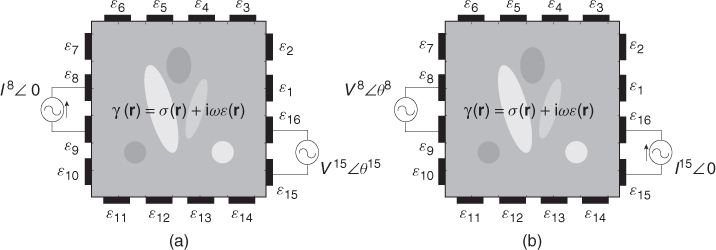
, we measure the induced voltage ![]() . We define the trans-impedance from the jth port to the kth port as
. We define the trans-impedance from the jth port to the kth port as
7.12 ![]()
In section 7.4, we will show that the admittivity distribution ![]() , domain geometry and electrode configuration affect the trans-impedance Zj, k. The reciprocity principle explained in section 7.4 indicates that Zj, k = Zk, j.
, domain geometry and electrode configuration affect the trans-impedance Zj, k. The reciprocity principle explained in section 7.4 indicates that Zj, k = Zk, j.
Figure 7.3 Measurement of trans-impedance: (a) Z8, 15 and (b) Z15, 8. From the reciprocity principle described in section 7.4, we have Z8, 15 = Z15, 8
7.2.5 Electrode Contact Impedance
To inject current and measure voltage, we use electrodes. An electrode is made of a highly conductive material such as copper, silver, platinum and others. Carbon is also used to make a flexible electrode, though its conductivity is not as large as for metallic conductors. When the electrode makes contact with an electrolyte or the skin of an organic object, the interface can be modeled as a contact impedance and a contact potential in series. The contact impedance includes both resistive and reactive terms, and its typical circuit model is the series–parallel RC circuit in Figure 7.1(c). As long as the interface is mechanically stable, the contact potential is stable and less than 1 V for most electrode materials.
We consider a method to measure the impedance Z of a cylinder with homogeneous admittivity ![]() . Attaching a pair of electrodes at the top and bottom surfaces, we inject current I at
. Attaching a pair of electrodes at the top and bottom surfaces, we inject current I at ![]() from the top to the bottom electrode. Denoting the contact impedances of the top and bottom electrodes as
from the top to the bottom electrode. Denoting the contact impedances of the top and bottom electrodes as ![]() and
and ![]() , respectively, the induced voltage will be expressed as
, respectively, the induced voltage will be expressed as
7.13 ![]()
assuming that no current flows into the ideal voltmeter. We can ignore the DC contact potential since we measure only the induced voltage at frequency ![]() . Using this two-electrode or bipolar method shown in Figure 7.4(a), it is not possible to extract only Z since two contact impedances are in series with Z.
. Using this two-electrode or bipolar method shown in Figure 7.4(a), it is not possible to extract only Z since two contact impedances are in series with Z.
Figure 7.4 Impedance measurements using (a) two-electrode or bipolar method and (b) four-electrode or tetrapolar method. No current flows through the ideal voltmeter

By attaching another pair of electrodes around the cylinder near its top and bottom, we inject current through the first pair and measure the induced voltage between the second pair as shown in Figure 7.4(b). Using a well-designed voltmeter, we may safely assume that there is no current flowing through the second pair of voltage-sensing electrodes. This means that the voltmeter sees only the voltage drop across the impedance of the cylinder Z between the second pair of electrodes as
7.14 ![]()
This four-electrode or tetrapolar method allows us remove the effects of contact impedances in bioimpedance measurements.
7.2.6 EIT System
We consider an imaging domain Ω with its admittivity distribution ![]() . We attach E electrodes
. We attach E electrodes ![]() on its boundary ∂Ω. We use an EIT system equipped with current sources and voltmeters to measure trans-impedances or equivalent current–voltage data sets. We may do this for multiple frequencies at different times. A typical EIT system comprises one or multiple current sources, one or multiple voltmeters, optional switching networks, a computer system and a DC power supply. The computer controls current sources, voltmeters and switches to acquire current–voltage data sets. It produces images of
on its boundary ∂Ω. We use an EIT system equipped with current sources and voltmeters to measure trans-impedances or equivalent current–voltage data sets. We may do this for multiple frequencies at different times. A typical EIT system comprises one or multiple current sources, one or multiple voltmeters, optional switching networks, a computer system and a DC power supply. The computer controls current sources, voltmeters and switches to acquire current–voltage data sets. It produces images of ![]() and/or
and/or ![]() by applying an image reconstruction algorithm to the data sets.
by applying an image reconstruction algorithm to the data sets.
There are several EIT systems with different design concepts and technical details in their implementations. The number of electrodes used in available EIT systems ranges from eight to 256. The human interface gets complicated with a large number of electrodes and lead wires. With a large number of electrodes, the induced voltage between a pair of electrodes tends to become small, since the gap between them gets smaller. In chest imaging, eight or 16 electrodes are commonly used, while more electrodes are used in head or breast imaging.
We may classify recent EIT systems into two types. The first is characterized as one current source with switching networks. In this case, current is sequentially injected between a chosen pair of electrodes and there always exists only one active current source. The second type uses multiple current sources without any switching for current injection. With this type, one may inject a pattern of current through multiple electrodes using multiple active current sources. The sum of currents from all active current sources must be zero. In most EIT systems belonging to both types, voltages between many electrode pairs are simultaneously measured using multiple voltmeters. Typical examples of the first and second types are Mk3.5 from Sheffield (Wilson et al. 2001) and ACT3 from RPI (Cook et al. 1994), respectively. Boone et al. (1997) and Saulnier (2005) summarized numerous techniques in the development of EIT systems. Figure 7.5 shows examples of EIT systems and their use for chest imaging (Oh et al. 2007a,b, 2008).
Figure 7.5 EIT systems: (a) and (b) are KHU Mark 1 16- and 32-channel multi-frequency EIT systems, respectively, and (c) is a set-up for chest imaging

The range of the trans-impedance is from a few milliohms (mΩ) to tens of ohms depending on the imaging object, number of electrodes and their configuration. Assuming injection currents of 1 mArms, for example, induced voltages are in the range of a few microvolts to tens of millivolts. Allowing a noise level of 1% of the smallest voltage, we should restrict the level below 0.1 μV and this requires state-of-the-art electronic instrumentation technology. Modern EIT systems usually acquire a complete set of current–voltage data within 10 ms for frequencies higher than 10 kHz. Temporal resolutions could be higher than 20 frames per second using a fast image reconstruction algorithm.
7.2.7 Data Collection Protocol and Data Set
A data collection protocol defines a series of injection currents and corresponding voltage measurements. In this section, we introduce only the neighboring protocol. One may find numerous data collection protocols in Holder (2005) and other literature on EIT. We assume an EIT system with E electrodes. Injecting the jth current between an adjacent pair of electrodes ![]() and
and ![]() , we measure induced boundary voltages between all neighboring pairs of electrodes
, we measure induced boundary voltages between all neighboring pairs of electrodes ![]() and
and ![]() for k = 1, 2, …, E. Any index number must be understood as a modulus of the maximal value of the index number. We define this data set as a projection, a term that has its origin in the X-ray CT area. Repeating this for all pairs of current injection electrodes with j = 1, 2, …, E, we can obtain a full set of data from E projections. The kth boundary voltage phasor in the jth injection current or the jth projection is denoted as
for k = 1, 2, …, E. Any index number must be understood as a modulus of the maximal value of the index number. We define this data set as a projection, a term that has its origin in the X-ray CT area. Repeating this for all pairs of current injection electrodes with j = 1, 2, …, E, we can obtain a full set of data from E projections. The kth boundary voltage phasor in the jth injection current or the jth projection is denoted as
![]()
for j, k = 1, 2, …, E. Since the number of injection currents or projections is E and the number of boundary voltage phasors per projection is also E, the full data set includes E2 boundary voltage phasors.
From the reciprocity theorem introduced in section 7.4 and Kirchhoff's voltage law, only E × (E − 1)/2 boundary voltage data are independent. This is the maximal amount of measurable information using E electrodes regardless of the adopted data collection protocol. This imposes a fundamental limit on the achievable spatial resolution in EIT using E electrodes regardless of the inversion method.
For each injection current between a chosen pair of neighboring electrodes, boundary voltage data between three adjacent pairs of electrodes are involved with at least one current injection electrode. These three voltage data contain the effects of unknown contact impedances between the electrodes and the skin. We may discard or include these data depending on the way in which contact impedances are treated in the chosen inversion method and electrode model, as discussed in section 7.4.
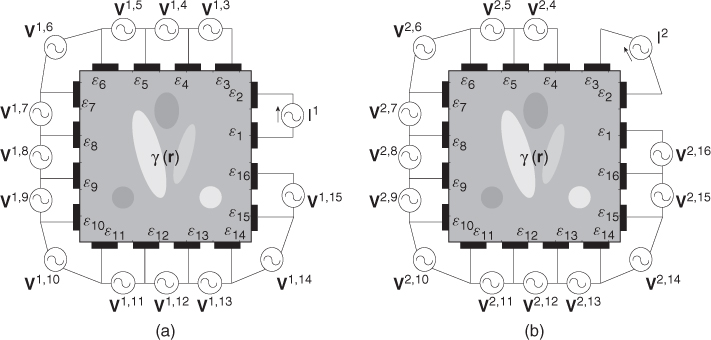
Figure 7.6 shows examples of the neighboring protocol assuming a 16-channel EIT system. For each projection, 13 boundary voltage phasors between adjacent pairs of electrodes are measured to adopt the four-electrode method. In this example, the number of projections is 16 and the total number of measured boundary voltage phasors is 16 × 13 = 208. Among them, only 104 boundary voltage phasors carry independent information. This indicates that the best spatial resolution of a reconstructed admittivity image will be about 10% of the size of the imaging object using a 16-channel EIT system with the neighboring protocol. Using a 32-channel system, we may improve it to 5%.
Figure 7.6 Neighboring data collection protocol of a 16-channel EIT system: (a) first projection with the injection current I1 between ![]() and
and ![]() ; and (b) second projection with the injection current I2 between
; and (b) second projection with the injection current I2 between ![]() and
and ![]()
We can collect boundary voltage data at multiple frequencies for a certain period of time. Assuming that we collected E2 number of boundary voltage data at each sampling time t and frequency ![]() , we can express the boundary voltage data set in matrix form as
, we can express the boundary voltage data set in matrix form as
7.15 
Alternatively, we may adopt a column vector representation as
where the superscript T means the transpose. This column vector representation will be used in sections where we study image reconstruction algorithms. For ![]() , we may collect F data vectors or matrices for each sampling time t = t1, t2, …, tN of total N times.
, we may collect F data vectors or matrices for each sampling time t = t1, t2, …, tN of total N times.
7.2.8 Linearity between Current and Voltage
Before we move on to mathematical topics in EIT, we note the linear relationship between injection currents and boundary voltages. We assume that the internal admittivity distribution ![]() , domain geometry and electrode configuration are all fixed. For an injection current Ij or the jth projection, we measure E boundary voltage phasors Vj, k for k = 1, 2, …, E to form the jth projection data vector
, domain geometry and electrode configuration are all fixed. For an injection current Ij or the jth projection, we measure E boundary voltage phasors Vj, k for k = 1, 2, …, E to form the jth projection data vector ![]() as
as
7.17 ![]()
We now inject current I as
7.18 
with some real constants αj for j = 1, 2, …, E. The corresponding projection data vector ![]() is expressed as
is expressed as
7.19 
This stems from the linearity between injection currents and induced voltages when we view the imaging object as a mixture of linear resistors and capacitors.
7.3 Representation of Physical Phenomena
We assume an imaging object occupying a domain Ω with its boundary ∂Ω and an internal admittivity distribution γ(r). Using an E-channel EIT system, we attach E surface electrodes ![]() for j = 1, …, E on ∂Ω and inject current
for j = 1, …, E on ∂Ω and inject current ![]() through an adjacent pair of electrodes as shown in Figure 7.6. We assume that the current source and sink are connected to electrodes
through an adjacent pair of electrodes as shown in Figure 7.6. We assume that the current source and sink are connected to electrodes ![]() and
and ![]() , respectively. The injection current produces internal current density and magnetic flux density distributions, which are dictated by Maxwell's equations, as in Table 7.1. Table 7.2 summarizes the variables used in Maxwell's equations.
, respectively. The injection current produces internal current density and magnetic flux density distributions, which are dictated by Maxwell's equations, as in Table 7.1. Table 7.2 summarizes the variables used in Maxwell's equations.
Table 7.1 Maxwell's equations for time-varying and time-harmonic fields
| Name | Time-varying field | Time-harmonic field |
| Gauss's law | ||
| Gauss's law for magnetism | ||
| Faraday' law of induction | ||
| Ampère's circuit law |
Table 7.2 Variables to describe time-harmonic and time-varying electromagnetic fields
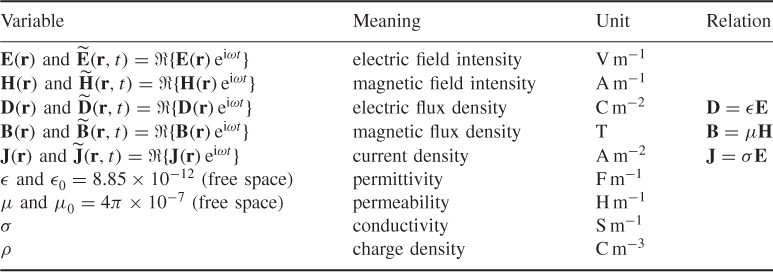
In the frequency range of a few hertz to megahertz, we adopt the elliptic PDE studied in Chapter 3 to describe the forward problem in EIT. From Maxwell's equations, we derive the elliptic PDE and its boundary conditions. After analyzing the PDE in terms of its min–max property, we formulate the EIT forward problem and its model.
7.3.1 Derivation of Elliptic PDE
To simplify mathematical derivations, we assume that the admittivity ![]() in Ω is isotropic, σ > 0 and
in Ω is isotropic, σ > 0 and ![]() < ∞. For some biological tissues, such as muscles and neural tissues, the isotropy assumption is not valid, especially at low frequencies. We assume that the magnetic permeability μ of the imaging object is μ0, the magnetic permeability of free space.
< ∞. For some biological tissues, such as muscles and neural tissues, the isotropy assumption is not valid, especially at low frequencies. We assume that the magnetic permeability μ of the imaging object is μ0, the magnetic permeability of free space.
In the frequency range of a few hertz to megahertz, we neglect the Faraday induction to get
![]()
Since E is approximately irrotational, it follows from Stokes's theorem that we can define a potential u between any two points r1 and r2 as
![]()
where ![]() is a curve in Ω joining the starting point r1 to the ending point r2. The complex potential u satisfies
is a curve in Ω joining the starting point r1 to the ending point r2. The complex potential u satisfies
![]()
From ![]() , we have the following relation:
, we have the following relation:
![]()
Since ![]() , the complex potential u satisfies the following elliptic PDE with a complex parameter γ:
, the complex potential u satisfies the following elliptic PDE with a complex parameter γ:
Note that the complex potential u is equivalent to the voltage phasor introduced in section 7.2. In the rest of this chapter, we denote u as the voltage phasor or time-harmonic voltage.
7.3.2 Elliptic PDE for Four-Electrode Method
Using the four-electrode method, we can neglect the contact impedance introduced in section 7.2. Investigating the boundary ∂Ω of the imaging object Ω with attached electrodes ![]() with k = 1, 2, …, E, we can observe the following.
with k = 1, 2, …, E, we can observe the following.
![]()

![]()
![]()
 .
.We define g as
7.21 ![]()
and call it the Neumann data of u. In practice, it is difficult to specify the Neumann data g in a pointwise sense because only the total injection current I is known. Note that the Neumann boundary data g have a singularity along the edge of each electrode and g ∉ L2(∂Ω). Fortunately, we can prove that g ∈ H−1/2(∂Ω) by the standard regularity theory in PDE. The total injection current through the electrode ![]() is
is ![]() . The condition
. The condition ![]() ensures that
ensures that ![]() is approximately a constant for each electrode since
is approximately a constant for each electrode since ![]() is normal to its level surface.
is normal to its level surface.
Expressing the boundary conditions by g, the time-harmonic voltage u is governed by
Since g is the magnitude of the current density on ∂Ω due to the injection current, g = 0 on ![]() and
and ![]() . Setting a reference voltage u(r0) = 0 for a fixed point r0 ∈ Ω, we can obtain a unique solution u of (7.22) from γ and g. Note that u depends on γ, g and the geometry of Ω. When γ changes with
. Setting a reference voltage u(r0) = 0 for a fixed point r0 ∈ Ω, we can obtain a unique solution u of (7.22) from γ and g. Note that u depends on γ, g and the geometry of Ω. When γ changes with ![]() , so does u.
, so does u.
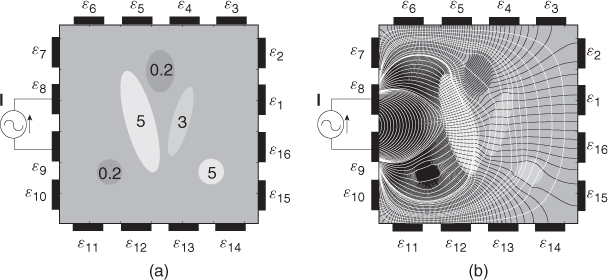
Figure 7.7 (a) An example of an electrically conducting domain with a given conductivity distribution. Numbers inside ellipsoids are conductivity values (S m−1). (b) Voltage and current density distributions induced by the injection current. Black and white lines are equipotential and current density streamlines, respectively
![]()

![]()
![]()
![]()
![]()
7.3.3 Elliptic PDE for Two-Electrode Method
When we adopt the two-electrode method where we measure voltages on current injection electrodes, we must take into account of the contact impedance. We introduce the complete electrode model (Cheng et al. 1989; Somersalo et al. 1992; Vauhkonen et al. 1996), where the complex potential u satisfies
where zk is the contact impedance of the kth electrode ![]() and Uk is the voltage on
and Uk is the voltage on ![]() . Setting a reference voltage having
. Setting a reference voltage having ![]() , we can obtain a unique solution u of (7.26).
, we can obtain a unique solution u of (7.26).
In this case, measured boundary voltages are
![]()
Using an E-channel EIT system, we may inject E number of currents through adjacent pairs of electrodes and measure the following voltage data set:
![]()
The voltage data are influenced by contact impedances whose values are unknown. Since the reciprocity principle Vk, j = Vj, k in section 7.4 still holds, ![]() contains at most E(E − 1)/2 number of independent data.
contains at most E(E − 1)/2 number of independent data.
7.3.4 Min–Max Property of Complex Potential
The variational form of the problem (7.22) with the Neumann boundary condition is
According to the Lax–Milgram theorem in Chapter 4, for a given g ∈ H−1/2(∂Ω) with ∫∂Ωg ds = 0, there exists a unique solution u ∈ H1(Ω) with ∫∂Ωu ds = 0 satisfying (7.27). When ![]() , we can figure out the global structure of
, we can figure out the global structure of ![]() using its weighted mean value property, maximum principle and minimization property of the corresponding energy functional:
using its weighted mean value property, maximum principle and minimization property of the corresponding energy functional:
When ![]() , the potential
, the potential ![]() does not have the minimization property (7.28), mean value property and maximum principle. Denoting
does not have the minimization property (7.28), mean value property and maximum principle. Denoting ![]() and
and ![]() , u = v + ih satisfies the following coupled system:
, u = v + ih satisfies the following coupled system:
7.29 
The complex potential u has the min-max property (Cherkaeva and Cherkaev 1995) in the sense that
7.30 
and
7.31 
7.4 Forward Problem and Model
We describe the forward problem of EIT using the Neumann-to-Dirichlet (NtD) data, which depend on the admittivity γ. After introducing the continuous NtD data and some theoretical issues, we formulate the discrete NtD data of an E-channel EIT system.
7.4.1 Continuous Neumann-to-Dirichlet Data
We define the continuous NtD data set Λγ as
7.32 ![]()
7.33 ![]()
where ![]() is the unique solution of the Neumann boundary value problem
is the unique solution of the Neumann boundary value problem
7.34 
This NtD data Λγ include all possible Cauchy data. With this full data set, the forward problem of EIT is modeled as the map
and the inverse problem is to invert the map in (7.35).
There are two major theoretical questions regarding the map.
![]()
The NtD data Λγ are closely related with the Neumann function restricted on ∂Ω. The Neumann function ![]() is the solution of the following Neumann problem: for each r,
is the solution of the following Neumann problem: for each r,
![]()
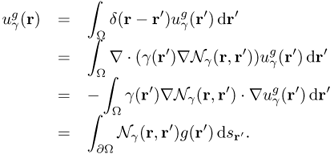
where δ is the Dirac delta function. With the use of the Neumann function ![]() , we can represent
, we can represent ![]() in terms of the singular integral:
in terms of the singular integral:
Since Λγ is the restriction of ![]() to the boundary ∂Ω, we can represent it as
to the boundary ∂Ω, we can represent it as
7.36 ![]()
The kernel ![]() with r, r′ ∈ ∂Ω can be viewed as an expression of the NtD data Λγ. Note that Λγ is sensitive to a change in the geometry of the surface ∂Ω since
with r, r′ ∈ ∂Ω can be viewed as an expression of the NtD data Λγ. Note that Λγ is sensitive to a change in the geometry of the surface ∂Ω since ![]() is singular at r = r′.
is singular at r = r′.
For the uniqueness in a three-dimensional problem, Kohn and Vogelius (1985) showed the injectivity of γ → Λγ if γ is piecewise analytic. Sylvester and Uhlmann (1987) showed the injectivity if ![]() . The smoothness condition on γ and ∂Ω has been relaxed by several researchers (Astala and Paivarinta 2006b; Brown and Uhlmann 1997; Isakov 1991; Nachman 1988, 1996).
. The smoothness condition on γ and ∂Ω has been relaxed by several researchers (Astala and Paivarinta 2006b; Brown and Uhlmann 1997; Isakov 1991; Nachman 1988, 1996).
For a two-dimensional problem, Nachman (1996) proved the uniqueness under some smoothness conditions on γ and provided a constructive way of recovering γ. Based on Nachman's proof on two-dimensional global uniqueness, Siltanen et al. (2000) developed the d-bar algorithm, which solves the full nonlinear EIT problem without iteration.
To reconstruct γ by inverting the map (7.35), it would be ideal if the full continuous NtD data Λγ are available. In practice, it is not possible to get them due to a limited number of electrodes with a finite size. It is also difficult to capture the correct geometry of ∂Ω at a reasonable cost. The map in (7.35) is highly nonlinear and insensitive to a local change of γ, as explained in section 7.4.3. All of these hinder a stable reconstruction of γ with a high spatial resolution.
7.4.2 Discrete Neumann-to-Dirichlet Data
We assume an EIT system using E electrodes ![]() for j = 1, 2, …, E. The isotropic admittivity distribution in Ω is denoted as γ. The complex potential u in (7.22) subject to the jth injection current between
for j = 1, 2, …, E. The isotropic admittivity distribution in Ω is denoted as γ. The complex potential u in (7.22) subject to the jth injection current between ![]() and
and ![]() is denoted as uj and it approximately satisfies the following Neumann boundary value problem:
is denoted as uj and it approximately satisfies the following Neumann boundary value problem:
where ![]() and the Neumann data gj are zero on the boundary regions not contacting with the current injection electrodes. Setting a reference voltage at r0 ∈ Ω as uj(r0) = 0, we can obtain a unique solution uj from γ and gj.
and the Neumann data gj are zero on the boundary regions not contacting with the current injection electrodes. Setting a reference voltage at r0 ∈ Ω as uj(r0) = 0, we can obtain a unique solution uj from γ and gj.
We assume the neighboring data collection protocol in section 7.2 to measure boundary voltages between adjacent pairs of electrodes, ![]() and
and ![]() for k = 1, 2, …, E. The kth boundary voltage difference subject to the jth injection current is denoted as
for k = 1, 2, …, E. The kth boundary voltage difference subject to the jth injection current is denoted as
where ![]() can be understood as the average of uj over
can be understood as the average of uj over ![]() .
.
7.39 ![]()
![]()
Since Vj, k[γ] is uniquely determined by the distribution of γ, it can be viewed as a function of γ. With E projections and E complex boundary voltage data for each projection, we are provided with E2 complex boundary voltage data, which are expressed in matrix form as
where Vj, k = Vj, k[γ] for a given γ.
7.41 ![]()
![]()
7.42 ![]()
![]()
The data matrix ![]() in (7.40) can be viewed as a discrete version of the NtD data since it provides all the measurable current-to-voltage relations using the E-channel EIT system. With this discrete NtD data set, the forward problem of the E-channel EIT is modeled as the map
in (7.40) can be viewed as a discrete version of the NtD data since it provides all the measurable current-to-voltage relations using the E-channel EIT system. With this discrete NtD data set, the forward problem of the E-channel EIT is modeled as the map
and the inverse problem is to invert the map in (7.43).
The smoothness condition on γ should not be a major issue in a practical EIT image reconstruction. For any discontinuous admittivity γ and an E-channel EIT system, we always find ![]() , which approximates γ in such a way that
, which approximates γ in such a way that

Taking account of inevitable measurement noise in the discrete NtD data and the ill-posedness of its inversion process, we conclude that γ and ![]() are not distinguishable in practice.
are not distinguishable in practice.
7.4.3 Nonlinearity between Admittivity and Voltage
As defined in (7.43), the forward model is a map from the admittivity to a set of boundary voltage data. From (7.37), we can see that any change in the admittivity influences all voltage values. Unlike the linear relation between currents and voltages, the map in (7.43) is nonlinear. Understanding the map should precede designing a method to invert it.
A voltage value at a point inside the domain can be expressed as a weighted average of its neighboring voltages, where the weights are determined by the admittivity distribution. In this weighted averaging method, information on the admittivity distribution is conveyed to the boundary voltage, as shown in Figure 7.8. The boundary voltage is entangled with the global structure of the admittivity distribution in a highly nonlinear way, and we investigate the relation in this section.
Figure 7.8 Nonlinearity and insensitivity grow exponentially as the matrix size increases
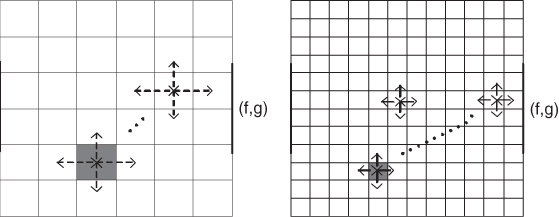
We assume that the domain Ω is a square in ![]() with its conductivity distribution σ, that is, γ = σ. We divide Ω uniformly into an N × N square mesh. Each square element is denoted as Ωi, j with its center at (xi, yj) for i, j = 1, 2, …, N. We assume that the conductivity σ is constant in each element Ωi, j, say σi, j. Let
with its conductivity distribution σ, that is, γ = σ. We divide Ω uniformly into an N × N square mesh. Each square element is denoted as Ωi, j with its center at (xi, yj) for i, j = 1, 2, …, N. We assume that the conductivity σ is constant in each element Ωi, j, say σi, j. Let
![]()
For a given σ ∈ Σ, we can express σ as
![]()
The solution u of the elliptic PDE in (7.37) with σ in place of γ can be approximated by a vector
![]()
such that each voltage uk for k = i + jN is determined by the weighted average of four neighboring voltages. To be precise, the conductivity equation
![]()
can be written as the following discretized form
with
where kT, kD, kR and kL denote top, down, right and left neighboring points of the kth point, respectively.
The discretized conductivity equation (7.44) with the Neumann boundary condition can be rewritten as a linear system of equations:
![]()
where g is the injection current vector associated with the Neumann boundary data g. Any change in σk for k = 1, 2, …, N2 spreads its influence to all uk for k = 1, 2, …, N2 through the matrix ![]() . We should note the following implications of the entanglement among σk and uk.
. We should note the following implications of the entanglement among σk and uk.
7.5 Uniqueness Theory and Direct Reconstruction Method
Before we study practical inversion methods to invert the map in (7.43), we review mathematical theories of uniqueness and a direct reconstruction technique called the d-bar method.
7.5.1 Calderón's Approach
In this section, we will assume a full NtD map Λγ as EIT data. Calderón (1980) made the following observation, which plays a key role in achieving the theoretical development of EIT, especially uniqueness theory. For a quick and easy explanation, we assume the following throughout this section:
 with its C2 boundary ∂Ω;
- γ is real and
 with γ = 1 in
  ;
;  in Ω and q = 0 in
  ;
;- γ0 = 1 is the background conductivity.
To prove his observation, Caldéron used a set of special pairs of harmonic functions that is dense in L1(Ω).
7.46 ![]()
7.47 ![]()

![]()
![]()
![]()
![]()
![]()

![]()
![]()
7.50 ![]()
![]()
Let us begin by explaining the scattering transform that transforms the conductivity equation ![]() into the Schrödinger equation
into the Schrödinger equation ![]() . This transform was first used to prove the uniqueness of EIT for
. This transform was first used to prove the uniqueness of EIT for ![]() by Sylvester and Uhlmann (1987). The following lemma explains this scattering transform.
by Sylvester and Uhlmann (1987). The following lemma explains this scattering transform.
![]()
7.51 ![]()

7.52 ![]()
7.5.2 Uniqueness and Three-Dimensional Reconstruction: Infinite Measurements
In this section, we briefly explain some impressive results on the uniqueness question and three-dimensional reconstruction in EIT mainly by Sylvester and Uhlmann (1987) and Nachman (1988). We, however, note that the reconstruction formula suggested in this section may not be appropriate for practical cases.
We define the DtN map ![]() by
by
![]()
where uj satisfies
7.53 
The goal is to prove that
![]()
![]()
![]()

![]()
![]()
![]()
![]()
![]()
![]()
![]()
7.54 ![]()
![]()
![]()
![]()
![]()
![]()
![]()
![]()
The next observation provides an explicit representation formula for q from the knowledge of the NtD map.
7.55 ![]()
7.56 ![]()

7.57 ![]()
7.5.3 Nachmann's D-bar Method in Two Dimensions
Siltanen et al. (2000) first implemented the d-bar algorithm based on Nachmann's two-dimensional global uniqueness proof of EIT. This d-bar method solves the full nonlinear EIT problem without iteration (Mueller and Siltanen 2003; Murphy and Mueller 2009).
The d-bar method is based on the fact (Lemma 7.5.3) that: ![]() is a solution of
is a solution of
where ![]() is the standard solution of the conductivity equation. We know that, for each k = k1 + ik2, there exists a unique solution ψ( ·, k) of
is the standard solution of the conductivity equation. We know that, for each k = k1 + ik2, there exists a unique solution ψ( ·, k) of
![]()
The scattering transform of q ∈ C0(Ω) can be expressed as

where ![]() is a Dirichlet-to-Neumann (DtN) map given by
is a Dirichlet-to-Neumann (DtN) map given by
![]()
where uf is a solution of ![]() in Ω with the Dirichlet boundary data uf|∂Ω = f.
in Ω with the Dirichlet boundary data uf|∂Ω = f.
Using the fact that ![]() and the above property of t(x, k), it is easy to prove that
and the above property of t(x, k), it is easy to prove that
![]()
satisfies the d-bar equation:
From (7.58), solving the d-bar equation (7.59) for μ(z, k) leads to the reconstruction algorithm for γ:
![]()
For the reconstruction algorithm, we need the following steps:
For a precise explanation of the reconstruction algorithm, let us fix notation and definitions:
- For a complex variable z = x + iy at a point z = (x, y), define the d-bar operator
 by
by
![]()
- For
 ,
,
![]()
- Define a single-layer operator
 for
for  by
by
![]()
The direct method for reconstructing γ without iteration is based on the following theorem.
![]()
![]()
![]()
7.6 Back-Projection Algorithm
Barber and Brown (1983) introduced the back-projection algorithm as a fast and practically useful algorithm in EIT. Since it was motivated by the X-ray CT algorithm, we can view it as a generalized Radon transform. However, there exists a clear difference between EIT and CT. In CT, we can obtain projected images in various directions; while, in EIT, we cannot control current pathways since the current flow itself depends on the unknown conductivity distribution to be imaged. Under the assumption that the conductivity is a small perturbation of a constant value, we can approximately apply the back-projection algorithm.
Let us begin by reviewing the well-known Radon transform. In CT, we try to reconstruct a cross-sectional image f from its X-ray projections in several different directions (cosθ, sinθ). The projection of f in direction θ can be defined by
![]()
Taking the Fourier transform of Pθf leads to

The reconstruction algorithm is based on the following expression of f in terms of its projection:

where θj = jπ/N. Hence, the image f can be computed from knowledge of its projection ![]() , j = 1, 2, …, N.
, j = 1, 2, …, N.
To quickly explain the back-projection algorithm in EIT, we assume the following:
- Ω is the unit disk in
 ;
; - γ = γ0 + δγ and γ0 = 1;
 ;
;- Pθ = (cosθ, sinθ) and z = (x, y) (or z = x + iy).
Let u0 and u denote the electric potentials corresponding to γ0 = 1 and γ with the same Neumann dipole boundary data
![]()
Writing u = u0 + δu, δu approximately satisfies the equation
where we neglect the term ![]() . When
. When ![]() is very small, u0 can be computed approximately as
is very small, u0 can be computed approximately as
![]()
where ![]() .
.
Next, we introduce a holomorphic function in Ω whose real part is − u0:
![]()
Then, Ψθ maps from the unit disk onto the upper half-plane as shown in Figure 7.9:
![]()
Define
![]()
Viewing ξ = ξ(x, y) and η = η(x, y), we have
![]()
Hence, the perturbed equation (7.60) implies that ![]() satisfies
satisfies
7.61 
For the moment, we assume that ![]() is independent of the η variable. With this temporary assumption,
is independent of the η variable. With this temporary assumption, ![]() is independent of the η variable and hence
is independent of the η variable and hence
![]()
Therefore,
![]()
For a fixed z, denote Ψθ(z) = ξθ + iηθ and ![]() (see Figure 7.10).
(see Figure 7.10).
Figure 7.9 The Ψθ transformation
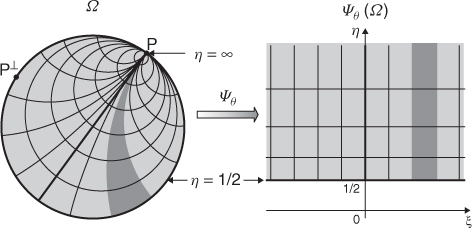
Figure 7.10 Diagram of ![]()
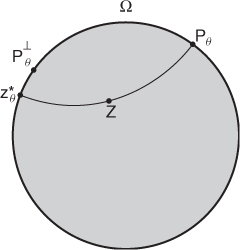
Using the relation among Ψθ, z and z*, Barber and Brown (1983) derived the reconstruction formula
7.62 
where ![]() denotes the tangential derivative at
denotes the tangential derivative at ![]() .
.
7.7 Sensitivity and Sensitivity Matrix
Recently developed image reconstruction algorithms are based on sensitivity analysis. We investigate the sensitivity of a boundary voltage Vj, k[γ] to a change in γ. We assume that the discrete NtD data ![]() in (7.40) are available. Since
in (7.40) are available. Since ![]() can be viewed as a function of γ, we denote it by
can be viewed as a function of γ, we denote it by ![]() . In order to explain the sensitivity matrix, we use the vector form
. In order to explain the sensitivity matrix, we use the vector form ![]() as
as
7.63 ![]()
or
7.64 ![]()
for j, k = 1, 2, …, E.
We assume a reference admittivity ![]() , which is a homogeneous admittivity minimizing
, which is a homogeneous admittivity minimizing
7.65 ![]()
We may assume that ![]() is a measured data set and
is a measured data set and ![]() is a computed data set by numerically solving (7.37) with a known γ0 in place of γ.
is a computed data set by numerically solving (7.37) with a known γ0 in place of γ.
7.7.1 Perturbation and Sensitivity
We consider γ that is different from a known admittivity γ0. Assume that we inject the same currents into two imaging domains with γ and γ0.

The sensitivity expression in (7.66) provides information about how much boundary voltage changes by the admittivity perturbation δγ.
7.7.2 Sensitivity Matrix
The effects of a perturbation δγ depend on the position r of the perturbation. In order to construct an explicit expression, we divide the domain Ω into small subregions and assume that γ, γ0 and δγ are constant in each subregion. With this kind of discretization, we can transform (7.66) into matrix form.
7.67 ![]()

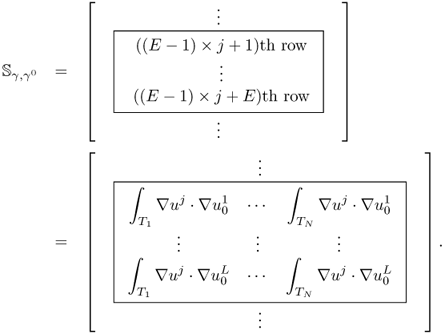
Note that the sensitivity matrix depends nonlinearly on the admittivity distributions γ and γ0.
7.7.3 Linearization
We let γ0 be a variable and make a link between changes in boundary voltages and a small admittivity perturbation δγ around γ0.
7.68 ![]()

![]()
![]()
The matrix ![]() is called the sensitivity matrix or Jacobian of the linearized EIT problem.
is called the sensitivity matrix or Jacobian of the linearized EIT problem.
7.7.4 Quality of Sensitivity Matrix
Each data collection protocol is associated with its own sensitivity matrix. We may apply the singular value decomposition explained in Chapter 2 to the sensitivity matrix. Performance of the data collection protocol is closely related with the distribution of singular values. Evaluating several sensitivity matrices from chosen data collection protocols, we may choose a best one. One may also adopt the point spreading function and analyze performance indices of a chosen data collection method, including the spatial resolution, amount of artifacts, uniformity of image contrast and others. This may suggest an optimal data collection method for a specific application.
7.8 Inverse Problem of EIT
Providing intuitive understanding about the inverse problem in EIT using RC circuits as examples, we will formulate three EIT inverse problems including static imaging, time-difference imaging and frequency-difference imaging. Based on the observations in section 7.4.3, we study the ill-posedness in those inverse problems.
7.8.1 Inverse Problem of RC Circuit
We consider two simple examples of elementary inverse problems in RC circuits.
![]()
![]()
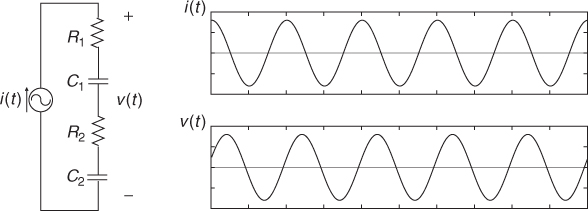
![]()
![]()
The inverse problem in Example 7.8.3 has no unique solution and is ill-posed in the sense of Hadamard. Note that we may increase the number of measurements by separately measuring two voltages across R1C1 and R2C2 to uniquely determine R1, C1, R2 and C2. One may think of numerous RC circuits with multiple measurements that are either well-posed or ill-posed.
7.8.2 Formulation of EIT Inverse Problem
We assume an EIT system using E electrodes ![]() for j = 1, 2, …, E. The admittivity inside an imaging domain Ω at time t, angular frequency
for j = 1, 2, …, E. The admittivity inside an imaging domain Ω at time t, angular frequency ![]() and position r is denoted as
and position r is denoted as ![]() .
.
7.8.2.1 Static Imaging
Static imaging in EIT is to produce an image of the admittivity ![]() from the NtD data
from the NtD data ![]() in (7.40). The image reconstruction requires inversion of the map
in (7.40). The image reconstruction requires inversion of the map
![]()
for a fixed time t and frequency ![]() . We may display images of
. We may display images of ![]() and
and ![]() separately. In each image, a pixel value is either
separately. In each image, a pixel value is either ![]() or
or ![]() (S m−1). This kind of image is ideal for all applications since it provides absolute quantitative information. One may conduct multi-frequency static imaging by obtaining multiple NtD data sets at the same time at multiple frequencies. We may call this “spectroscopic imaging”. We may perform a series of static image reconstructions consecutively at multiple times to provide a time series of admittivity images. Since static EIT imaging is technically difficult in practice, we consider difference imaging methods.
(S m−1). This kind of image is ideal for all applications since it provides absolute quantitative information. One may conduct multi-frequency static imaging by obtaining multiple NtD data sets at the same time at multiple frequencies. We may call this “spectroscopic imaging”. We may perform a series of static image reconstructions consecutively at multiple times to provide a time series of admittivity images. Since static EIT imaging is technically difficult in practice, we consider difference imaging methods.
7.8.2.2 Time-Difference Imaging
Time-difference imaging produces an image of any difference, ![]() , between two times t1 and t2 from the difference of two NtD data sets,
, between two times t1 and t2 from the difference of two NtD data sets, ![]() . For single-frequency time-difference imaging,
. For single-frequency time-difference imaging, ![]() is fixed. One may also perform multi-frequency time-difference imaging. Time-difference imaging is desirable for functional imaging to monitor physiological events over time. Though it does not provide absolute values of
is fixed. One may also perform multi-frequency time-difference imaging. Time-difference imaging is desirable for functional imaging to monitor physiological events over time. Though it does not provide absolute values of ![]() and
and ![]() , it is more feasible in practice for applications where reference NtD data at some time are available.
, it is more feasible in practice for applications where reference NtD data at some time are available.
7.8.2.3 Frequency-Difference Imaging
For applications where a time-referenced NtD data set is not available, we may consider frequency-difference imaging. It produces an image of any difference between ![]() and
and ![]() using two NtD data sets
using two NtD data sets ![]() and
and ![]() , which are acquired at the same time. One may perform frequency-difference imaging at multiple frequencies using
, which are acquired at the same time. One may perform frequency-difference imaging at multiple frequencies using ![]() . Frequency-difference imaging may classify pathological conditions of tissues without relying on any previous data. Consecutive reconstructions of frequency-difference images at multiple times may provide functional information related to changes over time.
. Frequency-difference imaging may classify pathological conditions of tissues without relying on any previous data. Consecutive reconstructions of frequency-difference images at multiple times may provide functional information related to changes over time.
7.8.3 Ill-Posedness of EIT Inverse Problem
Before we study these three inverse problems in detail, we investigate their ill-posed characteristics based on the description in section 7.4.3, where we assumed that γ = σ for simplicity. For an injection current ![]() , we are provided with a limited number of voltage data using a finite number of electrodes. The voltage data vector f corresponds to measured boundary voltages on portions of ∂Ω where voltage-sensing electrodes are attached. The inverse problem is to determine the conductivity vector
, we are provided with a limited number of voltage data using a finite number of electrodes. The voltage data vector f corresponds to measured boundary voltages on portions of ∂Ω where voltage-sensing electrodes are attached. The inverse problem is to determine the conductivity vector ![]() or equivalently the matrix
or equivalently the matrix ![]() from several measurements of current–voltage pairs (gm, fm) for m = 1, …, P, where P is the number of projections.
from several measurements of current–voltage pairs (gm, fm) for m = 1, …, P, where P is the number of projections.
The ill-posedness of the EIT inverse problem is related to the fact that the difficulty in reconstructing ![]() from (gm, fm) with m = 1, …, P increases exponentially as the size of
from (gm, fm) with m = 1, …, P increases exponentially as the size of ![]() increases. This means that the ill-posedness gets worse as we increase the number of pixels for better spatial resolution. According to (7.44), the voltage at each pixel inside the imaging domain can be expressed as the weighted average of its neighboring voltages, where weights are determined by the conductivity distribution. As explained in section 7.4.3, the measured voltage data vector f is nonlinearly entangled in the global structure of the conductivity distribution. Any internal conductivity value σk has little influence on the boundary measurements f, especially when the position of σk is away from the positions of voltage-sensing electrodes. Figure 7.8 depicts these phenomena, from which the ill-posedness originates.
increases. This means that the ill-posedness gets worse as we increase the number of pixels for better spatial resolution. According to (7.44), the voltage at each pixel inside the imaging domain can be expressed as the weighted average of its neighboring voltages, where weights are determined by the conductivity distribution. As explained in section 7.4.3, the measured voltage data vector f is nonlinearly entangled in the global structure of the conductivity distribution. Any internal conductivity value σk has little influence on the boundary measurements f, especially when the position of σk is away from the positions of voltage-sensing electrodes. Figure 7.8 depicts these phenomena, from which the ill-posedness originates.
EIT reveals technical difficulties in producing high-resolution images owing to the inherent insensitivity and nonlinearity. For a given finite number of electrodes, the amount of measurable information is limited. Increasing the size of ![]() for better spatial resolution makes the problem more ill-posed. To supply more measurements, we have to increase the number of electrodes. With reduced gaps among a larger number of electrodes, measured voltage differences will become smaller to deteriorate signal-to-noise ratios. Beyond a certain spatial resolution or the pixel size, all efforts to reduce the pixel size using a larger
for better spatial resolution makes the problem more ill-posed. To supply more measurements, we have to increase the number of electrodes. With reduced gaps among a larger number of electrodes, measured voltage differences will become smaller to deteriorate signal-to-noise ratios. Beyond a certain spatial resolution or the pixel size, all efforts to reduce the pixel size using a larger ![]() result in poorer images, since the severe ill-posedness takes over the benefit of additional information from the increased number of electrodes.
result in poorer images, since the severe ill-posedness takes over the benefit of additional information from the increased number of electrodes.
Therefore, we should not expect EIT images to have a high spatial resolution needed for structural imaging. EIT cannot compete with X-ray CT or MRI in terms of spatial resolution. One should find clinical significance of biomedical EIT from the fact that it provides unique new contrast information with a high temporal resolution using a portable machine.
7.9 Static Imaging
7.9.1 Iterative Data Fitting Method
Most static image reconstruction algorithms for an E-channel EIT system can be viewed as a data fitting method, as illustrated in Figure 7.11. We first construct a computer model of an imaging object based on (7.37). With the discretization of the imaging domain into N pixels as explained in section 7.7, we can express γ as an admittivity vector
![]()
Since we do not know the true admittivity ![]() of the imaging object, we assume an initial admittivity distribution
of the imaging object, we assume an initial admittivity distribution ![]() with m = 0 for the model. When we inject currents into both the object and the model, the corresponding measured and computed boundary voltages are different, since
with m = 0 for the model. When we inject currents into both the object and the model, the corresponding measured and computed boundary voltages are different, since ![]() in general. An image reconstruction algorithm iteratively updates
in general. An image reconstruction algorithm iteratively updates ![]() until it minimizes the difference between measured and computed boundary voltages.
until it minimizes the difference between measured and computed boundary voltages.
Figure 7.11 Static EIT image reconstruction as a data fitting method
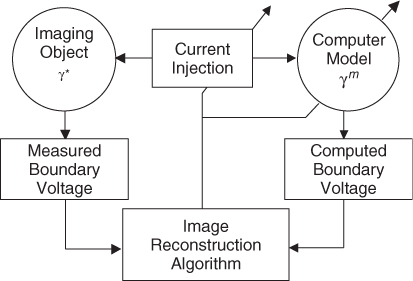
To illustrate this idea, we define the following minimization problem:
where “arg min” is an operator that gives an energy functional minimizer, ![]() is a measured NtD data vector,
is a measured NtD data vector, ![]() is the computed NtD data vector and
is the computed NtD data vector and ![]() is an admissible class for the admittivity. For the solution of (7.70), we may use an iterative nonlinear minimization algorithm such as the Newton–Raphson method (Yorkey and Webster 1987).
is an admissible class for the admittivity. For the solution of (7.70), we may use an iterative nonlinear minimization algorithm such as the Newton–Raphson method (Yorkey and Webster 1987).
In every iteration, we compute the sensitivity matrix or Jacobian ![]() in (7.69) by solving (7.37) with γm in place of γ. Solving the following linear equation
in (7.69) by solving (7.37) with γm in place of γ. Solving the following linear equation
for ![]() by
by
7.72 ![]()
we update ![]() as
as
7.73 ![]()
We may stop when
7.74 ![]()
where δ is a tolerance.
7.9.2 Static Imaging using Four-Channel EIT System
To understand the algorithm in (7.70) clearly, we consider a simple example using a four-channel EIT system. We inject sinusoidal current ![]() to each electrode pair
to each electrode pair ![]() and
and ![]() for j = 1, …, 4 and
for j = 1, …, 4 and ![]() . From these four projections, we acquire 16 voltages:
. From these four projections, we acquire 16 voltages:

Figure 7.12 shows a circular imaging object Ω, ![]() ,
, ![]() ,
, ![]() and
and ![]() .
.
Figure 7.12 Current and voltage signals from a four-channel EIT system
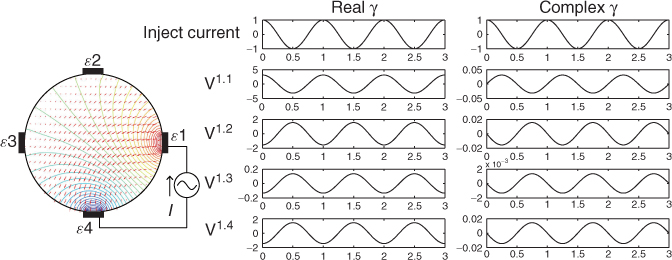
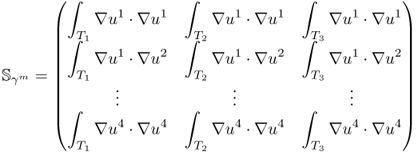
We divide the imaging domain as Ω = T1 ∪ T2 ∪ T3 ∪ T4 in Figure 7.13. Assume that γ is constant on each Tj for j = 2, 3, 4 and γ = 1 on T1. The goal is to recover γ from the NtD data in Table 7.3 using the following iteration process.
Figure 7.13 Discretized imaging domain for a four-channel EIT system
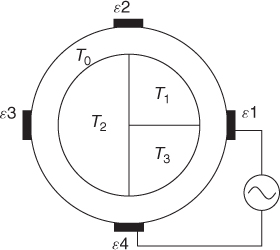
Table 7.3 NtD data from a four-channel EIT system

Figure 7.14 Voltage distributions inside the imaging object


![]()
In step 4, we used ![]() to update
to update ![]() . Recall that solving the minimization problem of
. Recall that solving the minimization problem of ![]() with the four-channel EIT is to find a minimizing sequence
with the four-channel EIT is to find a minimizing sequence ![]() such that
such that ![]() approaches its minimum effectively. The reason for this choice is that
approaches its minimum effectively. The reason for this choice is that ![]() in step 4 makes
in step 4 makes ![]() smallest with a given unit norm of
smallest with a given unit norm of ![]() .
.
To see this rigorously, assume that the true conductivity is γ* and the measured data are exact so that Vj, k = Vj, k[γ*]. According to (7.66),

Computation of the Frechét derivative of the functional Φ(γ) requires one to investigate the linear change δu: = uγ+δγ − uγ subject to a small conductivity perturbation δγ. Note that ![]() . For simplicity, we assume that δγ = 0 near ∂Ω. The relationship between δγ and the linear change δu can be explained by
. For simplicity, we assume that δγ = 0 near ∂Ω. The relationship between δγ and the linear change δu can be explained by

We have the following approximation:
![]()
We want to find the direction δγ that makes Φ(γ + δγ) − Φ(γ) smallest with a given unit norm of ||δγ||. The steepest descent direction δγ = (δγ1, δγ2, δγ3)T can be calculated by solving the matrix equation:
![]()
To understand this, we recall that ![]() and
and

We choose the direction δγ that makes Φ(γ + δγ) − Φ(γ) smallest with a given norm ||δγ|| as
![]()
Owing to
![]()
the steepest descent direction δγ must satisfy
![]()
7.9.3 Regularization
Since the Jacobian matrix in (7.71) is ill-conditioned, as explained in section 7.7, we often use a regularization method. Using the Tikhonov type regularization, we set
7.75 ![]()
where λ is a regularization parameter and ![]() is a function measuring a regularity of
is a function measuring a regularity of ![]() . This results in the following update equation for the mth iteration:
. This results in the following update equation for the mth iteration:
7.76 ![]()
where ![]() is a regularization matrix.
is a regularization matrix.
This kind of method was first introduced in EIT by Yorkey and Webster (1987), followed by numerous variations and improvements (Cheney et al. 1990, 1999; Cohen-Bacrie et al. 1997; Edic et al. 1998; Hyaric and Pidcock 2001; Lionheart et al. 2005; Vauhkonen et al. 1998; Woo et al. 1993). These include utilization of a priori information, statistical information, various forms of regularity conditions, adaptive mesh refinement and so on. Though this iterative approach is widely adopted for static imaging, it requires a large amount of computation time and produce static images with a low spatial resolution and poor accuracy for the reasons discussed in the next section. Beyond this classical technique in static imaging, new ideas are in demand for better image quality.
7.9.4 Technical Difficulty of Static Imaging
In a static EIT imaging method, we construct a forward model of the imaging object with a presumed admittivity distribution. Injecting the same currents into the model as the ones used in measurements, boundary voltages are computed to numerically simulate measured data. Since the initially guessed admittivity distribution is in general different from the unknown admittivity distribution of the object, there exist some differences between measured and computed voltages. Most static EIT imaging methods are based on a minimization technique, where a sum of these voltage differences is minimized by adjusting the admittivity distribution of the model (Adler and Lionheart 2006; Cheney et al. 1990; Lionheart et al. 2005; Woo et al. 1993; Yorkey and Webster 1987). Other methods may include layer stripping (Somersalo et al. 1991) and d-bar (Siltanen et al. 2000) algorithms.
For a static EIT image reconstruction algorithm to be reliable, we should be able to construct a forward model that mimics every aspect of the imaging object except the internal admittivity distribution. This requires knowledge of the boundary geometry, electrode positions and other sources of systematic artifacts in measured data. In practice, it is very difficult to obtain such information within a reasonable accuracy and cost, and most static EIT image reconstruction algorithms are very sensitive to these errors.
When we inject current through a pair of electrodes ![]() and
and ![]() , the induced voltage
, the induced voltage ![]() is dictated by the applied Neumann data gj of the injection current, the geometry of the domain Ω and γ. That is,
is dictated by the applied Neumann data gj of the injection current, the geometry of the domain Ω and γ. That is, ![]() satisfies approximately
satisfies approximately
7.77 ![]()
where gj represents the Neumann data in (7.37).
Taking account of the nonlinearity and ill-posedness in EIT, most image reconstruction methods for EIT use the assumption that γ is a perturbation of a known reference distribution γ0 so that we can linearize the nonlinear problem. The inverse problem is to find δγ: = γ − γ0 from the integral equation
where ![]() and dS is the surface element (Cheney et al. 1990, 1999, Lionheart et al. 2005). In practice, the value of the right-hand side of (7.78) is the potential difference uj between electrodes
and dS is the surface element (Cheney et al. 1990, 1999, Lionheart et al. 2005). In practice, the value of the right-hand side of (7.78) is the potential difference uj between electrodes ![]() and
and ![]() .
.
If the change δγ is small, we can approximate
![]()
and (7.78) becomes
where ![]() and bγ, Ω are L × L vectors with (j − 1)L + k component
and bγ, Ω are L × L vectors with (j − 1)L + k component
![]()
respectively. We may view ![]() as a linear operator acting on δγ and its discretized version in terms of the admittivity distribution is called the sensitivity matrix.
as a linear operator acting on δγ and its discretized version in terms of the admittivity distribution is called the sensitivity matrix.
To solve the inverse problem (7.79), we construct a forward model of the imaging object with a presumed reference admittivity ![]() :
:
where ![]() is a computational domain mimicking the geometry of the imaging subject,
is a computational domain mimicking the geometry of the imaging subject, ![]() is the Neumann data mimicking the applied current gj and
is the Neumann data mimicking the applied current gj and ![]() is the internal potential induced by the current corresponding to the Neumann data
is the internal potential induced by the current corresponding to the Neumann data ![]() .
.
The forward model (7.80) is used to compute the reference boundary voltage ![]() , which is expected to be substituted for
, which is expected to be substituted for ![]() in (7.79). If we have the exact forward modeling
in (7.79). If we have the exact forward modeling ![]() and
and ![]() , we may obtain reasonably accurate images of δγ by inverting the discretized version of the linear operator
, we may obtain reasonably accurate images of δγ by inverting the discretized version of the linear operator ![]() with the use of regularization. Knowing that we cannot avoid forward modeling errors, a major drawback of static imaging stems from the fact that the reconstruction problem (7.79) is very sensitive to geometric modeling errors in the computed reference data
with the use of regularization. Knowing that we cannot avoid forward modeling errors, a major drawback of static imaging stems from the fact that the reconstruction problem (7.79) is very sensitive to geometric modeling errors in the computed reference data ![]() , including boundary geometry errors on Ωc and electrode positioning errors on
, including boundary geometry errors on Ωc and electrode positioning errors on ![]() (Barber and Brown 1988; Kolehmainen et al. 2005; Nissinen et al. 2008). It would be very difficult to get accurate data
(Barber and Brown 1988; Kolehmainen et al. 2005; Nissinen et al. 2008). It would be very difficult to get accurate data ![]() at a reasonable cost in a practical environment.
at a reasonable cost in a practical environment.
To deal with undesirable effects of modeling errors, we investigate two difference imaging methods in the following sections. We expect that time or frequency derivatives of the NtD data Λσ, Ω may cancel out the effects of geometry errors on ∂Ω.
7.10 Time-Difference Imaging
In time-difference EIT (tdEIT), measured data at two different times are subtracted to produce images of changes in the admittivity distribution with respect to time. Since the data subtraction can effectively cancel out common errors, tdEIT has shown its potential as a functional imaging modality in several clinical application areas. In this section, we consider multi-frequency time-difference EIT (mftdEIT) imaging. After formulating the mftdEIT imaging problem, we study the mftdEIT image reconstruction algorithm.
7.10.1 Data Sets for Time-Difference Imaging
We assume an imaging object Ω bounded by its surface ∂Ω. The isotropic admittivity in Ω at time t, angular frequency ![]() and position r = (x, y, z) is denoted
and position r = (x, y, z) is denoted ![]() . Attaching surface electrodes
. Attaching surface electrodes ![]() for j = 1, 2, …, E on ∂Ω, we inject a sinusoidal current
for j = 1, 2, …, E on ∂Ω, we inject a sinusoidal current ![]() between a chosen pair of electrodes. A distribution of voltage in Ω is produced and we can express it as
between a chosen pair of electrodes. A distribution of voltage in Ω is produced and we can express it as ![]() .
.
Assuming an EIT system using E electrodes, we inject the jth current between an adjacent pair of electrodes denoted as ![]() and
and ![]() for j = 1, 2, …, E. The time-harmonic voltage subject to the jth injection current is denoted as
for j = 1, 2, …, E. The time-harmonic voltage subject to the jth injection current is denoted as ![]() , which is a solution of (7.37) with g replaced by gj. We assume that the EIT system is equipped with E voltmeters and each of them measures a boundary voltage between an adjacent pair of electrodes,
, which is a solution of (7.37) with g replaced by gj. We assume that the EIT system is equipped with E voltmeters and each of them measures a boundary voltage between an adjacent pair of electrodes, ![]() and
and ![]() for k = 1, 2, …, E.
for k = 1, 2, …, E.
Using an mftdEIT system, we collect complex boundary voltage data at multiple frequencies for a certain period of time. Assuming that we collected E2 number of complex boundary voltage data at each sampling time t and frequency ![]() , we can express a complex boundary voltage data vector as (7.16). We rewrite it using a column vector representation as
, we can express a complex boundary voltage data vector as (7.16). We rewrite it using a column vector representation as
7.81 ![]()
For t = t1, t2, …, tN and ![]() , we are provided with N data vectors for each one of F frequencies. To perform tdEIT imaging, we need a complex boundary voltage data vector at a reference time t0:
, we are provided with N data vectors for each one of F frequencies. To perform tdEIT imaging, we need a complex boundary voltage data vector at a reference time t0:
7.82 ![]()
for ![]() . The mftdEIT imaging problem is to produce time series of difference images using
. The mftdEIT imaging problem is to produce time series of difference images using ![]() for t = t1, t2, …, tN at each one of
for t = t1, t2, …, tN at each one of ![]() .
.
7.10.2 Equivalent Homogeneous Admittivity
For a given admittivity distribution ![]() , we define the equivalent homogeneous admittivity
, we define the equivalent homogeneous admittivity ![]() as a complex number that minimizes
as a complex number that minimizes

where ![]() is the voltage satisfying (7.37) with
is the voltage satisfying (7.37) with ![]() in place of
in place of ![]() and
and ![]() is a weighting constant. We assume that
is a weighting constant. We assume that ![]() is a small perturbation of
is a small perturbation of ![]() .
.
We set a reference frequency ![]() as well as the reference time t0. We assume that the complex boundary voltage vector
as well as the reference time t0. We assume that the complex boundary voltage vector ![]() is available at t = t0 and
is available at t = t0 and ![]() . Defining
. Defining

it measures the quantity ![]() roughly because
roughly because
7.83 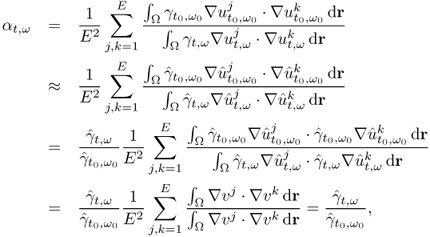
where vj and vk are solutions of (7.37) with ![]() for the jth and kth injection currents, respectively.
for the jth and kth injection currents, respectively.
We now relate a time change of the complex boundary voltage with a time change of the internal admittivity. For p = (k − 1) × E + j with j, k = 1, 2, …, E,
where ep is the unit vector in the E2 dimension having 1 at its pth component. Note that we have utilized the reciprocity theorem in section 7.4. Since we assumed that ![]() and
and ![]() are small perturbations of
are small perturbations of ![]() and
and ![]() , respectively, we have the following approximation:
, respectively, we have the following approximation:
![]()
Hence, for all p = (k − 1) × E + j, we have
7.10.3 Linear Time-Difference Algorithm using Sensitivity Matrix
We construct a computer model of the imaging object Ω. Assume that the domain of the model is Λ with its boundary ∂Λ. Discretizing the model into Q elements or pixels as ![]() , we define the time-difference image
, we define the time-difference image ![]() at time t and frequency
at time t and frequency ![]() as
as
7.86 ![]()
with
![]()
where ![]() and
and ![]() for q = 1, 2, …, Q are the admittivity values of the imaging object at times t and t0, respectively, inside a local region corresponding to the qth pixel Λq of the model Λ.
for q = 1, 2, …, Q are the admittivity values of the imaging object at times t and t0, respectively, inside a local region corresponding to the qth pixel Λq of the model Λ.
The model is assumed to be homogeneous, with ![]() in Λ. Using E electrodes, we inject current between the jth adjacent pair of electrodes to induce voltage vj in Λ. We numerically solve (7.37) for vj by using the finite element method. We can formulate the sensitivity matrix
in Λ. Using E electrodes, we inject current between the jth adjacent pair of electrodes to induce voltage vj in Λ. We numerically solve (7.37) for vj by using the finite element method. We can formulate the sensitivity matrix ![]() in section 7.7 as
in section 7.7 as
for j, k = 1, 2, …, E and q = 1, 2, …, Q. The maximal size of ![]() is E2 × Q and all of its elements are real numbers. Using the discretization and linearization, the expression (7.85) becomes
is E2 × Q and all of its elements are real numbers. Using the discretization and linearization, the expression (7.85) becomes
7.88 ![]()
Computing the truncated singular value decomposition (TSVD) of ![]() , we find P ≤ Q singular values that are not negligible. We can compute a pseudo-inverse matrix of
, we find P ≤ Q singular values that are not negligible. We can compute a pseudo-inverse matrix of ![]() after truncating its (Q − P) negligible singular values. Denoting this inverse matrix as
after truncating its (Q − P) negligible singular values. Denoting this inverse matrix as ![]() , we have
, we have
Note that ![]() is a real matrix whose maximal size is Q × E2. Since we do not know
is a real matrix whose maximal size is Q × E2. Since we do not know ![]() in (7.86), we replace (7.86) by the following equation:
in (7.86), we replace (7.86) by the following equation:
where ![]() and
and ![]() are the real and imaginary parts of a reconstructed complex tdEIT image
are the real and imaginary parts of a reconstructed complex tdEIT image ![]() , respectively.
, respectively.
We may reconstruct a time series of mftdEIT images ![]() for f = 1, 2, …, F at n = 1, 2, …, N. Choosing
for f = 1, 2, …, F at n = 1, 2, …, N. Choosing ![]() at a low frequency below 1 kHz, we may assume that
at a low frequency below 1 kHz, we may assume that ![]() since we can neglect the effects of the permittivity at low frequencies. In such a case, (7.90) becomes
since we can neglect the effects of the permittivity at low frequencies. In such a case, (7.90) becomes
Note that ![]() in (7.91) has the same phase angle as
in (7.91) has the same phase angle as ![]() .
.
7.10.4 Interpretation of Time-Difference Image
The mftdEIT image reconstruction algorithm based on (7.91) produces both real- and imaginary-part tdEIT images at multiple frequencies. It provides a theoretical basis for proper interpretation of a reconstructed image using the equivalent homogeneous complex conductivity. From (7.91), we can see that the real- and imaginary-part images represent ![]() and
and ![]() , respectively. We can interpret them as fractional changes of σ and
, respectively. We can interpret them as fractional changes of σ and ![]() between times t and t0 with respect to the square of the equivalent homogeneous conductivity
between times t and t0 with respect to the square of the equivalent homogeneous conductivity ![]() at time t0 at a low frequency
at time t0 at a low frequency ![]() .
.
We should note several precautions in using the mftdEIT image reconstruction algorithm of (7.91). First, since (7.84) is based on the reciprocity theorem, the EIT system must have a smallest possible reciprocity error. Second, the true admittivity distribution ![]() inside the imaging object at time t and
inside the imaging object at time t and ![]() should be a small perturbation of its equivalent homogeneous admittivity
should be a small perturbation of its equivalent homogeneous admittivity ![]() in order for the approximations in (7.84) and (7.85) to be valid. This is the inherent limitation of the difference imaging method using the linearization. Third, the computed voltage v in (7.87) may contain modeling errors. It would be desirable for the model Λ of the imaging object Ω to have correct boundary shape and size. We may improve the model by incorporating a more realistic boundary shape in three dimensions. Fourth, the number of non-negligible singular values of the sensitivity matrix should be maximized by optimizing the electrode configuration and data collection protocol.
in order for the approximations in (7.84) and (7.85) to be valid. This is the inherent limitation of the difference imaging method using the linearization. Third, the computed voltage v in (7.87) may contain modeling errors. It would be desirable for the model Λ of the imaging object Ω to have correct boundary shape and size. We may improve the model by incorporating a more realistic boundary shape in three dimensions. Fourth, the number of non-negligible singular values of the sensitivity matrix should be maximized by optimizing the electrode configuration and data collection protocol.
7.11 Frequency-Difference Imaging
Since tdEIT requires time-referenced data, it is not applicable to cases where such time-referenced data are not available. Examples may include imaging of tumors (Kulkarni et al. 2008; Soni et al. 2004; Trokhanova et al. 2008) and cerebral stroke (McEwan et al. 2006; Romsauerova et al. 2006a,b). Noting that admittivity spectra of numerous biological tissues show frequency-dependent changes (Gabriel et al. 1996b; Geddes and Baker 1967; Grimnes and Martinsen 2008; Oh et al. 2008), frequency-difference EIT (fdEIT) has been proposed to produce images of changes in the admittivity distribution with respect to frequency.
In early fdEIT methods, frequency-difference images were formed by back-projecting the logarithm of the ratio of two voltages at two frequencies (Fitzgerald et al. 1999; Griffiths 1987; Griffiths and Ahmed 1987a,b; Griffiths and Zhang 1989; Schlappa et al. 2000). More recent studies adopted the sensitivity matrix with a voltage difference at two frequencies (Bujnowski and Wtorek 2007; Romsauerova et al. 2006a,b; Yerworth et al. 2003). All of these methods are basically utilizing a simple voltage difference at two frequencies and a linearized image reconstruction algorithm. Alternatively, we may consider separately producing two static (absolute) images at two frequencies and then subtract one from the other. This approach, however, will suffer from the technical difficulties in static EIT imaging.
In this section, we describe an fdEIT method using a weighted voltage difference at two frequencies (Seo et al. 2008). Since the admittivity spectra of most biological tissues change with frequency, we will assume an imaging object with a frequency-dependent background admittivity in the development of fdEIT theory. We may consider two different contrast mechanisms in a reconstructed frequency-difference image. First, there exists a contrast in admittivity values between an anomaly and background. Second, the admittivity distribution itself changes with frequency.
7.11.1 Data Sets for Frequency-Difference Imaging
We assume the same setting as in section 7.10.1. Using an E-channel EIT system, we may inject E number of currents through adjacent pairs of electrodes and measure the following voltage data set:
7.92 ![]()
For t = t1, t2, …, tN and ![]() , we are provided with N data vectors for each one of F frequencies. Let us assume that we inject currents at two frequencies of
, we are provided with N data vectors for each one of F frequencies. Let us assume that we inject currents at two frequencies of ![]() and
and ![]() to obtain corresponding voltage data sets
to obtain corresponding voltage data sets ![]() and
and ![]() , respectively. The goal is to visualize changes of the admittivity distribution between
, respectively. The goal is to visualize changes of the admittivity distribution between ![]() and
and ![]() by using these two voltage data sets.
by using these two voltage data sets.
In tumor imaging or stroke detection using EIT, we are primarily interested in visualizing an anomaly. This implies that we should reconstruct a local admittivity contrast. For a given injection current, however, the boundary voltage ![]() is significantly affected by the background admittivity, boundary geometry and electrode positions, while the influence of a local admittivity contrast due to an anomaly is much smaller. Since we utilize two sets of boundary voltage data,
is significantly affected by the background admittivity, boundary geometry and electrode positions, while the influence of a local admittivity contrast due to an anomaly is much smaller. Since we utilize two sets of boundary voltage data, ![]() and
and ![]() in fdEIT, we need to evaluate their capability to perceive the local admittivity contrast. As in tdEIT, the rationale is to eliminate numerous common errors by subtracting the background component of
in fdEIT, we need to evaluate their capability to perceive the local admittivity contrast. As in tdEIT, the rationale is to eliminate numerous common errors by subtracting the background component of ![]() from
from ![]() , while preserving the local admittivity contrast component.
, while preserving the local admittivity contrast component.
7.11.2 Simple Difference 
The simple voltage difference ![]() may work well for an imaging object whose background admittivity does not change with frequency. A typical example is a saline phantom. For realistic cases where background admittivity distributions change with frequency, it will produce artifacts in reconstructed fdEIT images. To understand this, let us consider a very simple case where the imaging object has a homogeneous admittivity distribution, that is,
may work well for an imaging object whose background admittivity does not change with frequency. A typical example is a saline phantom. For realistic cases where background admittivity distributions change with frequency, it will produce artifacts in reconstructed fdEIT images. To understand this, let us consider a very simple case where the imaging object has a homogeneous admittivity distribution, that is, ![]() is independent of position. In such a homogeneous object, induced voltages
is independent of position. In such a homogeneous object, induced voltages ![]() and
and ![]() satisfy the Laplace equation with the same boundary data, and the two corresponding voltage data vectors
satisfy the Laplace equation with the same boundary data, and the two corresponding voltage data vectors ![]() and
and ![]() are parallel in such a way that
are parallel in such a way that
![]()
When there exists a small anomaly inside the imaging object, we may assume that the induced voltages are close to the voltages without any anomaly. In other words, the voltage difference ![]() in the presence of a small anomaly can be expressed as
in the presence of a small anomaly can be expressed as
![]()
for a complex constant ![]() . This means that the simple difference
. This means that the simple difference ![]() significantly depends on the boundary geometry and electrode positions except for the special case where
significantly depends on the boundary geometry and electrode positions except for the special case where ![]() . This is the main reason why the use of the simple difference
. This is the main reason why the use of the simple difference ![]() cannot deal with common modeling errors even for a homogeneous imaging object.
cannot deal with common modeling errors even for a homogeneous imaging object.
7.11.3 Weighted Difference 
An imaging object including an anomaly has an inhomogeneous admittivity distribution ![]() . We define a weighted difference of the admittivity at two different frequencies
. We define a weighted difference of the admittivity at two different frequencies ![]() and
and ![]() at time t as
at time t as
7.93 ![]()
where α is a complex number. We assume the following two conditions:
In order to extract the anomaly from the background, we investigate the relationship between ![]() and
and ![]() . We should find a way to eliminate the background influence while maintaining the information of the admittivity contrast across the anomaly. We decompose
. We should find a way to eliminate the background influence while maintaining the information of the admittivity contrast across the anomaly. We decompose ![]() into a projection part onto
into a projection part onto ![]() and the remaining part:
and the remaining part:
where 〈 ·, · 〉 is the standard inner product of two vectors. Note that ![]() is orthogonal to
is orthogonal to ![]() .
.
In the absence of the anomaly, we may set ![]() and this results in
and this results in ![]() . The projection term
. The projection term ![]() mostly contains the background information, while the orthogonal term
mostly contains the background information, while the orthogonal term ![]() holds the anomaly information. To be precise,
holds the anomaly information. To be precise, ![]() provides the same information as
provides the same information as ![]() , which includes influences of the background admittivity, boundary geometry and electrode positions. The orthogonal term
, which includes influences of the background admittivity, boundary geometry and electrode positions. The orthogonal term ![]() contains the core information about a nonlinear change due to the admittivity contrast across the anomaly. This explains why the weighted difference
contains the core information about a nonlinear change due to the admittivity contrast across the anomaly. This explains why the weighted difference ![]() must be used in fdEIT.
must be used in fdEIT.
7.11.4 Linear Frequency-Difference Algorithm using Sensitivity Matrix
In this section, we drop the time index t to simplify the notation. Applying the linear approximation in section 7.7, we get the following relation:
Given α, we can reconstruct an image of ![]() using the weighted difference
using the weighted difference ![]() . Since α is not known in practice, we need to estimate it from
. Since α is not known in practice, we need to estimate it from ![]() and
and ![]() using (7.94).
using (7.94).
We discretize the imaging object Ω as ![]() , where Ωi is the ith pixel. Let
, where Ωi is the ith pixel. Let ![]() be the characteristic function of the ith element Ωi, that is,
be the characteristic function of the ith element Ωi, that is, ![]() in Ωi and zero otherwise. Let ξ1, …, ξN be complex numbers such that
in Ωi and zero otherwise. Let ξ1, …, ξN be complex numbers such that ![]() approximates
approximates

By approximating ![]() , where Uj is the solution of (7.26) with
, where Uj is the solution of (7.26) with ![]() , it follows from (7.95) that
, it follows from (7.95) that
7.96 
The reconstruction method using the approximation (7.95) is reduced to reconstructing the ![]() that minimizes the following:
that minimizes the following:
7.97 
where α is the complex number described in section 7.11.3. In order to find ξ = (ξ1, …, ξN), we use the sensitivity matrix ![]() in (7.87). We can compute ξ = (ξ1, …, ξN) by solving the following linear system through the truncated singular value decomposition (TSVD):
in (7.87). We can compute ξ = (ξ1, …, ξN) by solving the following linear system through the truncated singular value decomposition (TSVD):
![]()
It remains to compute the fdEIT image ![]() from knowledge of ξ. We need to estimate the equivalent homogeneous (constant) admittivity
from knowledge of ξ. We need to estimate the equivalent homogeneous (constant) admittivity ![]() corresponding to
corresponding to ![]() to use the following approximation
to use the following approximation

From the divergence theorem, we obtain the following relation:

For an E-channel mfEIT system, we may choose
where we identify E + j = j and − j = E − j for j = 1, 2, 3. We reconstruct an fdEIT image ![]() by
by
where ![]() is a pseudo-inverse of
is a pseudo-inverse of ![]() .
.
7.11.5 Interpretation of Frequency-Difference Image
In (7.99), ![]() can be estimated from (7.98) using another low-frequency measurement
can be estimated from (7.98) using another low-frequency measurement ![]() . If we choose
. If we choose ![]() low enough,
low enough, ![]() may have a negligibly small imaginary part. In such a case, we may set
may have a negligibly small imaginary part. In such a case, we may set ![]() as a reconstructed fdEIT image, which is equivalent to the complex image
as a reconstructed fdEIT image, which is equivalent to the complex image ![]() divided by an unknown real constant. In practice, it would be desirable to set
divided by an unknown real constant. In practice, it would be desirable to set ![]() smaller than 1 kHz, for example 100 Hz.
smaller than 1 kHz, for example 100 Hz.
This scaling will be acceptable for applications where we are mainly looking for a contrast change within an fdEIT image. These may include detections of tumors and strokes. In order to interpret absolute pixel values of an fdEIT image quantitatively, we must estimate the value of ![]() , which requires knowledge of the object size, boundary shape and electrode positions. Alternatively, we may estimate values of
, which requires knowledge of the object size, boundary shape and electrode positions. Alternatively, we may estimate values of ![]() and
and ![]() in (7.99) without using the third frequency
in (7.99) without using the third frequency ![]() . This will again need geometrical information about the imaging object and electrode positions.
. This will again need geometrical information about the imaging object and electrode positions.
References
Adler A and Lionheart W 2006 Uses and abuses of EIDORS: an extensible software base for EIT. Physiol. Meas. 27(5), S25–S42.
Alessandrini G 1988 Stable determination of conductivity by boundary measurements. Appl. Anal. 27, 153–172.
Astala K and Paivarinta L 2006a A boundary integral equation for Calderón's inverse conductivity problem. In Proc. 7th Int. Conf. on Harmonic Analysis and Partial Differential Equations, El Escorial, Spain, June 2004; Collect. Math., Extra Volume, pp. 127–139.
Astala K and Paivarinta L 2006b Calderón's inverse conductivity problem in the plane. Ann. Math. 163, 265–299.
Barber DC and Brown BH 1983 Imaging spatial distribution of resistivity using applied potential tomography. Electron. Lett. 19, 933–935.
Barber DC and Brown BH 1984 Applied potential tomography. J. Phys. E: Sci. Instrum. 17, 723–733.
Barber DC and Brown BH 1988 Errors in reconstruction of resistivity images using a linear reconstruction technique. Clin. Phys. Physiol. Meas. 9, 101–104.
Berenstein CA, Tarabusi EC, Cohen JM and Picardello MA 1991 Integral geometry on trees. Am. J. Math. 113, 441–470.
Boone K, Barber DC and Brown BH 1997 Imaging with electricity: report of the European Concerted Action on Impedance Tomography. J. Med. Eng. Technol. 21, 201–232.
Brown R and Uhlmann G 1997 Uniqueness in the inverse conductivity problem with less regular conductivities in two dimensions. Commun. PDE 22, 1009–1027.
Brown BH, Barber DC and Seagar AD 1985 Applied potential tomography: possible clinical applications. Clin. Phys. Physiol. Meas. 6, 109–121.
Bujnowski A and Wtorek J 2007 An excitation in differential EIT selection of measurement frequencies. In Proc. 13th Int. Conf. on Electrical Bioimpedance and 8th Conf. on Electrical Impedance Tomography, Graz, Austria, 29 August–2 September. IFMBE Proceedings, vol. 17, eds. H. Scharfetter and R. Merwa. Springer, Berlin.
Calderón AP 1980 On an inverse boundary value problem. Seminar on Numerical Analysis and its Applications to Continuum Physics, pp. 65–73. Sociedade Brasileira de Matemática, Rio de Janeiro.
Cheney M, Isaacson D and Isaacson EL 1990 Exact solutions to a linearized inverse boundary value problem. Inv. Prob. 6, 923–934.
Cheney M, Isaacson D, Isaacson E, Somersalo E and Coffey EJ 1991 A layer-stripping reconstruction algorithm for impedance imaging. In Proc. 13th Annu. Int. Conf. IEEE Engineering in Medicine and Biology Society, pp. 2–4. IEEE, New York.
Cheney M, Isaacson D and Newell JC 1999 Electrical impedance tomography. SIAM Rev. 41, 85–101.
Cheng KS, Isaacson D, Newell JC and Gisser DG 1989 Electrode models for electric current computed tomography. IEEE Trans. Biomed. Eng. 36(9), 918–924.
Cherkaeva E and Cherkaev A 1995 Bounds for detectability of material damage by noisy electrical measurements. In Structural and Multidisciplinary Optimization, eds N Olhoff and GIN Rozvany, pp. 543–548. Pergamon, Oxford.
Cohen-Bacrie C, Goussard Y and Guardo R 1997 Regularized reconstruction in electrical impedance tomography using a variance uniformization constraint. IEEE Trans. Biomed. Imag. 6, 562.
Cook RD, Saulnier GJ, Gisser DG, Goble JC, Newell JC and Isaacson D 1994 ACT3: a high-speed, high-precision electrical impedance tomograph. IEEE Trans Biomed Eng. 41(8), 713–722.
Edic PM, Isaacson D, Saulnier GJ, Jain H and Newell JC 1998 An iterative Newton-Raphson method to solve the inverse admittivity problem. IEEE Trans. Biomed. Eng. 45, 899–908.
Faddeev D 1965 Growing solutions of the Schrödinger equation. Sov. Phys. Dokl. 10, 1033 (Engl. transl.).
Fitzgerald A, Holder D and Griffiths H 1999 Experimental assessment of phase magnitude imaging in multifrequency EIT by simulation and saline tank studies. Ann. NY Acad. Sci. 873, 381–387.
Fuks LF, Cheney M, Isaacson D, Gisser DG and Newell JC 1991 Detection and imaging of electric conductivity and permittivity at low frequency. IEEE Trans Biomed Eng. 38(11), 1106–1110.
Gabriel C, Gabriel S and Corthout E 1996a The dielectric properties of biological tissues: I. Literature survey. Phys. Med. Biol. 41, 2231–2249.
Gabriel S, Lau RW and Gabriel C 1996b The dielectric properties of biological tissues: II. Measurements in the frequency range 10 Hz to 20 GHz. Phys. Med. Biol. 41, 2251–2269.
Geddes LA and Baker LE 1967 The specific resistance of biological material: a compendium of data for the biomedical engineer and physiologist. Med. Biol. Eng. 5, 271–293.
Gisser DG, Isaacson D and Newell JC 1988 Theory and performance of an adaptive current tomograph system. Clin. Phys. Physiol. Meas. 9 (Suppl. A), 35–41.
Gisser DG, Isaacson D and Newell JC 1990 Electric current computed tomography and eigenvalues. SIAM J. Appl. Math. 50, 1623–1634.
Griffiths H 1987 The importance of phase measurement in electrical impedance tomography. Phys. Med. Biol. 32, 1435–1444.
Griffiths H and Ahmed A 1987a A dual-frequency applied potential tomography technique: computer simulations. Clin. Phys. Physiol. Meas. 8, 103–107.
Griffiths H and Ahmed A 1987b Electrical impedance tomography for thermal monitoring of hyperthermia treatment: an assessment using in vitro and in vivo measurements. Clin. Phys. Physiol. Meas. 8, 141–146.
Griffiths H and Zhang Z 1989 A dual-frequency electrical impedance tomography system. Phys. Med. Biol. 34, 1465–1476.
Grimnes S and Martinsen OG 2008 Bioimpedance and Bioelectricity Basics, 2nd edn. Academic Press, Oxford.
Holder D (ed.) 2005 Electrical Impedance Tomography: Methods, History and Applications. IOP Publishing, Bristol.
Hyaric AL and Pidcock MK 2001 An image reconstruction algorithm for three-dimensional electrical impedance tomography. IEEE Trans. Biomed. Eng. 48, 230–235.
Isaacson D and Cheney M 1991 Effects of measurement precision and finite numbers of electrodes on linear impedance imaging algorithms. SIAM J. Appl. Math. 15, 1705–1731.
Isaacson D, Newell JC and Gisser DG 1989 Rapid assessment of electrode characteristics for impedance imaging. In Proc. 11th Annu. Int. Conf. IEEE Engineering in Medicine and Biology Society, pp. 474–475. IEEE, New York.
Isaacson D, Blue RS and Newell JC 1996 A 3-D impedance imaging algorithm for multiple layers of electrodes. In Proc. Association for the Advancement of Medical Instrumentation Conf.
Isakov V 1991 Completeness of products of solutions and some inverse problems for PDE. J. Differ. Eqns 92, 305–317.
Kenig CE, Sjostrand J and Uhlmann G 2007 The Calderón problem with partial data. Ann. Math. 165, 567–591.
Kohn R and Vogelius M 1984 Identification of an unknown conductivity by means of measurements at the boundary. In Inverse Problems. SIAM–AMS Proceedings, vol. 14, pp. 113–123.
Kohn R and Vogelius M 1985 Determining conductivity by boundary measurements: II. Interior results. Commun. Pure Appl. Math. 38, 643–667.
Kolehmainen V, Lassas M and Ola P 2005 The inverse conductivity problem with an imperfectly known boundary. SIAM J. Appl. Math. 66, 365–383.
Kulkarni R, Boverman G, Isaacson D, Saulnier GJ, Kao TJ and Newell JC 2008 An analytical layered forward model for breasts in electrical impedance tomography. Physiol. Meas. 29, S27–S40.
Lionheart W, Polydorides N and Borsic A 2005 The reconstruction problem. In Electrical Impedance Tomography: Methods, History and Applications, ed. D Holder. IOP Publishing, Bristol.
McEwan A, Romsauerova A, Yerworth R, Horesh L, Bayford R and Holder D 2006 Design and calibration of a compact multi-frequency EIT system for acute stroke imaging. Physiol. Meas. 27, S199–S210.
Mueller JL and Siltanen S 2003 Direct reconstructions of conductivities from boundary measurements. SIAM J. Sci. Comput.tion 24(4), 1232–1266.
Murphy EK and Mueller JL 2009 Effect of domain-shape modeling and measurement errors on the 2-D D-bar method for electrical impedance tomography. IEEE Trans. Med. Imag. 28(10), 1576–1584.
Nachman A 1988 Reconstructions from boundary measurements. Ann. Math. 128, 531–576.
Nachman A 1996 Global uniqueness for a two-dimensional inverse boundary value problem. Ann. Math. 143, 71–96.
Nachman A, Sylvester J and Uhlmann G 1988 An n-dimensional Borg–Levinson theorem. Commun. Math. Phys. 115, 593–605.
Newell JC, Gisser DG and Isaacson D 1988 An electric current tomograph. IEEE Trans. Biomed. Eng. 35, 828–833.
Nissinen A, Heikkinen LM and Kaipio JP 2008 The Bayesian approximation error approach for electrical impedance tomography - experimental results. Meas. Sci. Technol. 19, 015501.
Oh TI, Woo EJ and Holder D 2007a Multi-frequency EIT system with radially symmetric architecture: KHU Mark1. Physiol. Meas. 28, S183–S196.
Oh TI, Lee KH, Kim SM, Koo H, Woo EJ and Holder D 2007b Calibration methods for a multi-channel multi-frequency EIT system. Physiol. Meas. 28, S1175–S1188.
Oh TI, Koo W, Lee KH, Kim SM, Lee J, Kim SW, Seo JK and Woo EJ 2008 Validation of a multi-frequency electrical impedance tomography (mfEIT) system KHU Mark1: impedance spectroscopy and time-difference imaging. Physiol. Meas. 29, S295–S307.
Romsauerova A, McEwan A, Horesh L, Yerworth R, Bayford RH and Holder D 2006a Multi-frequency electrical impedance tomography (EIT) of the adult human head: initial findings in brain tumours, arteriovenous malformations and chronic stroke, development of an analysis method and calibration. Physiol. Meas. 27, S147–S161.
Romsauerova A, McEwan A and Holder DS 2006b Identification of a suitable current waveform for acute stroke imaging. Physiol. Meas. 27, S211–S219.
Santosa F and Vogelius M 1990 A backprojection algorithm for electrical impedance imaging. SIAM J. Appl. Math. 50, 216–243.
Saulnier GJ 2005 EIT instrumentation. In Electrical Impedance Tomography: Methods, History and Applications, ed. DS Holder. IOP Publishing, Bristol.
Schlappa J, Annese E and Griffiths H 2000 Systematic errors in multi-frequency EIT. Physiol. Meas. 21, S111–S118.
Seo JK, Lee J, Kim SW, Zribi H and Woo EJ 2008 Frequency-difference electrical impedance tomography (fdEIT): algorithm development and feasibility study. Physiol. Meas. 29, S929–S944.
Siltanen S, Mueller JL, Isaacson D 2000 An implementation of the reconstruction algorithm of A Nachman for the 2-D inverse conductivity problem. Inv. Probs 16, 681–699.
Somersalo E, Cheney M, Isaacson D and Isaacson E 1991 Layer stripping: a direct numerical method for impedance imaging. Inv. Prob. 7, 899–926.
Somersalo E, Cheney M and Isaacson D 1992 Existence and uniqueness for electrode models for electric current computed tomography. SIAM J. Appl. Math. 52, 1023–1040.
Soni NK, Hartov A, Kogel C, Poplack SP and Paulsen KD 2004 Multi-frequency electrical impedance tomography of the breast: new clinical results. Physiol. Meas. 25, S301–S314.
Sylvester J and Uhlmann G 1986 A uniqueness theorem for an inverse boundary value problem in electrical prospection. Commun. Pure Appl. Math. 39, 92–112.
Sylvester J and Uhlmann G 1987 A global uniqueness theorem for an inverse boundary value problem. Ann. Math. 125, 153–165.
Sylvester J and Uhlmann G 1988 Inverse boundary value problems at the boundary—continuous dependence. Commun. Pure Appl. Math. 41, 197–221.
Trokhanova OV, Okhapkin MB and Korjenevsky AV 2008 Dual-frequency electrical impedance mammography for the diagnosis of non-malignant breast disease. Physiol. Meas. 29, S331–S334.
Vauhkonen PJ, Vauhkonen M, Savolainen T and Kaipio JP 1996 Three-dimensional electrical impedance tomography based on the complete electrode model. IEEE Trans. Biomed. Eng 45, 1150–1160.
Vauhkonen M, Vadasz D, Karjalainen PA, Somersalo E and Kaipio JP 1998 Tikhonov regularization and prior information in electrical impedance tomography. IEEE Trans. Med. Imag. 17, 285–293.
Wexler A, Fry B and Neuman MR 1985 Impedance-computed tomography algorithm and system. Appl. Opt. 24, 3985–3992.
Wilson AJ, Milnes P, Waterworth AR, Smallwood RH and Brown BH 2001 Mk3.5: a modular, multi-frequency successor to the Mk3a EIS/EIT system. Physiol. Meas. 22, S49–S54.
Woo EJ, Hua P, Tompkins WJ and Webster JG 1993 A robust image reconstruction algorithm and its parallel implementation in electrical impedance tomography. IEEE Trans. Med. Imag. 12(2), 137–146.
Yerworth RJ, Bayford RH, Brown B, Milnes P, Conway M and Holder DS 2003 Electrical impedance tomography spectroscopy (EITS) for human head imaging. Physiol. Meas. 24, S477–S489.
Yorkey JT 1987 Personal communication (Lawrence Livermore National Laboratory, Livermore, CA, USA).
Yorkey TJ and Webster JG 1987 A comparison of impedance tomographic reconstruction algorithms. Clin. Phys. Physiol. Meas. 8 (Suppl. A), 55–62.

