Chapter 8
Anomaly Estimation and Layer Potential Techniques
Layer potential techniques have been used widely to deal with the inverse problem of recovering anomalies in a homogeneous background. The reason is that the method provides a concrete expression connecting the anomalies with measured data.
For example, consider the inverse problem of detecting an electrical conductivity anomaly, occupying a region D, inside a three-dimensional region Ω bounded by its surface ∂Ω. Assume that the complex conductivity distribution ![]() at angular frequency ω changes abruptly across the boundary ∂D and
at angular frequency ω changes abruptly across the boundary ∂D and ![]() in
in ![]() . With the aid of the fundamental solution F(r): = − 1/(4π|r|) of the Laplacian, we can provide a rigorous connection between the anomaly D and the boundary voltage–current data via the following integral equation (Kang and Seo 1996): for
. With the aid of the fundamental solution F(r): = − 1/(4π|r|) of the Laplacian, we can provide a rigorous connection between the anomaly D and the boundary voltage–current data via the following integral equation (Kang and Seo 1996): for ![]() ,
,
where g represents Neumann data corresponding to the sinusoidal injection current with an angular frequency ω, u is the induced time-harmonic voltage inside Ω, ![]() ,
, ![]() is the double-layer potential given by
is the double-layer potential given by
and ![]() is the single-layer potential given by
is the single-layer potential given by
8.3 ![]()
When the Neumann data g and Dirichlet data f are available along the boundary ∂Ω, the inverse problem is to estimate the anomaly D from knowledge of the right-hand side of the identity (8.1). Owing to the expression in the sensitivity part in (8.1) containing location information of D, the formula provides useful information in estimating the anomaly D.
8.1 Harmonic Analysis and Potential Theory
8.1.1 Layer Potentials and Boundary Value Problems for Laplace Equation
For simplicity, we will restrict ourselves to three-dimensional cases, although all the arguments in this chapter work for general dimensions with minor modifications. We also assume that both D and Ω are Lipschitz domains and ![]() . The boundary value problem of the Laplace equation can be solved by single- or double-layer potentials with a surface potential density. The reason is that a solution
. The boundary value problem of the Laplace equation can be solved by single- or double-layer potentials with a surface potential density. The reason is that a solution ![]() of the Laplace equation
of the Laplace equation ![]() in Ω can be expressed as
in Ω can be expressed as
8.4 ![]()
where
![]()
Here, the relation between the Dirichlet data f and Neumann data g is dictated by
8.5 ![]()
To see the relation more clearly, define a trace operator
The operator ![]() in (8.6) appears to be the same as
in (8.6) appears to be the same as ![]() in (8.2), but there exists a clear difference between them due to the singular kernel
in (8.2), but there exists a clear difference between them due to the singular kernel ![]() at r = r′. The following theorem explains how the double-layer potential jumps across ∂Ω due to its singular kernel.
at r = r′. The following theorem explains how the double-layer potential jumps across ∂Ω due to its singular kernel.
8.8 ![]()
Here, the term “almost everywhere” on ∂Ω means all points except a set of measure zero in ∂Ω. For detailed explanations on these issues in measure theory, see section 4.5. The proof of the boundedness of the trace operator ![]() in Theorem 8.1.1 for the Lipschitz domain Ω requires a deep knowledge on the harmonic analysis (Coifman et al. 1982, David and Journé 1984), while the proof in the C2 domain Ω is a lot simpler (Folland 1976). To prove Theorem 8.1.1, we need to use the following lemma.
in Theorem 8.1.1 for the Lipschitz domain Ω requires a deep knowledge on the harmonic analysis (Coifman et al. 1982, David and Journé 1984), while the proof in the C2 domain Ω is a lot simpler (Folland 1976). To prove Theorem 8.1.1, we need to use the following lemma.
![]()


8.10 
![]()

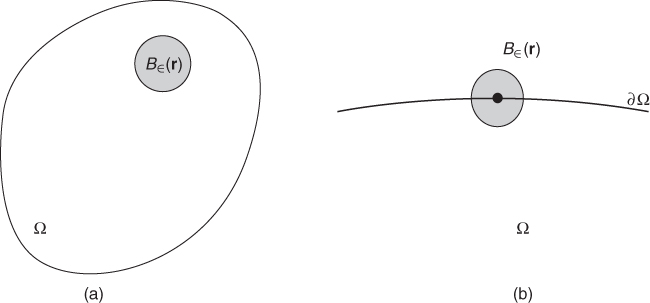
Figure 8.1 Diagrams showing (a) ![]() and
and ![]() and (b)
and (b) ![]() . The ratio
. The ratio ![]()
![]() is about half for small
is about half for small ![]()
Now, we are ready to prove the trace formula in Theorem 8.1.1. We will only prove the trace formula (8.7) under the assumption that ∂Ω is C2 and ![]() . For
. For ![]() ,
,

From Lemma 8.1.2, ![]() and
and ![]() and, therefore,
and, therefore,
Since ![]() (this property is not necessary for the proof of (8.7), and see Remark 8.1.3), ϕ(r) − ϕ(r′) = O(|r − r′|) and
(this property is not necessary for the proof of (8.7), and see Remark 8.1.3), ϕ(r) − ϕ(r′) = O(|r − r′|) and
Since ![]() as a function of r′ is integrable over ∂Ω, it follows from the Lebesgue dominated convergence theorem and Lemma 8.1.2 that
as a function of r′ is integrable over ∂Ω, it follows from the Lebesgue dominated convergence theorem and Lemma 8.1.2 that
From (8.13) and (8.11), we obtain
![]()

8.14 ![]()
8.15 ![]()
8.16 ![]()
8.17 ![]()

![]()

![]()
![]()
![]()

![]()
8.20 ![]()
8.21 ![]()
8.22 ![]()
![]()

8.24 ![]()


8.26 ![]()
8.27 ![]()
![]()
![]()
8.29 ![]()
We briefly summarize the layer potential method for the boundary value problems (BVP) of the Laplace equation on the Lipschitz domain Ω (Fabes et al. 1978). With the aid of the layer potential method, solving the Neumann BVP can be converted into the invertibility of ![]() . Since it is invertible, the potential
. Since it is invertible, the potential
![]()
satisfies
![]()
8.1.2 Regularity for Solution of Elliptic Equation along Boundary of Inhomogeneity
In this section, we study the regularity of solutions of elliptic equations on a Lipschitz interface based on the work by Escauriaza and Seo (1993). Throughout this section, let ![]() be the unit ball and let D be a Lipschitz domain with a connected boundary contained in B1/2 where Br denotes the ball with radius r and center at the origin. We consider a weak solution
be the unit ball and let D be a Lipschitz domain with a connected boundary contained in B1/2 where Br denotes the ball with radius r and center at the origin. We consider a weak solution ![]() for the elliptic equation
for the elliptic equation
where A0 and AD are positive constant matrices.
Denote by F0(r) and FD(r), respectively, the fundamental solutions of the constant-coefficient elliptic operators
![]()
We define the corresponding single-layer potentials ![]() and
and ![]() as
as

The corresponding trace operators are defined as, for r ∈ ∂D,

For ϕ ∈ H1(B), we define the interior and exterior non-tangential maximal functions of ϕ at r ∈ ∂D, respectively, as

We write
![]()
We have the following regularity result for a solution ![]() of (8.30).
of (8.30).
![]()
![]()
![]()
We will prove Theorem 8.1.6 assuming that Theorem 8.1.7 has already been proved. Take ![]() with ϕ = 1 on B3/5, and ϕ = 0 outside B4/5. Then, uϕ satisfies
with ϕ = 1 on B3/5, and ϕ = 0 outside B4/5. Then, uϕ satisfies
![]()
Introducing the Newtonian potential
![]()
we have
![]()
Since ![]() , it is easy to see that
, it is easy to see that ![]() . Let
. Let
![]()
According to Theorem 8.1.7,
Define
![]()
From (8.31), w satisfies
![]()
and we must have w = 0 in ![]() from the maximum principle, since w(r) = O(|r|−1) at infinity. Hence, we have the following representation formula:
from the maximum principle, since w(r) = O(|r|−1) at infinity. Hence, we have the following representation formula:
![]()
The theorem follows from the property of the singular integral on the Lipschitz domain.
The main step in the proof of Theorem 8.1.7 is the following estimate.
![]()
![]()
![]()


8.38 

![]()
8.41 ![]()
8.43 ![]()
8.45 ![]()
![]()
![]()
![]()
![]()
![]()
![]()
![]()
![]()
![]()
![]()
![]()
![]()


![]()
8.2 Anomaly Estimation using EIT
In this section, we focus our attention on the estimation of the sizes of anomalies with different conductivity values compared with the background tissues. We describe how to estimate their size using the relationship between injection currents and measured boundary voltages. There are many potential applications where the locations and sizes of anomalies or changes in them with time or space are of primary concern. They include monitoring of impedance-related physiological events, breast cancer detection, bubble detection in two-phase flow and others in medicine and non-destructive testing.
Let ![]() denote an electrically conducting medium and let the anomalies occupy a region D contained in the homogeneous medium Ω. Then, the conductivity distribution σ can be written as
denote an electrically conducting medium and let the anomalies occupy a region D contained in the homogeneous medium Ω. Then, the conductivity distribution σ can be written as
8.46 ![]()
where σ0 is a positive constant (which will be assumed to be 1 for simplicity) and μ is a constant such that − 1 < μ ≠ 0 < ∞. Physically, σ0 is the conductivity of the homogeneous background ![]() and σ0μ: = σD − σ0, where σD is the conductivity of the anomaly D. A high contrast in conductivity occurs at the interface ∂D between the anomaly D and the background
and σ0μ: = σD − σ0, where σD is the conductivity of the anomaly D. A high contrast in conductivity occurs at the interface ∂D between the anomaly D and the background ![]() .
.
The goal is to develop an algorithm for extracting quantitative core information about D from the relationship between the applied Neumann data ![]() and the measured Dirichlet data
and the measured Dirichlet data ![]() . Here u is the induced potential due to the Neumann data g, and it is determined by solving the Neumann problem:
. Here u is the induced potential due to the Neumann data g, and it is determined by solving the Neumann problem:
Throughout this section, ![]() , where u0 is the potential satisfying
, where u0 is the potential satisfying
8.48 ![]()

8.51 
8.52 ![]()
This theorem plays an important role in extracting location information about D. This section considers non-iterative anomaly estimation algorithms for searching its location and estimating its size.
8.2.1 Size Estimation Method
Kang et al. (1997) derived that, with the special Neumann data g = a · n where a is a unit constant vector, the volume of D can be estimated by
8.53 ![]()
where u0 is the corresponding solution of (8.47) with the homogeneous conductivity distribution. Alessandrini et al. (2000) provided a careful analysis on the bound of the size of inclusions for a quite general g and conductivity distribution. In this section, we will explain the results of Alessandrini et al. (2000) in detail.
Before presenting an analysis of size estimation, we begin by explaining the algorithm to estimate the total size of anomalies proposed by Kwon and Seo (2001). The total size estimation of anomalies ![]() uses the projection current g = a · n, where a is a unit constant vector. We may assume that Ω contains the origin. Define the scaled domain
uses the projection current g = a · n, where a is a unit constant vector. We may assume that Ω contains the origin. Define the scaled domain ![]() for a scaling factor t > 0. Let vt be the solution of the problem
for a scaling factor t > 0. Let vt be the solution of the problem

The following lemma provides a way to compute |D|.
![]()

![]()
![]()
![]()
With the aid of the above lemma, Kwon and Seo (2001) developed the following method of finding the total size of multiple anomalies.
- Suppose that
 . With an applied current g = a · n, where a is a unit constant vector, choose the unique t0, 0 < t0 < R, so that
![]()
- Then, the size of the ball
 is a good approximation of the total size of
  .
.
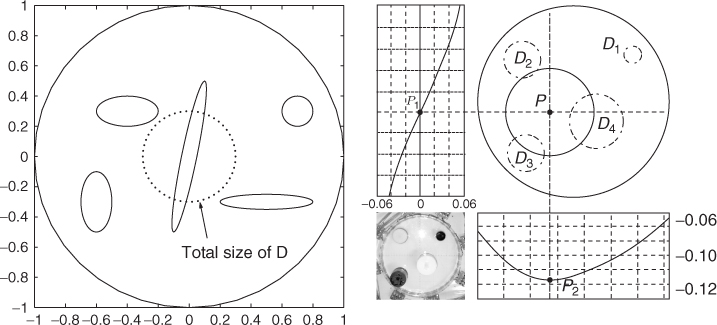
Various numerical experiments indicate that the above algorithm gives a nearly exact estimate for arbitrary multiple anomalies with a quite general conductivity distribution, as shown in Figure 8.2.
Figure 8.2 Numerical simulation for size estimation using Lemma 8.2.2 and phantom experiments for size estimation and location search. From Kwon et al. (2003). Reproduced with permission from IEEE
Next, we will provide an explanation on the background idea of the size estimation for the case where μ is small. Integrating by parts yields

where σ = 1 + μχD and ![]() . By adding the above two identities, we obtain
. By adding the above two identities, we obtain

According to the choice of t0,
![]()
If μ ≈ 0, then ![]() and
and ![]() are approximately constant,
are approximately constant, ![]() and the above identity is possible when the volume of
and the above identity is possible when the volume of ![]() is close to the total volume
is close to the total volume ![]() .
.
![]()
8.55 ![]()
8.59 ![]()
![]()

![]()
![]()
![]()
8.61 ![]()
8.63 
8.65 
8.74 
Now, we will prove Theorem 8.2.3. For p > 1, we have
We can cover D with internally non-overlapping closed cubes Qj, j = 1, …, J, with diameter ρ and ρ < d0/6. Then, (8.75) yields
We will take advantage of the fact that ![]() is a Muckenhoupt weight (Garofalo and Lin 1986):
is a Muckenhoupt weight (Garofalo and Lin 1986):
where M and p depend only on ρ, d0, λ, Ω and ![]() . The left term in (8.77) can be estimated by
. The left term in (8.77) can be estimated by

From (8.76) and the above estimate, we have
where ![]() , C2 = C1Cρλ and Cρ is the constant in (8.60). From (8.79) and the left-hand side of (8.56), we have
, C2 = C1Cρλ and Cρ is the constant in (8.60). From (8.79) and the left-hand side of (8.56), we have

This completes the proof of the right-hand side of (8.54).
8.2.2 Location Search Method
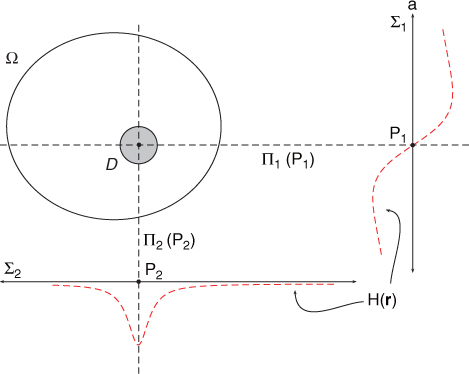
Kwon et al. (2002) developed a location search method to detect an anomaly using a pattern injection current g and boundary voltage f. We assume that the object contains a single anomaly D that is small compared with the object itself and is located away from the boundary ∂Ω. The location search algorithm is based on simple aspects of the function H(r) outside the domain Ω, which can be computed directly from the data g and f.
We choose ![]() for some fixed constant vector a.
for some fixed constant vector a.
![]()
![]()

![]()
Figure 8.3 illustrates how the location search method works. The above location search method is based on the assumption that ![]() for some constant α. Noting that
for some constant α. Noting that ![]() with the injection current g = a · n, it follows from (8.50) that
with the injection current g = a · n, it follows from (8.50) that
where
![]()
We can express w as a single-layer potential ![]() and, therefore, w is harmonic both in D and in
and, therefore, w is harmonic both in D and in ![]() . Hence, we can get the following observation by the mean value property of harmonic functions in
. Hence, we can get the following observation by the mean value property of harmonic functions in ![]() , and the uniqueness of the interior Dirichlet problem for the Laplace equation in D by considering the limit value of w(r) to the boundary ∂D.
, and the uniqueness of the interior Dirichlet problem for the Laplace equation in D by considering the limit value of w(r) to the boundary ∂D.
Figure 8.3 Relations between the location of the anomaly and the pattern of H(r) in the case of μ > 0
8.82 ![]()
We should note that this nice observation is made under the assumption that ![]() , that is,
, that is, ![]() inside the anomaly D is a fixed constant vector
inside the anomaly D is a fixed constant vector ![]() . Hence, we need to check whether the current
. Hence, we need to check whether the current ![]() generates
generates ![]() for some scalar α. In the special case where Ω and D are concentric balls, we can compute u explicitly via Fourier expansion.
for some scalar α. In the special case where Ω and D are concentric balls, we can compute u explicitly via Fourier expansion.
8.83 ![]()
8.84 ![]()
![]()
![]()
![]()
![]()
8.86 

![]()
![]()
![]()

![]()
![]()
8.89 ![]()
![]()

![]()
![]()
![]()
![]()
![]()

Although the basic idea of the algorithm is simple, several technical arguments are needed for its proof. Combining this location search algorithm with the size estimation algorithm proposed in Kwon and Seo (2001), one can select an appropriate initial guess. Figure 8.4 explains this algorithm.
Figure 8.4 Location detection by finding an intersecting point of two lines Π1(P1) and Π2(P2)
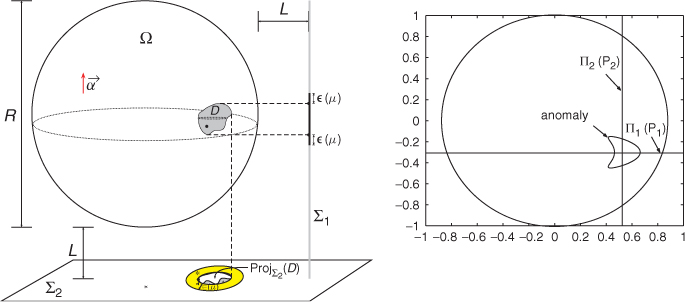
In order to test the feasibility of the location search and size estimation methods, Kwon et al. (2003) carried out phantom experiments. They used a circular phantom with 290 mm diameter as a container and filled it with NaCl solution of conductivity 0.69 S m−1. Anomalies with different conductivity values, shapes and sizes were placed inside the phantom. A total of 32 equally spaced electrodes were attached on the surface of the phantom. Using a 32-channel EIT system, they applied the algorithms to measured boundary voltage data. The circular phantom can be regarded as a unit disk ![]() by normalizing the length scale. To demonstrate how the location search and size estimation algorithm work, they placed four insulators
by normalizing the length scale. To demonstrate how the location search and size estimation algorithm work, they placed four insulators ![]() into the phantom:
into the phantom:
![]()
They injected a projection current ![]() with
with ![]() and measured the boundary voltage f. For the location search, they chose two observation lines:
and measured the boundary voltage f. For the location search, they chose two observation lines:
![]()
They evaluated the two-dimensional version of H(r) with F replaced by ![]() . In Figure 8.3, the left-hand plot is the graph of H(r) on Σ1 and the right-hand plot is the graph of H(r) on Σ2. They found the zero point of H(r) on Σ1 and the maximum point of |H(r)| on Σ2 as denoted by the black dots in Figure 8.3. The intersecting points were calculated as P( − 0.1620, − 0.0980), which was close to the center of mass PM( − 0.1184, − 0.0358). For the case of a single anomaly or a cluster of multiple anomalies, the intersecting point furnished meaningful location information.
. In Figure 8.3, the left-hand plot is the graph of H(r) on Σ1 and the right-hand plot is the graph of H(r) on Σ2. They found the zero point of H(r) on Σ1 and the maximum point of |H(r)| on Σ2 as denoted by the black dots in Figure 8.3. The intersecting points were calculated as P( − 0.1620, − 0.0980), which was close to the center of mass PM( − 0.1184, − 0.0358). For the case of a single anomaly or a cluster of multiple anomalies, the intersecting point furnished meaningful location information.
For the size estimation, the estimated total size was 0.4537 compared with the true total size of 0.4311. In Figure 8.2, the corresponding disk with the size of 0.4537 centered at P( − 0.1620, − 0.0980) is drawn with a solid line and the corresponding disk with the true size centered at PM is drawn with a dotted line. The relative error of the estimated size was about 5.24%.
8.3 Anomaly Estimation using Planar Probe
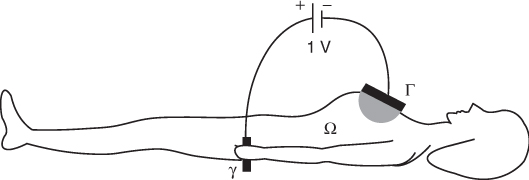
In this section, we describe anomaly estimation techniques using a local measurement from a planar probe placed on a portion of an electrically conducting object. The detection of breast cancer using a trans-admittance scanner (TAS) is a typical example of this setting. TAS is based on the experimental findings showing that the complex conductivity values of breast tumors differ significantly from those of surrounding normal tissues (Assenheimer et al. 2001; Hartov et al. 2005; Jossinet and Schmitt 1999; Silva et al. 2000). In TAS, with one hand a patient holds a reference electrode through which a sinusoidal voltage V0sinωt is applied, while a scanning probe at the ground potential is placed on the surface of the breast. The voltage difference V0sinωt produces an electric current flowing through the breast region (see Figure 8.5). The resulting electric potential at position r = (x, y, z) and time t can be expressed as the real part of u(r) eiωt, where the complex potential u(r) is governed by the equation ![]() in the object, where σ and
in the object, where σ and ![]() denote the conductivity and permittivity, respectively. The scanning probe is equipped with a planar array of electrodes and we measure exit currents (Neumann data)
denote the conductivity and permittivity, respectively. The scanning probe is equipped with a planar array of electrodes and we measure exit currents (Neumann data) ![]() , which reflect the electrical properties of tissues under the scanning probe.
, which reflect the electrical properties of tissues under the scanning probe.
Figure 8.5 Configuration for breast cancer detection using TAS
The inverse problem of TAS is to detect a suspicious abnormality in a breast region underneath the probe from measured Neumann data g. One may utilize the difference g − g0, where g0 is reference Neumann data measured beforehand without any anomaly inside the breast region (Ammari et al. 2004; Kim et al. 2008; Seo et al. 2004). This difference g − g0 can be viewed as a kind of background subtraction, so that it makes the anomaly apparently visible. However, it may not be available in practice, and calculating g0 is not possible since the inhomogeneous complex conductivity of a specific normal breast is unknown. In such a case, we should use a frequency-difference TAS method.
8.3.1 Mathematical Formulation
Let the human body occupy a three-dimensional domain Ω with a smooth boundary ∂Ω. Let Γ and γ be portions of ∂Ω, denoting the probe plane placed on the breast and the surface of the metallic reference electrode, respectively. Through γ, we apply a sinusoidal voltage of V0sinωt with frequency f = ω/2π in the range of 50 Hz to 500 kHz. Then the corresponding complex potential uω at ω satisfies the following mixed boundary value problem:
where n is the unit outward normal vector to the boundary ∂Ω. Note that both ![]() and
and ![]() depend on ω. The scan probe Γ consists of a planar array of electrodes
depend on ω. The scan probe Γ consists of a planar array of electrodes ![]() and we measure the exit current gω(j) through each electrode
and we measure the exit current gω(j) through each electrode ![]() :
:
![]()
In the frequency-difference TAS, we apply voltage at two different frequencies, f1 = ω1/2π and f2 = ω2/2π, with 50 Hz ≤ f1 < f2 ≤ 500 kHz, and measure two sets of corresponding Neumann data ![]() and
and ![]() through Γ at the same time. We assume that there exists a region of breast tumor D beneath the probe Γ so that
through Γ at the same time. We assume that there exists a region of breast tumor D beneath the probe Γ so that ![]() changes abruptly across ∂D. The inverse problem of frequency-difference TAS is to detect the anomaly D beneath Γ from the difference between
changes abruptly across ∂D. The inverse problem of frequency-difference TAS is to detect the anomaly D beneath Γ from the difference between ![]() and
and ![]() .
.
In order for any detection algorithm to be practicable, we must take account of the following limitations.
These limitations are indispensable to a TAS model in practical situations. In the frequency-difference TAS model, we use a weighted frequency difference of Neumann data ![]() instead of
instead of ![]() . The weight α is approximately
. The weight α is approximately
![]()
and it is a crucial factor in anomaly detection. We should note that the simple difference ![]() may fail to extract the anomaly owing to the complicated structure of the solution of the complex conductivity equation. We need to understand how
may fail to extract the anomaly owing to the complicated structure of the solution of the complex conductivity equation. We need to understand how ![]() reflects a contrast in complex conductivity values between the anomaly D and surrounding normal tissues.
reflects a contrast in complex conductivity values between the anomaly D and surrounding normal tissues.
We assume that σ and ![]() are isotropic, positive and piecewise smooth functions in
are isotropic, positive and piecewise smooth functions in ![]() . Let uω be the
. Let uω be the ![]() solution of (8.97). Denoting the real and imaginary parts of uω by
solution of (8.97). Denoting the real and imaginary parts of uω by ![]() and
and ![]() , the mixed boundary value problem (8.97) can be expressed as the following coupled system:
, the mixed boundary value problem (8.97) can be expressed as the following coupled system:
The measured Neumann data gω can be decomposed into
![]()
The solution of the coupled system (8.98) is a kind of saddle point (Borcea 2002; Cherkaev and Gibiansky 1994), and we have the following relations:
and
where we have ![]() and
and ![]() .
.
In order to detect a lesion D underneath the scanning probe Γ, we define a local region of interest under the probe plane Γ as shown in Figure 8.6. For simplicity, we let z be the axis normal to Γ and let the center of Γ be the origin. Hence, the probe region Γ can be approximated as a two-dimensional region ![]() , where L is the radius of the scan probe. We set the region of interest inside the breast as a half-ball
, where L is the radius of the scan probe. We set the region of interest inside the breast as a half-ball ![]() , as shown in Figure 8.6, where BL is a ball with radius L and its center at the origin.
, as shown in Figure 8.6, where BL is a ball with radius L and its center at the origin.
Figure 8.6 (a) Simplified model of the breast region with a cancerous lesion D under the scanning probe. (b) Schematic of the scanning probe in the (x, y) plane

Table 8.1 Conductivity and permittivity values of normal and tumor breast tissues

For successful anomaly detection, we should carefully choose the two frequencies ω1 and ω2. One may choose f1 = ω1/2π and f2 = ω2/2π such that
8.101 ![]()
We denote by u1 = v1 + ih1 and u2 = v2 + ih2 the complex potentials satisfying (8.98) at ω1 and ω2, respectively, and let ![]() and
and ![]() . The frequency-difference TAS aims to detect D from a weighted difference between g1 and g2.
. The frequency-difference TAS aims to detect D from a weighted difference between g1 and g2.
Now, let us investigate the connection between u1 and u2 and whether the frequency-difference Neumann data g2 − αg1 contain any information about D. Since both σ and ![]() depend on ω and
depend on ω and ![]() , σ(r, ω1) ≠ σ(r, ω2) and
, σ(r, ω1) ≠ σ(r, ω2) and ![]() . For simplicity, we denote
. For simplicity, we denote
![]()
Suppose there is a cancerous lesion D inside ![]() and the complex conductivity
and the complex conductivity ![]() changes abruptly across ∂D as in Table 8.1. To distinguish them, we denote
changes abruptly across ∂D as in Table 8.1. To distinguish them, we denote
8.102 ![]()
With the use of this notation, u1 and u2 satisfy
The next observation explains why we should use a weighted difference g2 − αg1 instead of g2 − g1.
![]()
![]()
![]()
8.3.2 Representation Formula
Observation 8.3.4 in the previous section roughly explains how D is related to g2 − αg1. In this section, the observation will be justified rigorously in a simplified model. We assume that σj, n, σj, c, ![]() and
and ![]() are constants. According to Table 8.1, the change in conductivity due to the change in frequency is small, so we assume that
are constants. According to Table 8.1, the change in conductivity due to the change in frequency is small, so we assume that
8.105 ![]()
Since the breast region of interest is relatively small compared with the entire body Ω, we may assume that Ω is the lower half-space ![]() and γ = ∞.
and γ = ∞.
Suppose that vj and hj are H1-solutions of the following coupled system for j = 1, 2:
Let uj = vj + ihj. Then V0(1 − uj) can be viewed as a solution of (8.103) with ![]() and γ = ∞.
and γ = ∞.
Let us introduce a key representation formula explaining the relationship between D and the weighted difference g2 − αg1. For each ![]() , we define
, we define
![]()
where ![]() is the reflection point of r′ with respect to the plane {z = 0} and φ(r, · ) is the
is the reflection point of r′ with respect to the plane {z = 0} and φ(r, · ) is the ![]() -solution of the following PDE:
-solution of the following PDE:

The following theorem explains an explicit relation between D and ![]() .
.
![]()

Now, let us derive a constructive formula extracting D from the representation formula (8.107) under some reasonable assumptions. We assume that
where C1 is a positive constant, Bδ is a ball with radius δ and center ![]() , and
, and ![]() . Suppose we choose ω1/2π ≈ 50 Hz and ω2/2π ≈ 100 kHz. Then the experimental data in Remark 8.3.1 shows that
. Suppose we choose ω1/2π ≈ 50 Hz and ω2/2π ≈ 100 kHz. Then the experimental data in Remark 8.3.1 shows that
![]()
Hence, in practice, we can assume that
8.109 ![]()
Based on the experimental data in Remark 8.3.1, we assume that
where κ1 and κ2 are positive constants less than ![]() and κ3 is a positive constant less than 10. Taking advantage of these, we can simplify the representation formula (8.107).
and κ3 is a positive constant less than 10. Taking advantage of these, we can simplify the representation formula (8.107).
![]()
8.112 
![]()
![]()
![]()
8.114 
We can prove the identity (8.115) for a bounded domain Ω. Using u1|γ = u2|γ = V0, we have
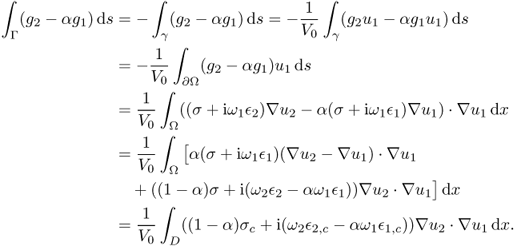
The identity (8.115) follows from the fact that
![]()
References
Alessandrini G, Rosset E and Seo JK 2000 Optimal size estimates for the inverse conductivity problem with one measurement. Proc. Am. Math. Soc. 128, 53–64.
Ammari H and Kang H 2007 Polarization and Moment Tensors: With Applications to Inverse Problems and Effective Medium Theory. Applied Mathematical Sciences, no. 162. Springer, New York.
Ammari H, Kwon O, Seo JK and Woo EJ 2004 T-scan electrical impedance imaging system for anomaly detection. SIAM J. Appl. Math. 65, 252–266.
Assenheimer M, Laver-Moskovitz O, Malonek D, Manor D, Nahliel U, Nitzan R and Saad A 2001 The T-scan technology: electrical impedance as a diagnostic tool for breast cancer detection. Physiol. Meas. 22, 1–8.
Borcea L 2002 EIT electrical impedance tomography. Inv. Prob., 18(6), R99–R136.
Cherkaev AV and Gibiansky LV 1994 Variational principles for complex conductivity, viscoelasticity and similar problems in media with complex moduli. J. Math. Phys. 35(1), 127–145.
Coifman RR, McIntosh A and Meyer Y 1982 L'intégrale de Cauchy definit un opérateur bournée sur L2 pour courbes lipschitziennes. Ann. Math. 116, 361–387.
David G and Journé JL 1984 A boundedness criterion for generalized Calderón–Zygmund operators. Ann. Math. 120, 371–397.
Escauriaza L and Seo JK 1993 Regularity properties of solutions to transmission problems. Trans. Am. Math. Soc. 338, 405–430.
Evans LC 2010 Partial Differential Equations. Graduate Studies in Mathematics, vol. 19. American Mathematical Society, Providence, RI.
Fabes E, Jodeit M and Riviére N 1978 Potential techniques for boundary value problems on C1 domains. Acta Math. 141, 165–186.
Folland G 1976 Introduction to Partial Differential Equations. Princeton University Press, Princeton, NJ.
Garofalo N and Lin F 1986 Monotonicity properties of variational integrals, Ap weights and unique continuation. Indiana Univ. Math. J. 35, 245–268.
Hartov A, Soni N and Halter R 2005 Breast cancer screening with electrical impedance tomography. In Electrical Impedance Tomography: Methods, History and Applications, ed. DS Holder, pp. 167–185. IOP Publishing, Bristol.
Hyvonen N 2004 Complete electrode model of electric impedance tomography: approximation properties and characterization of inclusions. SIAM J. Appl. Math. 64, 902–931.
Jossinet J and Schmitt M 1999 A review of parameters for the bioelectrical characterization of breast tissue. Ann. N.Y. Acad. Sci. 873, 30–41.
Kang H and Seo JK 1996 Layer potential technique for the inverse conductivity problem. Inv. Prob. 12, 267–278.
Kang H, Seo JK and Sheen D 1997 The inverse conductivity problem with one measurement: stability and estimation of size. SIAM J. Math. Anal. 28, 1389–1405.
Kenig C, Sjostrand J and Uhlmann G 2007 The Calderon problem with partial data. Ann. Math. 165, 567–591.
Kim S, Lee J, Seo JK, Woo EJ and Zribi H 2008 Multi-frequency trans-admittance scanner: mathematical framework and feasibility. SIAM J. Appl. Math. 69, 22–36.
Kwon O and Seo JK 2001 Total size estimation and identification of multiple anomalies in the inverse electrical impedance tomography. Inv. Prob. 17, 59–75.
Kwon O, Seo JK and Yoon JR 2002 A real-time algorithm for the location search of discontinuous conductivities with one measurement. Commun. Pure Appl. Math. 55, 1–29.
Kwon O, Yoon JR, Seo JK, Woo EJ and Cho YG 2003 Estimation of anomaly location and size using electrical impedance tomography. IEEE Trans. Biomed. Eng. 50, 89–96.
Rudin W 1973 Functional Analysis. McGraw-Hill, New York.
Seo JK, Kwon O, Ammari H and Woo EJ 2004 Mathematical framework and anomaly estimation algorithm for breast cancer detection: electrical impedance technique using TS2000 configuration. IEEE Trans. Biomed. Eng. 51(11), 1898–1906.
Silva JE, Marques JP and Jossinet J 2000 Classification of breast tissue by electrical impedance spectroscopy. Med. Biol. Eng. Comput. 38, 26–30.
Somersalo E, Cheney M and Isaacson D 1992 Existence and uniqueness for electrode models for electric current computed tomography. SIAM J. Appl. Math. 52, 1023–1040.
Surowiec AJ, Stuchly SS, Barr JR and Swarup A 1988 Dielectric properties of breast carcinoma and the surrounding tissues. IEEE Trans. Biomed. Eng. 35, 257–263.
Verchota G 1984 Layer potentials and boundary value problems for Laplace's equation in Lipschitz domains. J. Funct. Anal. 59, 572–611.
Further Reading
Adler A, Arnold JH, Bayford R, Borsic A, Brown B, Dixon P, Faes TJC, Frerichs I, Gagnon H, Gärber Y, Grychtol B, Hahn G, Lionheart WRB, Malik A, Patterson RP, Stocks J, Tizzard A, Weiler N and Wolf GK 2009 GREIT: a unified approach to 2D linear EIT reconstruction of lung images. Physiol. Meas. 30, S35–S55.
Alessandrini G and Magnanini R 1992 The index of isolated critical points and solutions of elliptic equations in the plane. Ann. Scu. Norm. Sup. Pisa Cl. Sci. 19, 567–589.
Alessandrini G, Isakov V and Powell J 1995 Local uniqueness in the inverse problemwith one measurement. Trans. Am. Math. Soc. 347, 3031–3041.
Ammari H and Seo JK 2003 An accurate formula for the reconstruction of conductivity inhomogeneity. Adv. Appl. Math. 30, 679–705.
Ammari H, Moskow S and Vogelius MS 2003 Boundary integral formulae for the reconstruction of electric and electromagnetic inhomogeneities of small volume. ESAIM: Control Optim. Calc. Var. 9, 49–66.
Astala K and Päivärinta L 2006 Calderon's inverse conductivity problem in the plane. Ann. Math. 163, 265–299.
Barber DC and Brown BH 1984 Applied potential tomography. J. Phys. Sci. Instrum. 17 723–733.
Bellout H and Friedman A 1988 Identification problem in potential theory. Arch. Rat. Mech. Anal. 101, 143–160.
Bellout H, Friedman A and Isakov V 1992 Inverse problem in potential theory. Trans. Am. Math. Soc. 332, 271–296.
Berenstein C and Tarabusi EC 1991 Inversion formulas for the k-dimensional Radon transform in real hyperbolic spaces. Duke Math. J. 62, 1–9.
Boone K, Barber D and Brown B 1997 Imaging with electricity: report of the European Concerted Action on Impedance Tomography. J. Med. Eng. Technol. 21(6), 201–202.
Brown R and Uhlmann G 1997 Uniqueness in the inverse conductivity problem with less regular conductivities in two dimensions. Commun. Part. Differ. Eqns 22, 1009–1027.
Brown BH, Barber DC and Seagar AD 1985 Applied potential tomography: possible clinical applications. Clin. Phys. Physiol. Meas. 6, 109–121.
Brühl M and Hanke M 2000 Numerical implementation of two non-iterative methods for locating inclusions by impedance tomography. Inv. Prob. 16, 1029–1042.
Bryan K 1991 Numerical recovery of certain discontinuous electrical conductivities. Inv. Prob. 7, 827–840.
Calderón AP 1980 On an inverse boundary value problem. In Seminar on Numerical Analysis and its Applications to Continuum Physics, pp. 65–73. Sociedade Brasileira de Matemática, Rio de Janeiro.
Cedio-Fengya DJ, Moskow S and Vogelius M 1998 Identification of conductivity imperfections of small parameter by boundary measurements. Continuous dependence and computational reconstruction. Inv. Prob. 14, 553–595.
Cheney M, Isaacson D, Newell J, Goble J and Simske S 1990 NOSER: an algorithm for solving the inverse conductivity problem. Int. J. Imag. Syst. Technol. 2, 66–75.
Cheney M, Isaacson D and Newell JC 1999 Electrical impedance tomography. SIAM Rev. 41, 85–101.
Cherepenin V, Karpov A, Korjenevsky A, Kornienko V, Mazaletskaya A, Mazourov D and Meister J 2001 A 3D electrical impedance tomography (EIT) system for breast cancer detection. Physiol. Meas. 22, 9–18.
Cherepenin V, Karpov A, Korjenevsky A, Kornienko V, Kultiasov Y, Ochapkin M, Trochanova O and Meister J 2002 Three-dimensional EIT imaging of breast tissues: system design and clinical testing. IEEE Trans. Med. Imag. 21, 662–667.
Cohen-Bacrie C and Guardo R 1997 Regularized reconstruction in electrical impedance tomography using a variance uniformization constraint. IEEE Trans. Med. Imag. 16(5), 562–571.
Colton D and Kress R 1998 Inverse Acoustic and Electromagnetic Scattering Theory, 2nd edn. Springer, Berlin.
Cook RD, Saulnier GJ, Gisser DG, Goble JG, Newell JC and Isaacson D 1994 ACT3: a high-speed, high-precision electrical impedance tomography. IEEE Trans. Biomed. Eng. 41, 713–722.
Dobson D and Santosa F 1994 An image-enhancement technique for electrical impedance tomography. Inv. Prob. 10, 317–334.
Escauriaza L, Fabes E and Verchota G 1992 On a regularity thoerem for weak solutions to transmission problems with internal Lipschitz boundaries. Proc. Am. Math. Soc. 115, 1069–1076.
Fabes E, Sand M and Seo JK 1992 The spectral radius of the classical layer potentials on convex domains. IMA Vol. Math. Appl. 42, 129–137.
Fabes E, Kang H and Seo JK 1999 Inverse conductivity problem: error estimates and approximate identification for perturbed disks. SIAM J. Math. Anal. 30, 699–720.
Feldman J and Uhlmann G 2003 Inverse Problems, Lecture Note. See http://www.math.ubc.ca/~feldman/ibook/.
Franco S 2002 Design with Operational Amplifiers and Analog Integrated Circuits, 3rd edn. McGraw-Hill, New York.
Friedman A and Isakov V 1989 On the uniqueness in the inverse conductivity problem with one measurement. Indiana Univ. Math. J. 38, 563–579.
Friedman A and Vogelius MS 1989 Identification of small inhomogeneities of extreme conductivity by boundary measurements: a theorem on continuous dependence. Arch. Rat. Mech. Anal. 105, 299–326.
Fuks LF, Cheney M, Isaacson D, Gisser DG and Newell JC 1991 Detection and imaging of electric conductivity and permittivity at low frequency. IEEE Trans. Biomed. Eng. 3, 1106–1110.
Gabriel C, Gabriel S and Corthout E 1996 The dielectric properties of biological tissues: I. Literature survey. Phys. Med. Biol. 41, 2231–2249.
Gabriel S, Lau RW and Gabriel C 1996 The dielectric properties of biological tissues: II. Measurements in the frequency range 10 Hz to 20 GHz. Phys. Med. Biol. 41, 2251–2269.
Geddes LA and Baker LE 1967 The specific resistance of biological material: a compendium of data for the biomedical engineer and physiologist. Med. Biol. Eng. 5, 271–293.
Giaquinta M 1983 Multiple Integrals in the Calculus of Variations and Non-Linear Elliptic Systems. Princeton University Press, Princeton, NJ.
Gilbarg D and Trudinger N 1998 Elliptic Partial Differential Equations of Second Order. Springer, Berlin.
Gisser DG, Isaacson D and Newell JC 1988 Theory and performance of an adaptive current tomography system. Clin. Phys. Physiol. Meas. 9 (Suppl. A), 35–41.
Gisser DG, Isaacson D and Newell JC 1990 Electric current computed tomography and eigenvalues. SIAM J. Appl. Math. 50, 1623–1634.
Grimnes S and Martinsen OG Bioimpedance and Bioelectricity Basics. Academic Press, London.
Grisvard P 1985 Elliptic Problems in Nonsmooth Domains. Monographs and Studies in Mathematics, no. 24. Pitman, Boston, MA.
Henderson RP and Webster JG 1978 An impedance camera for spatially specific measurements of the thorax. IEEE Trans. Biomed. Eng., 25, 250–254.
Hettlich F and Rundell W 1998 The determination of a discontinuity in a conductivity from a single boundary measurement. Inv. Prob. 14, 67–82.
Holder D (ed.) 2005 Electrical Impedance Tomography: Methods, History and Applications. IOP Publishing, Bristol.
Hua P, Tompkins W and Webster J 1988 A regularized electrical impedance tomography reconstruction algorithm. Clin. Phys. Physiol. Meas. 9, 137–141.
Hyaric AL and Pidcock MK 2001 An image reconstruction algorithm for three-dimensional electrical impedance tomography. IEEE Trans. Biomed. Eng. 48(2), 230–235.
Ikehata M 2000 On reconstruction in the inverse conductivity problem with one measurement. Inv. Prob. 16, 785–793.
Isaacson D 1986 Distinguishability of conductivities by electric current computed tomography. IEEE Trans. Med. Imag. 5(2), 91–95.
Isaacson D and Cheney M 1991 Effects of measurement precision and finite numbers of electrodes on linear impedance imaging algorithms. SIAM J. Appl. Math. 51 1705–1731.
Isaacson D and Cheney M 1996 Process for producing optimal current patterns for electrical impedance tomography. US Patent 5588429, 31 December.
Isaacson D and Isaacson E 1989 Comment on Calderon's paper: “On an inverse boundary value problem”. Math. Comput. 52, 553–559.
Isakov V 1988 On uniqueness of recovery of a discontinuous conductivity coefficient. Commun. Pure Appl. Math. 41, 856–877.
Isakov V 1998 Inverse Problems for Partial Differential Equations. Applied Mathematical Sciences, no. 127. Springer, New York.
Lieb EH and Loss M 2001 Analysis, 2nd edn. Graduate Studies in Mathematics, vol. 14. American Mathematical Society, Providence, RI.
Kao T, Newell JC, Saulnier GJ and Isaacson D 2003 Distinguishability of inhomogeneities using planar electrode arrays and different patterns of applied excitation. Physiol. Meas. 24, 403–411.
Kerner TE, Paulsen KD, Hartov A, Soho SK and Poplack SP 2002 Electrical impedance spectroscopy of the breast: clinical imaging results in 26 subjects. IEEE Trans. Med. Imag. 21, 638–645.
Kellogg OD 1953 Foundations of Potential Theory. Dover, New York.
Kohn R and Vogelius M 1984 Determining conductivity by boundary measurements. Commun. Pure Appl. Math. 37, 113–123.
Larson-Wiseman JL 1998 Early breast cancer detection utilizing clustered electrode arrays in impedance imaging. PhD Thesis, Rensselaer Polytechnic Institute, Troy, NY.
Lionheart W, Polydorides W and Borsic A 2005 The reconstruction problem. In Electrical Impedance Tomography: Methods, History and Applications, ed. DS Holder. IOP Publishing, Bristol.
Liu N, Saulnier GJ, Newell JC, Isaacson D and Kao TJ 2005 ACT4: a high-precision, multi-frequency electrical impedance tomography. In Proc. Conf. on Biomedical Applications of Electrical Impedance Tomography, University College London, 22–24 June.
Marsden JE 1974 Elementary Classical Analysis. W.H. Freeman, San Francisco.
Mast TD, Nachman A and Waag RC 1997 Focusing and imagining using eigenfunctions of the scattering operator. J. Acoust. Soc. Am. 102, 715–725.
Metherall P, Barber DC, Smallwood RH and Brown BH 1996 Three-dimensional electrical impedance tomography. Nature 380, 509–512.
Mueller JL, Isaacson D and Newell JC 1999 A reconstruction algorithm for electrical impedance tomography data collected on rectangular electrode arrays. IEEE Trans. Biomed. Eng. 46, 1379–1386.
Nachman A 1988 Reconstructions from boundary measurements. Ann. Math. 128, 531–577.
Nachman A 1996 Global uniqueness for a two-dimensional inverse boundary value problem. Ann. Math. 142, 71–96.
Newell JC, Gisser DG and Isaacson D 1988 An electric current tomograph. IEEE Trans. Biomed. Eng. 35, 828–833.
Oh TI, Lee J, Seo JK, Kim SW and Woo EJ 2007 Feasibility of breast cancer lesion detection using multi-frequency trans-admittance scanner (TAS) with 10 Hz to 500 kHz bandwidth. Physiol. Meas. 28, S71–S84.
Reed M and Simon B 1980 Methods of Modern Mathematical Physics I: Functional Analysis, revised and enlarged edition. Academic Press, San Diego.
Rudin W 1970 Real and complex analysis. McGraw-Hill, New York.
Santosa F and Vogelius MS 1990 A backprojection algorithm for electrical impedance imaging. SIAM J. Appl. Math. 50, 216–243.
Scholz B 2002 Towards virtual electrical breast biopsy: space-frequency MUSIC for trans-admittance data. IEEE Trans. Med. Imag. 21, 588–595.
Seo JK 1996 On the uniqueness in the inverse conductivity problem. J. Fourier Anal. Appl. 2, 227–235.
Seo JK, Lee J, Kim SW, Zribi H and Woo EJ 2008 Frequency-difference electrical impedance tomography (fdEIT): algorithm development and feasibility study. Physiol. Meas. 29, 929–944.
Stein EM and Shakarchi R 2005 Real Analysis: Measure Theory, Integration and Hilbert Spaces. Princeton University Press, Princeton, NJ.
Sylvester J and Uhlmann G 1986 A uniqueness theorem for an inverse boundary value problem in electrical prospection. Commun. Pure Appl. Math. 39, 91–112.
Sylvester J and Uhlmann G 1987 A global uniqueness theorem for an inverse boundary value problem. Ann. Math. 125, 153–169.
Sylvester J and Uhlmann G 1988 Inverse boundary value problems at the boundary—continuous dependence. Commun. Pure Appl. Math. 21, 197–221.
Tidswell AT, Gibson A, Liston A, Yerworth RJ, Bagshaw A, Wyatt J, Bayford RH and Holder DS 2001 3D electrical impedance tomography of neonatal brain activity. In Biomedical Applications of EIT, EPSRC 3rd Engineering Network Meeting, London.
Vauhkonen M, Vadasz D, Karjalainen PA, Somersalo E and Kaipio JP 1998 Tikhonov regularization and prior information in electrical impedance tomography. IEEE Trans. Med. Imag. 17(2), 285–293.
Webster J 1990 Electrical Impedance Tomography. Adam Hilger, Bristol.
Wexler A, Fry B and Neuman MR 1985 Impedance-computed tomography algorithm and system. Appl. Opt. 24, 3985–3992.
Wheeden RL and Zygmund A 1977 Measure and Integral: An Introduction to Real Analysis. Monographs and Textbooks in Pure and Applied Mathematics, vol. 43. Marcel Dekker, New York.
Wilson AJ, Milnes P, Waterworth AR, Smallwood RH and Brown BH 2001 Mk3.5: a modular, multi-frequency successor to the Mk3a EIS/EIT system. Physiol. Meas. 22, 49–54.
Woo EJ, Hua P, Webster J and Tompkins W 1993 A robust image reconstruction algorithm and its parallel implementation in electrical impedance tomography. IEEE Trans. Med. Imag. 12, 137–146.
Yorkey T, Webster J and Tompkins W 1987 Comparing reconstruction algorithms for electrical impedance tomography. IEEE Trans. Biomed. Engr. 34, 843–852.
Zhang N 1992 Electrical impedance tomography based on current density imaging. MS Thesis, University of Toronto, Canada.


