Chapter 9
Magnetic Resonance Electrical Impedance Tomography
For high-resolution static imaging of a conductivity distribution inside the human body, there have been strong needs for supplementary data to make the inverse problem well-posed and to overcome the fundamental limitations of the electrical impedance tomography (EIT) imaging methods. To bypass the ill-posed nature of EIT, magnetic resonance electrical impedance tomography (MREIT) was proposed in the early 1990s to take advantage of an MRI scanner as a tool to capture internal magnetic flux density data induced by externally injected currents (Birgul and Ider 1995; Birgul and Ider 1996; Woo et al. 1994; Zhang 1992).
MREIT aims to visualize conductivity images of an electrically conducting object using the current injection MRI technique (Joy et al. 1989; Scott et al. 1991, 1992). To probe the passive material property of the conductivity, low-frequency electrical current is injected into the imaging object through surface electrodes. This induces internal distributions of voltage u, current density J = (Jx, Jy, Jz) and magnetic flux density B = (Bx, By, Bz) dictated by Maxwell's equations. At a low frequency of less than a few kilohertz, we can ignore the effects of permittivity and consider only conductivity. For conductivity image reconstructions, MREIT relies on a set of internal magnetic flux density data, since it is dictated by the conductivity distribution σ according to Ampère's law
![]()
where μ0 is the magnetic permeability of free space.
In early MREIT systems, all three components of B = (Bx, By, Bz) have been utilized as measured data, and this requires mechanical rotations of the imaging object within the MRI scanner (Birgul et al. 2003; Ider et al. 2003; Khang et al. 2002; Kwon et al. 2002a; Lee et al. 2003a). Assuming knowledge of the full components of B, we can directly compute the current density J = (1/μ0)∇ × B and reconstruct σ using an image reconstruction algorithm such as the J-substitution algorithm (Khang et al. 2002; Kwon et al. 2002b; Lee et al. 2003a), current-constrained voltage-scaled reconstruction (CCVSR) algorithm (Birgul et al. 2003) and equipotential line methods (Ider et al. 2003; Kwon et al. 2002a). Recently, a new non-iterative conductivity image reconstruction method called current density impedance imaging (CDII) has been suggested and experimentally verified (Hasanov et al. 2008; Nachman et al. 2007, 2009). These methods using B = (Bx, By, Bz) suffer from technical difficulties related to object rotations within the main magnet of the MRI scanner.
To make the MREIT technique applicable to clinical situations, it is desirable to use only Bz data to avoid object rotation. In 2001, a constructive Bz-based MREIT algorithm called the harmonic Bz algorithm was developed, and numerical simulations and phantom experiments showed that high-resolution conductivity imaging is possible without rotating the object (Oh et al. 2003, 2004, 2005; Seo et al. 2003a). This novel algorithm is based on the key observation that the Laplacian of Bz, ΔBz, probes a change of lnσ along any curve having its tangent direction to the vector field J × (0, 0, 1). Since then, imaging techniques in MREIT have advanced rapidly and have now reached the stage of in vivo animal and human imaging experiments (Kim et al. 2008a,b; Kwon et al. 2005; Liu et al. 2007; Oh et al. 2005; Park et al. 2004a,b; Seo et al. 2004). In this chapter, we study MREIT techniques following the descriptions in Woo and Seo (2008) and Seo and Woo (2011).
9.1 Data Collection using MRI
An MREIT system comprises an MRI scanner, constant-current source and conductivity image reconstruction software. The current source is interfaced to the spectrometer of the MRI scanner to inject current in a synchronized way with a chosen MR pulse sequence. We will assume that the scanner has its main magnetic field in the z direction. The homogeneity and gradient linearity of the main magnetic field are especially important in MREIT. Conventional RF coils can be adopted as long as there is enough space for electrodes and lead wires. The sensitivity and B1 field uniformity of an RF coil significantly affect the image quality in MREIT. All possible means must be sought to minimize noise and artifacts in collected k-space data when we construct an MREIT system.
Figure 9.1(a) shows a typical MREIT current source. Oh et al. (2006) describe details of its design, including user interface, spectrometer interface and timing control for interleaved current injections. It is controlled by a microprocessor and includes circuits for waveform generation, current output, switching, discharge and auxiliary voltage measurement. The current source is usually located inside the shield room, and coaxial cables are mostly used for the connection to surface electrodes on an imaging object placed inside the bore. Carbon cables could be advantageous when a high-field MRI scanner is used. Near the imaging object inside the bore, it would be better to place the cables in the z direction.
Figure 9.1 (a) MREIT current source, (b) recessed electrode and (c) carbon-hydrogel electrode

For electrodes, we may use non-magnetic conductive materials such as copper, silver, carbon or others. An artifact occurs when a highly conductive electrode is directly attached on the surface of the imaging object, since it shields RF signals. Lee et al. (2003a) proposed a recessed electrode that has a gap of moderately conductive gel between the object's surface and a copper electrode (Figure 9.1b). Thin and flexible carbon-hydrogel electrodes with conductive adhesive (Figure 9.1c) are more commonly used in in vivo animal and human experiments, replacing bulky and rigid recessed electrodes (Jeong et al. 2008; Kim et al. 2008b; Minhas et al. 2008).
9.1.1 Measurement of Bz
Figure 9.2 shows a typical set-up for MREIT imaging experiments. We attach electrodes on the imaging object, which is positioned inside the bore of the MRI scanner. The current source is located outside the bore near the imaging object. The electrodes are connected to the current source by lead wires running in the z direction as much as possible. This is to minimize the amount of Bz inside the object induced by the currents flowing through the external lead wires (Lee et al. 2003a). Through a pair of electrodes, current is injected in a form of pulses whose timing is synchronized with an MR pulse sequence. Injected current induces a magnetic flux density B and it produces extra phase shifts. Phase accumulation is proportional to the z component Bz of B.
Figure 9.2 Structure of an MREIT current source. WG and VIC are the waveform generator and voltage-to-current converter, respectively
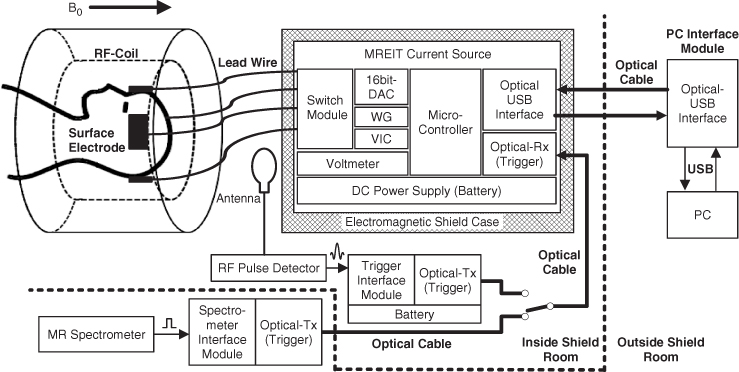
Figure 9.3 Example of a pulse sequence for MREIT. (a) For rectangular pulses, we need to know their amplitudes and widths. (b) For arbitrary waveforms, we need to know their areas. It is desirable to have a net zero DC current for a time duration of a few seconds
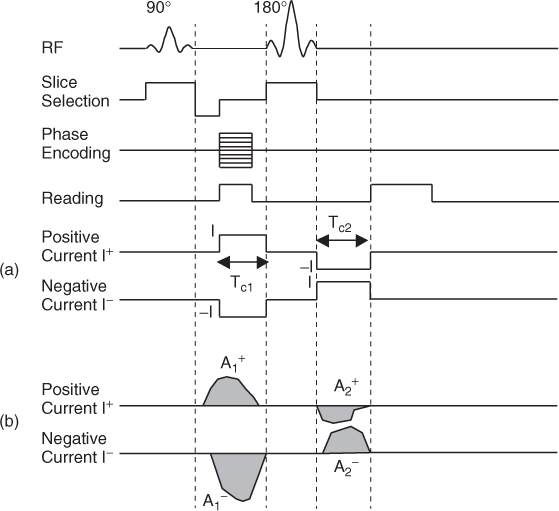
We inject current in a form of pulse, whose timing is synchronized with an MRI pulse sequence, as shown in Figure 9.3(a). To eliminate any systematic phase artifact of the MRI scanner, we sequentially inject positive and negative currents denoted as I+ and I−, respectively. For the positive injection current I+, we inject current as a positive pulse between the 90° and 180° radio-frequency (RF) pulses for ![]() milliseconds. After the 180° RF pulse, we inject current again as a negative pulse for
milliseconds. After the 180° RF pulse, we inject current again as a negative pulse for ![]() milliseconds, since the 180° RF pulse reverses the phase polarity. In effect, we inject the positive current I+ with the total current injection time of
milliseconds, since the 180° RF pulse reverses the phase polarity. In effect, we inject the positive current I+ with the total current injection time of ![]() . Similarly, we inject the negative current I− with the total current injection time of
. Similarly, we inject the negative current I− with the total current injection time of ![]() . The injection current amplitudes are ± I and they produce distributions of ± Bz, respectively, inside the imaging object. The corresponding k-space data
. The injection current amplitudes are ± I and they produce distributions of ± Bz, respectively, inside the imaging object. The corresponding k-space data ![]() are
are
where M is an MR magnitude image, γ = 26.75 × 10⁷ rad T−1 s−1 is the gyromagnetic ratio of hydrogen, δ is a systematic phase artifact and ![]() is the current pulse width in seconds. Haacke et al. (1999) and Bernstein et al. (2004) explain numerous MR imaging parameters affecting M and δ.
is the current pulse width in seconds. Haacke et al. (1999) and Bernstein et al. (2004) explain numerous MR imaging parameters affecting M and δ.
We now assume that the current pulses are not rectangular, as shown in Figure 9.3(b). We may intentionally choose sinusoidal or trapezoidal waveforms instead of rectangular pulses. In addition, practical limitations of the electronic components and reactance within the circuits may distort any chosen waveform. We denote the total area of the current pulses during ![]() and
and ![]() as
as ![]() . Similarly, we find the total area of
. Similarly, we find the total area of ![]() during
during ![]() and
and ![]() . Pretending that we have injected positive and negative currents with perfectly rectangular waveforms with amplitudes ± I, we may express (9.1) as
. Pretending that we have injected positive and negative currents with perfectly rectangular waveforms with amplitudes ± I, we may express (9.1) as
Note that the instantaneous value of Bz(x, y) is proportional to the instantaneous value of the current amplitude at every point (x, y) (Lee et al. 2003a). Throughout the entire current injection time, the distributions of Bz are identical except for scaling factors, which are proportional to the instantaneous values of the current amplitude.
We compute complex images ![]() by two-dimensional discrete Fourier transformations of
by two-dimensional discrete Fourier transformations of ![]() in either (9.1) or (9.2):
in either (9.1) or (9.2):
Dividing the two complex images to reject δ, we get the phase change Ψ due to Bz as
Finally, we get Bz as
where the constant C is either 2γTc or γ(A+ + A−)/I.
Since Bz is proportional to I, the phase change Ψ in (9.4) is proportional to ITc or (A+ + A−)/I. To maximize the phase change, we should maximize the product ITc or the areas A+ and A− within a permissible range (Reilly 1998). There are numerous technical issues to achieve this in terms of MREIT pulse sequence designs (Hamamura and Muftuler 2008; Minhas et al. 2009; Nam and Kwon 2010; Park et al. 2006).
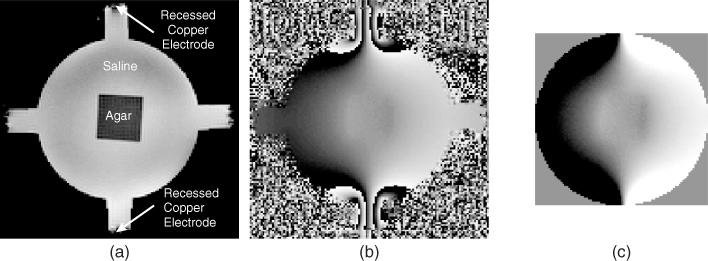
Figure 9.4(a) shows an MR magnitude image M of a cylindrical saline phantom including an agar object whose conductivity was different from that of the saline. Injection current from the top to the bottom electrodes produced the wrapped phase image in Figure 9.4(b). Such phase wrapping may not occur when the amplitude of the injection current is small. Figure 9.4(c) is the Bz image after applying a phase unwrapping algorithm. We can observe the deflection of Bz across the boundary of the agar object where a conductivity contrast exists.
Figure 9.4 (a) MR magnitude image M of a cylindrical saline phantom including an agar object. Conductivity values of the saline and agar were different. (b) Wrapped phase image subject to an injection current from the top to the bottom electrodes. (c) Corresponding image of induced Bz after applying a phase unwrapping algorithm
9.1.2 Noise in Measured Bz Data
Noise in measured Bz data is the primary limiting factor in determining the spatial resolution of a reconstructed conductivity image. To distinguish noise due to the MRI scanner itself from noise due to the current source, we first assume that the current source is noise-free and ideal in terms of its current amplitude and timing. Since the MR signals ![]() are contaminated by random noise originating from the MRI scanner itself, the measured Bz data contain random noise. The noise standard deviation
are contaminated by random noise originating from the MRI scanner itself, the measured Bz data contain random noise. The noise standard deviation ![]() in the Bz data is inversely proportional to the signal-to-noise ratio (SNR) of the MR magnitude image ϒM and the total current injection time Tc (Sadleir 2005; Scott et al. 1992):
in the Bz data is inversely proportional to the signal-to-noise ratio (SNR) of the MR magnitude image ϒM and the total current injection time Tc (Sadleir 2005; Scott et al. 1992):
We now consider a practical current source with noise and errors in its amplitude and timing, which will add extra noise in addition to that in (9.6). Examining (9.3)–(9.5), we should note that the total area (A+ + A−) must be identical for all TR cycles. This requires a high amplitude stability of the current source through an entire scan time including many TR cycles. The timing jitter in trigger signals is not critical as long as we control the timing within one microsecond, for example, since both ![]() and
and ![]() are in the range of a few milliseconds.
are in the range of a few milliseconds.
The current source includes analog and high-speed digital electronic circuits with inherent noise sources, which may increase noise in MR images. The MRI scanner itself radiates RF as well as audio-frequency (AF) electromagnetic waves, which are external interferences to the current source. RF interferences are from RF coils at around 128 MHz in a 3 T scanner. AF interferences are mostly from gradient coils with frequencies below 1 kHz (Hedeen and Edelstein et al. 1997). Connections among modules increase the vulnerability of the entire system to electromagnetic interference. Under such circumstances, a proper design of the current source is important to reduce measurement noise in MREIT.
In MREIT, the raw data are the incremental phase change, Ψ in (9.4). This phase change is proportional to the product of Bz and Tc. Since Bz is directly proportional to I, we must optimize the MREIT pulse sequence to maximize the product of I and Tc in Figure 9.3. In human imaging experiments, permissible pairs of (I, Tc) must be sought carefully, considering their physiological effects (Reilly 1998).
The spin–echo pulse sequence in Figure 9.3 has been widely used in MREIT, since it is most robust to many kinds of undesirable perturbations to the phase image. As expressed in (9.6), a prolonged current pulse width (i.e. larger Tc) reduces the noise level in measured Bz data. Park et al. (2006) proposed a new MREIT pulse sequence called injection current nonlinear encoding (ICNE), where the duration of the injection current pulse is extended until the end of the reading gradient. Since the current injection during the reading gradient disturbs the gradient linearity, they developed an algorithm to extract Bz data from the acquired MR signal using the ICNE pulse sequence. They could reduce the noise level by about 25%. For a chosen pulse sequence, Lee et al. (2006) and Kwon et al. (2007) analyzed the associated noise level and provided a way to optimize the pulse sequence to minimize it.
9.1.3 Measurement of B = (Bx, By, Bz)
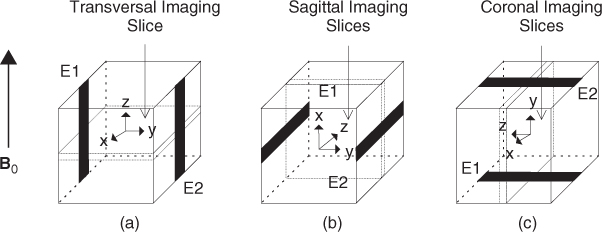
Using an MRI scanner, we can measure only one component B that is in the direction of the main magnetic field of the MRI scanner. To measure the other two components of B, the imaging object must be rotated twice, as shown in Figure 9.5. The electrodes must be kept at the same positions all the time and all the pixels should not be shifted. Though we may prevent pixels from being shifted by carefully designing the object rotation method, soft tissues and fluids inside the human body will move under gravitational forces.
Figure 9.5 (a) Current is injected into xy plane and induced Bz is measured. (b) Current is injected into yz plane and Bx is measured. (c) Current is injected into xz plane and By is measured. B0 is the main magnetic field of the MRI scanner
9.2 Forward Problem and Model Construction
We let the object to be imaged occupy a three-dimensional bounded domain ![]() with a smooth boundary ∂Ω. We attach a pair of surface electrodes
with a smooth boundary ∂Ω. We attach a pair of surface electrodes ![]() and
and ![]() on the boundary ∂Ω through which we inject current I at a fixed low angular frequency ω ranging over 0 < ω/2π < 500 Hz, for example. Then, the time-harmonic current density J, electric field intensity E and magnetic flux density B due to the injection current approximately satisfy the following:
on the boundary ∂Ω through which we inject current I at a fixed low angular frequency ω ranging over 0 < ω/2π < 500 Hz, for example. Then, the time-harmonic current density J, electric field intensity E and magnetic flux density B due to the injection current approximately satisfy the following:
9.8 ![]()
9.9 ![]()
9.10 ![]()
where n is the outward unit normal vector on ∂Ω and ds is the surface area element. In order to simplify the MREIT problem, we will assume that the conductivity distribution σ in Ω is isotropic, ![]() and smooth.
and smooth.
9.2.1 Relation between J, Bz and σ
The induced voltage u in the Sobolev space ![]() satisfies the following boundary value problem:
satisfies the following boundary value problem:
where ∂u/∂n is the derivative of u normal to the boundary. Setting a reference voltage ![]() , we can obtain a unique solution u. Among u, J and E, we have the following relation:
, we can obtain a unique solution u. Among u, J and E, we have the following relation:
9.12 ![]()
The relation between the internal Bz data and the conductivity σ can be expressed implicitly by the z component of the Biot–Savart law:
where r = (x, y, z) is a position vector in ![]() , ez = (0, 0, 1),
, ez = (0, 0, 1), ![]() is a harmonic function in Ω representing a magnetic flux density generated by currents flowing through external lead wires and u is the induced voltage. In practice, the harmonic function
is a harmonic function in Ω representing a magnetic flux density generated by currents flowing through external lead wires and u is the induced voltage. In practice, the harmonic function ![]() is unknown, so we should eliminate its effects in any conductivity image reconstruction algorithm.
is unknown, so we should eliminate its effects in any conductivity image reconstruction algorithm.
Figure 9.6(a) is an MR magnitude image of a cylindrical phantom whose background was filled with an agar gel. It contained chunks of three different biological tissues. Its conductivity image is shown in Figure 9.6(b), where we used an MREIT image reconstruction algorithm described later. From multi-slice conductivity images of the three-dimensional phantom, we solved the equation (9.11) for u using the finite element method (FEM) and computed the internal current density J using J = σE = − σ∇u. Figure 9.6(c) is a plot of |J|; the thin lines are current streamlines subject to an injection current from the left to the right electrodes. The induced magnetic flux density Bz due to the current density in (c) is visualized in Figure 9.6(d).
Figure 9.6 (a) MR magnitude image M of a cylindrical phantom including chunks of three different biological tissues. Its background was filled with an agar gel. (b) Reconstructed conductivity image of the same slice using an MREIT conductivity image reconstruction algorithm. (c) Image of the magnitude of the current density |J|, where thin lines are current streamlines. Current was injected from the left to the right electrodes. (d) Induced magnetic flux density Bz image subject to the current density in (c)
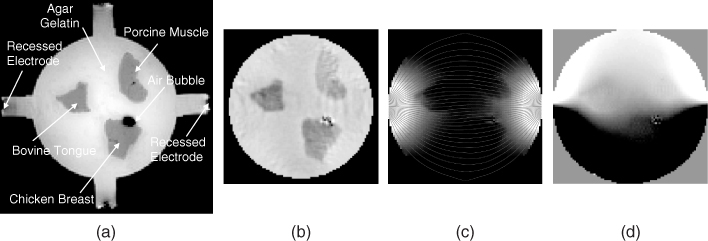
Now, we interpret Figure 9.6 in the opposite way. Let us assume that the imaging object shown in Figure 9.6(a) with its conductivity distribution in Figure 9.6(b) is given. We inject current into the object through a pair of surface electrodes. Then, it produces an internal distribution of J in Figure 9.6(c), which is not directly measurable. Following the relation in (9.13), the current density generates an internal distribution of the induced magnetic flux density Bz in Figure 9.6(d), which is measurable by using an MRI scanner. The goal in MREIT is to reconstruct an image of the internal conductivity distribution in Figure 9.6(b) by using the measured data of Bz in Figure 9.6(d) or B.
9.2.2 Three Key Observations
The right-hand side of (9.13) is a sum of a nonlinear function of σ and the harmonic function ![]() , which is independent of σ. We may consider an inverse problem of recovering the conductivity distribution σ entering the nonlinear problem (9.13) from knowledge of the measured data Bz, the geometry of ∂Ω, the positions of the electrodes
, which is independent of σ. We may consider an inverse problem of recovering the conductivity distribution σ entering the nonlinear problem (9.13) from knowledge of the measured data Bz, the geometry of ∂Ω, the positions of the electrodes ![]() and the size of the injection current.
and the size of the injection current.
First, there is a scaling uncertainty of σ in the nonlinear problem (9.13) owing to the fact that, if σ is a solution of (9.13), so is a scaled conductivity ασ for any scaling factor α > 0. Hence, we should resolve the scaling uncertainty of σ by measuring the voltage difference at any two fixed boundary points or by including a piece of electrically conducting material with a known conductivity value as part of the imaging object (Ider et al. 2003; Kwon et al. 2002a).
Second, any change of σ in the direction ∇u normal to the equipotential surface is invisible from Bz data. Assume that a function ![]() is strictly increasing and continuously differentiable. Then φ(u) is a solution of (9.11) with σ replaced by σ/φ′(u) because
is strictly increasing and continuously differentiable. Then φ(u) is a solution of (9.11) with σ replaced by σ/φ′(u) because
9.14 ![]()
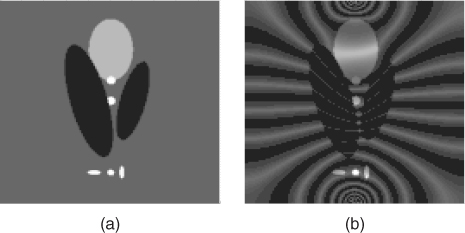
Noting that this is true for any strictly increasing ![]() , we can see that the data Bz cannot trace a change of σ in the direction ∇u. This means that there are infinitely many conductivity distributions that satisfy (9.11) and (9.13) for given Bz data. Figure 9.7 shows an example of two conductivity distributions producing the same Bz data.
, we can see that the data Bz cannot trace a change of σ in the direction ∇u. This means that there are infinitely many conductivity distributions that satisfy (9.11) and (9.13) for given Bz data. Figure 9.7 shows an example of two conductivity distributions producing the same Bz data.
Figure 9.7 Two different conductivity distributions (a) and (b) that produce the same Bz data subject to Neumann data ![]() ,
, ![]() , where
, where ![]()
Third, Bz data can trace a change of σ in the tangent direction ![]() to the equipotential surface where
to the equipotential surface where

To see this, we change (9.13) into the following variational form, where the unknown harmonic term ![]() is eliminated,
is eliminated,
or using the smoothness assumption of σ and the fact that ∇ · (∇u × ez) = 0,
The two expressions (9.15) and (9.16) clearly explain that Bz data probes a change of lnσ along the vector field σ∇u × ez.
9.2.3 Data Bz Traces σ∇u × ez Directional Change of σ
From the formula ![]() in (9.16), the distribution of Bz traces a change of σ to the direction
in (9.16), the distribution of Bz traces a change of σ to the direction ![]() in the following ways:
in the following ways:
According to the above observations, if we could predict the direction of σ∇u × ez, we may estimate a spatial change of σ in that direction from measured Bz data. However, the vector field σ∇u × ez is a nonlinear function of the unknown conductivity σ, and hence estimation of the direction of σ∇u × ez without explicit knowledge of σ appears to be paradoxical.
Assume that the conductivity contrast is reasonably small as ![]() . The distribution of the current density J = − σ∇u is mostly dictated by the given positions of the electrodes
. The distribution of the current density J = − σ∇u is mostly dictated by the given positions of the electrodes ![]() , the size of the injection current I, and the geometry of the boundary ∂Ω, while the influence of changes in σ on J is relatively small. This means that σ∇u ≈ ∇v, where v is a solution of the Laplace equation Δv = 0 with the same boundary data as in (9.11). Hence, under the assumption of low conductivity contrast, the change in lnσ along any characteristic curve having its tangent direction J × ez can be evaluated by using the following approximation:
, the size of the injection current I, and the geometry of the boundary ∂Ω, while the influence of changes in σ on J is relatively small. This means that σ∇u ≈ ∇v, where v is a solution of the Laplace equation Δv = 0 with the same boundary data as in (9.11). Hence, under the assumption of low conductivity contrast, the change in lnσ along any characteristic curve having its tangent direction J × ez can be evaluated by using the following approximation:
9.2.4 Mathematical Analysis toward MREIT Model
Since our goal is to use MREIT techniques in practical clinical applications, we must set up a mathematical model of MREIT that agrees with a planned medical imaging system. To simplify our study, let us make several assumptions, which should not go astray from the practical model. Let the object to be imaged occupy a three-dimensional bounded domain ![]() with a smooth connected boundary ∂Ω, and each
with a smooth connected boundary ∂Ω, and each ![]() , the slice of Ω cut by the plane {z = z0}, has a smooth connected boundary. We assume that the conductivity distribution σ of the subject Ω is isotropic,
, the slice of Ω cut by the plane {z = z0}, has a smooth connected boundary. We assume that the conductivity distribution σ of the subject Ω is isotropic, ![]() and 0 < σ− < σ < σ+ with two known constants σ±. Though σ is usually piecewise-smooth in practice, this can be approximated by a
and 0 < σ− < σ < σ+ with two known constants σ±. Though σ is usually piecewise-smooth in practice, this can be approximated by a ![]() -function and so it is a matter of how big
-function and so it is a matter of how big ![]() is. We attach a pair of copper electrodes
is. We attach a pair of copper electrodes ![]() and
and ![]() on ∂Ω in order to inject current, and let
on ∂Ω in order to inject current, and let ![]() be the portion of the surface ∂Ω where the electrodes are attached.
be the portion of the surface ∂Ω where the electrodes are attached.
The injection current I produces an internal current density J = (Jx, Jy, Jz) inside the subject Ω satisfying the following problem:
where n is the outward unit normal vector on ∂Ω and ds is the surface area element. The condition J × n = 0 on ![]() comes from the fact that copper electrodes are highly conductive. Since J is expressed as J = − σ∇u, where u is the corresponding electrical potential, (9.18) can be converted to
comes from the fact that copper electrodes are highly conductive. Since J is expressed as J = − σ∇u, where u is the corresponding electrical potential, (9.18) can be converted to
where ∂u/∂n = ∇u · n. The above non-standard boundary value problem (9.19) is well-posed and has a unique solution up to a constant. We omit the proof of the uniqueness (up to a constant) within the class ![]() since it follows from standard arguments in PDEs.
since it follows from standard arguments in PDEs.
Let us briefly discuss the boundary conditions, which are essentially related to the size of the electrodes. The condition ![]() ensures that each of
ensures that each of ![]() and
and ![]() is a constant, since ∇u is normal to its level surface. The term
is a constant, since ∇u is normal to its level surface. The term
![]()
means that the total amount of injection current through the electrodes is I milliamps. Let us denote
![]()
In practice, it is difficult to specify the Neumann data g in a pointwise sense because only the total amount of injection current I is known. It should be noted that the boundary condition in (9.19) leads to ![]() on
on ![]() , singularity along the boundary of the electrodes, and
, singularity along the boundary of the electrodes, and ![]() . But, fortunately,
. But, fortunately, ![]() which also can be proven by the standard regularity theory in PDEs.
which also can be proven by the standard regularity theory in PDEs.
The exact model (9.19) can be converted into the following standard problem of an elliptic equation with mixed boundary conditions.
9.20 
9.21 ![]()

![]()
Now, we explain the inverse problem for the MREIT model, in which we try to reconstruct σ. The presence of the internal current density J = − σ∇u generates a magnetic flux density B = (Bx, By, Bz) such that Ampère's law J = ∇ × B/μ0 holds in Ω. With the z axis pointing in the direction of the main magnetic field of the MRI scanner, the relation between the measurable quantity Bz and the unknown σ is governed by the Biot–Savart law:
where

Here, we must read u as a nonlinear function of σ. The following lemma is crucial to understand why we need at least two injection currents with the requirement (9.26) in the sequel.
![]()

![]()
![]()
![]()
![]()
9.3 Inverse Problem Formulation using B or J
When we measure B, including all its three components, we can compute J using (9.7). For the case of σ = σ*, which is the true conductivity, our problem is reduced to the following nonlinear boundary value problem:
where ![]() . Imaging the conductivity σ* means finding a constructive map {I, J*} → σ* from the above highly nonlinear equation. Owing to this intricate relation, it is almost impossible to find an explicit expression for σ* in terms of J* and I. So, we may adopt an iterative scheme to search for the true solution σ*.
. Imaging the conductivity σ* means finding a constructive map {I, J*} → σ* from the above highly nonlinear equation. Owing to this intricate relation, it is almost impossible to find an explicit expression for σ* in terms of J* and I. So, we may adopt an iterative scheme to search for the true solution σ*.
Before developing an algorithm, it is necessary to check if the data pair {I, J*} has sufficient information to determine ![]() . Unfortunately, as shown in Figure 9.7, it is possible that two different conductivity distributions may correspond to the same pair of {I, Bz} or {I, J*}.
. Unfortunately, as shown in Figure 9.7, it is possible that two different conductivity distributions may correspond to the same pair of {I, Bz} or {I, J*}.
Let us consider a conducting material consisting of two regions with different conductivity values. It is well known that the normal component of J is continuous across the interface while its tangential component changes. Thus the magnitude of the current density will change if the tangential components of J at the interface is non-zero. Hence, J plays an important role in reconstructing a conductivity image due to its change when current crosses the interface non-orthogonally between two regions. However, J may not provide any information for imaging a portion of the interface where current flows orthogonally.
To deal with this uniqueness issue, we may use four electrodes at four sides (east, south, west, north) on the boundary so that we can apply two different current flows using two pairs of electrodes. Let I1 and I2 be the two currents from the two pairs of electrodes. Two sets of current density data, J1 = |J1| and J2 = |J2|, induced by I1 and I2, respectively, can now be used to image the conductivity distribution. Owing to the positions of the electrodes, the two vectors J1 and J2 are not in the same (or opposite) direction(s) and thus satisfy
Therefore, at least one of J1 and J2 changes abruptly at the interface of two regions where any change of conductivity occurs.
9.4 Inverse Problem Formulation using Bz
Based on the observations in previous sections, the harmonic Bz algorithm was developed, which will be explained later. It provides a scaled conductivity image of each transverse slice ![]() . According to the identity (9.16) and the non-uniqueness result, we should produce at least two linearly independent currents. With two data Bz, 1 and Bz, 2 corresponding to two current densities J1 and J2, respectively, satisfying (J1 × J2) · ez ≠ 0 in
. According to the identity (9.16) and the non-uniqueness result, we should produce at least two linearly independent currents. With two data Bz, 1 and Bz, 2 corresponding to two current densities J1 and J2, respectively, satisfying (J1 × J2) · ez ≠ 0 in ![]() , we can perceive a transverse change of σ on the slice
, we can perceive a transverse change of σ on the slice ![]() using the approximation (9.17). This is the main reason why we usually use two pairs of surface electrodes
using the approximation (9.17). This is the main reason why we usually use two pairs of surface electrodes ![]() and
and ![]() as shown in Figures 9.4 and 9.6.
as shown in Figures 9.4 and 9.6.
We inject two linearly independent currents I1 and I2 into an imaging object using two pairs of electrodes. In general, one may inject N different currents using N pairs of electrodes with N ≥ 2 at the expense of an increased data acquisition time. In order to simplify the electrode attachment procedure, it is desirable to attach four surface electrodes so that, in the imaging region, the area of the parallelogram made by the two vectors J1 × ez and J2 × ez is as large as possible. We may then spend a given fixed data acquisition time to collect Bz, 1 and Bz, 2 data with a sufficient number of data averaging for a better signal-to-noise ratio (SNR).
9.4.1 Model with Two Linearly Independent Currents
Throughout this section, we assume that we inject two linearly independent currents through two pairs of surface electrodes ![]() and
and ![]() . For a given
. For a given ![]() , we denote by uj[σ] the induced voltage corresponding to the injection current Ij with j = 1, 2, that is, uj[σ] is a solution of the following boundary value problem:
, we denote by uj[σ] the induced voltage corresponding to the injection current Ij with j = 1, 2, that is, uj[σ] is a solution of the following boundary value problem:
9.27 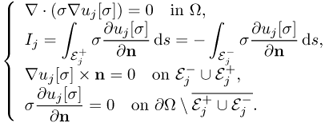
We define a map ![]() by
by
We should note that, according to (9.13), we have
9.29 ![]()
where Bz, j is the z component of the magnetic flux density corresponding to the current density Jj = − σ∇uj[σ] and ![]() is the voltage difference u1[σ] between the electrodes
is the voltage difference u1[σ] between the electrodes ![]() and
and ![]() , that is,
, that is, ![]() . Here,
. Here, ![]() and
and ![]() are the lead wire effects from the pairs
are the lead wire effects from the pairs ![]() and
and ![]() , respectively. Since we know
, respectively. Since we know ![]() in Ω, the first two components of Λ[σ] are available up to harmonic factors.
in Ω, the first two components of Λ[σ] are available up to harmonic factors.
The inverse problem of MREIT is to identify σ from knowledge of Λ[σ] up to harmonic factors. In practice, for given data Bz, 1, Bz, 2 and ![]() , we should develop a robust image reconstruction algorithm to find σ within the admissible class
, we should develop a robust image reconstruction algorithm to find σ within the admissible class ![]() so that such σ minimizes
so that such σ minimizes
9.30 
where Λ[σ] = (Λ1[σ], Λ2[σ], Λ3[σ]) and α is a positive constant.
Regarding the smoothness constraint of ![]() , we would like to emphasize again that it is not an important issue in practice since practically available Bz data are always a blurred version of the true Bz (see Remark 9.2.1).
, we would like to emphasize again that it is not an important issue in practice since practically available Bz data are always a blurred version of the true Bz (see Remark 9.2.1).
9.4.2 Uniqueness
For uniqueness, we need to prove that ![]() implies that
implies that ![]() . The following condition is essential for uniqueness:
. The following condition is essential for uniqueness:
However, we still do not have a rigorous theory for the issue related to (9.31) in a three-dimensional domain though there are some two-dimensional results based on the geometric index theory (Alessandrini and Magnanini 1992; Bauman et al. 2000; Seo 1996).
We explain the two-dimensional uniqueness. Assume that ![]() in a cylindrical domain Ω do not change along the z direction and
in a cylindrical domain Ω do not change along the z direction and ![]() . This two-dimensional problem has some practical meaning because many parts of the human body are locally cylindrical in their shape.
. This two-dimensional problem has some practical meaning because many parts of the human body are locally cylindrical in their shape.
![]()
![]()
![]()
9.32 ![]()


![]()
![]()
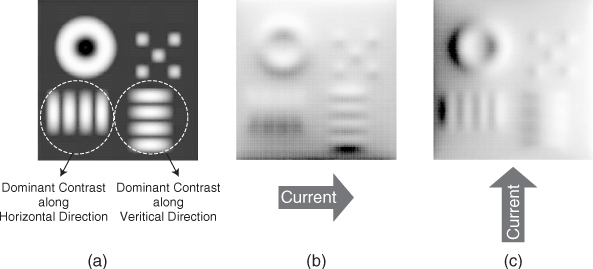
Although uniqueness in three dimensions is still an open problem, we can expect three-dimensional uniqueness by looking at the roles of the three components Λ1[σ], Λ2[σ] and Λ3[σ] with appropriate attachments of electrodes. Typical experimental and simulated Bz data sets are shown in Figure 9.8 and 9.9, respectively.
- Comparing Figure 9.8(a) and 9.8(c), we can see that the first component Λ1[σ] probes the vertical change of lnσ where the current density vector field J1 flows mostly in the horizontal direction. Figure 9.9(b) shows the simulated Λ1[σ] data with a horizontally oriented current. It is more clear that the Bz data subject to the horizontal current flow distinguishes the conductivity contrast along the vertical direction.
- Comparing Figure 9.8(b) and 9.8(d), the second component Λ2[σ] probes the horizontal change of lnσ where J2 flows mostly in the vertical direction. Figure 9.9(c) shows the simulated Λ2[σ] data with a vertically oriented current. It is clear that the Bz data subject to the vertical current flow distinguishes the conductivity contrast along the horizontal direction.
- The third component Λ3[σ] is used to fix the scaling uncertainty mentioned earlier in section 2.2.
Figure 9.8 (a) and (b) Measured Bz data from a cylindrical homogeneous saline phantom subject to current injections along the horizontal and vertical directions, respectively. (c) and (d) Measured Bz data from the same phantom containing an agar anomaly with a different conductivity value from the background saline
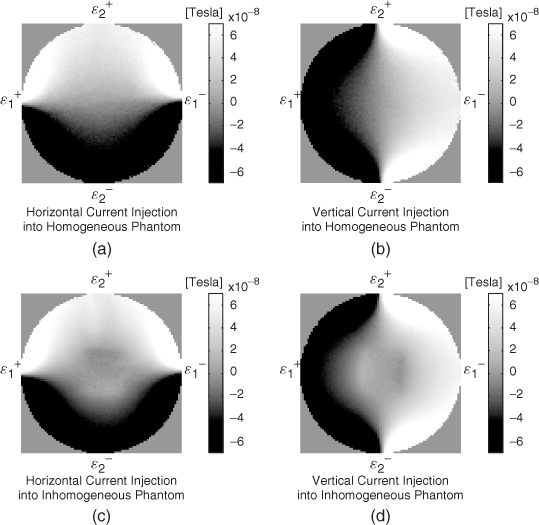
Figure 9.9 (a) Conductivity distribution of a model. Electrodes are attached along four sides of the model. (b) and (c) Simulated Bz data subject to current injections along the horizontal and vertical directions, respectively
In general, if we could produce two currents such that ![]() and
and ![]() are linearly independent for all
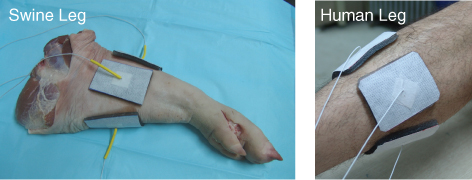
are linearly independent for all ![]() , we can expect uniqueness roughly by observing the roles of Λ[σ]. Taking account of the uniqueness and stability, we carefully attach two pairs of surface electrodes (which determine the two different Neumann data) as shown in Figure 9.10 so that the area of the parallelogram
, we can expect uniqueness roughly by observing the roles of Λ[σ]. Taking account of the uniqueness and stability, we carefully attach two pairs of surface electrodes (which determine the two different Neumann data) as shown in Figure 9.10 so that the area of the parallelogram ![]() is as large as possible in the truncated cylindrical region. However, the proof of
is as large as possible in the truncated cylindrical region. However, the proof of ![]() for
for ![]() would be difficult.
would be difficult.
Figure 9.10 Typical examples of electrode attachment to maximize the area of the parallelogram ![]()
9.4.3 Defected Bz Data in a Local Region
In MREIT, it is important to develop a robust image reconstruction algorithm that is applicable to in vivo animal and human experiments. Before developing an image reconstruction algorithm, we must take account of possible fundamental defects of measured Bz data. Inside the human body, there may exist a region where MR magnitude image values are small. Examples may include the outer layer of the bone, lungs and gas-filled internal organs. In such a region, M ≈ 0 in (9.1) and this results in noise amplification. If the MR magnitude image M contains Gaussian random noise ![]() , then the noise standard deviation in measured Bz data, denoted by sd(Bz), can be expressed in the following way (Sadleir 2005; Scott et al. 1992):
, then the noise standard deviation in measured Bz data, denoted by sd(Bz), can be expressed in the following way (Sadleir 2005; Scott et al. 1992):
9.33 ![]()
From the above formula, the data Bz are not reliable inside an internal region where the MR magnitude image value M is small. It would be desirable to provide a high-resolution conductivity image in a region having high-quality Bz data regardless of the presence of such problematic regions. Fortunately, (9.16) and (9.17) would provide a local change of lnσ regardless of the global distribution of σ if we could predict J1 and J2 in that local region. This is why an MREIT algorithm using (9.16) and (9.17) can provide a robust conductivity contrast reconstruction in any region having Bz data with enough SNR.
For those problematic regions, we may use the harmonic inpainting method (Lee et al. 2006) as a process of data restoration. The method is based on the fact that ΔBz = 0 inside any local region having a homogeneous conductivity. We first segment each problematic region where the MR magnitude image value M is near zero. Defining a boundary of the region, we solve ΔBz = 0 using the measured Bz data along the boundary where noise is small. Then, we replace the original noisy Bz data inside the problematic region by the computed synthetic data. We must be careful in using this harmonic inpainting method since the problematic region will appear as a local homogeneous region in a reconstructed conductivity image. When there are multiple small local regions with large amounts of noise, we may consider using a harmonic decomposition denoising method (Lee et al. 2005) or other proper denoising techniques instead of the harmonic inpainting.
9.5 Image Reconstruction Algorithm
9.5.1 J-substitution Algorithm
Kwon et al. (2002b) solved the inverse problem of finding σ in (9.25) by developing a novel conductivity image reconstruction method called the J-substitution algorithm. Related to the boundary value problem in (9.25), we can introduce the cost functional
9.34 ![]()
where J*(r) is the magnitude of the observed interior current density and Eσ(r): = |∇uσ(r)| is the magnitude of the calculated electric field intensity obtained by solving (9.25) for a given σ. After discretization of the model ![]() with the same area for all
with the same area for all ![]() , we get the squared residual sum
, we get the squared residual sum
where ![]() is the kth element of the model and σk is the conductivity in
is the kth element of the model and σk is the conductivity in ![]() , which is assumed to be a constant on each element. Note that, in this case, the conductivity distribution is expressed by
, which is assumed to be a constant on each element. Note that, in this case, the conductivity distribution is expressed by ![]() , where
, where ![]() denotes the indicator function of
denotes the indicator function of ![]() , hence the electric field intensity Eσ(r) in (9.35) is also a function of (σ0, …, σN−1). To update the conductivity from the zero gradient argument for the minimization of the squared residual sum, we differentiate (9.35) with respect to σm for m = 0, …, N − 1 to get
, hence the electric field intensity Eσ(r) in (9.35) is also a function of (σ0, …, σN−1). To update the conductivity from the zero gradient argument for the minimization of the squared residual sum, we differentiate (9.35) with respect to σm for m = 0, …, N − 1 to get
9.36 
This leads to the following approximate identity:
9.37 
for m = 0, …, N − 1, where rk is the center point of the element ![]() and we have used the simplest quadrature rule. Hence we obtain the following updating strategy to minimize the residual sum in (9.35):
and we have used the simplest quadrature rule. Hence we obtain the following updating strategy to minimize the residual sum in (9.35):
9.38 ![]()
where ![]() is a new conductivity value on
is a new conductivity value on ![]() and Eσ(rm) is the calculated electric field intensity at the center point of
and Eσ(rm) is the calculated electric field intensity at the center point of ![]() from an old conductivity distribution
from an old conductivity distribution ![]() .
.
Our inverse problem is to determine σ* from two pairs of data (Iq, Jq), q = 1, 2 and the goal is to develop a reconstruction algorithm for σ*. The reconstruction algorithm called the J-substitution algorithm for this nonlinear problem in (9.25) is as follows:
9.41 ![]()
The J-substitution algorithm can effectively and stably recover the conductivity distribution as long as the measured data sets of ![]() and
and ![]() are available. For cases where Jz is negligible, one may estimate
are available. For cases where Jz is negligible, one may estimate ![]() and
and ![]() from measured
from measured ![]() and
and ![]() , respectively, without rotating the imaging object. Carefully designing an experimental protocol including electrode size and configuration, the J-substitution method could be a suitable practical method to solve the inverse problem in MREIT. For other nonlinear inverse problems where internal data are available, one may also consider applying the J-substitution algorithm or its variations.
, respectively, without rotating the imaging object. Carefully designing an experimental protocol including electrode size and configuration, the J-substitution method could be a suitable practical method to solve the inverse problem in MREIT. For other nonlinear inverse problems where internal data are available, one may also consider applying the J-substitution algorithm or its variations.
9.5.2 Harmonic Bz Algorithm
We consider the case where only Bz data are available for conductivity image reconstructions. The harmonic Bz algorithm is based on the following identity:
9.42 
where

Noting that ΔΛj[σ] = ΔBz, j for j = 1, 2 from (9.13), we have
provided that ![]() is invertible. The above identity (9.43) leads to an implicit representation formula for σ on each slice
is invertible. The above identity (9.43) leads to an implicit representation formula for σ on each slice ![]() in terms of the measured data set
in terms of the measured data set ![]() . Denoting x = (x, y) and x′ = (x′, y′), we have
. Denoting x = (x, y) and x′ = (x′, y′), we have
where
9.45 ![]()
and
Here, ν is the unit outward normal vector to the curve ![]() and d
and d![]() is the line element. From the trace formula for the double-layer potential in (9.46), the identity (9.44) on the boundary
is the line element. From the trace formula for the double-layer potential in (9.46), the identity (9.44) on the boundary ![]() can be expressed as
can be expressed as
where
![]()
Note that the operator ![]() is invertible on
is invertible on ![]() from the well-known potential theory (Folland 1976).
from the well-known potential theory (Folland 1976).
![]()
Because of the invertibility of the operators ![]() and
and ![]() , we can expect that the following iterative algorithm based on the identities (9.44) and (9.47) can determine σ up to a scaling factor:
, we can expect that the following iterative algorithm based on the identities (9.44) and (9.47) can determine σ up to a scaling factor:
From the first step in (9.49), we can update ∇xyσn+1 for all imaging slices of interest within the object as long as the measured data Bz are available for the slices. Next, we obtain ![]() by solving the integral equation (9.47) for the given right-hand side of the second step in (9.49). Since
by solving the integral equation (9.47) for the given right-hand side of the second step in (9.49). Since ![]() is known, so is the value σn+1 inside
is known, so is the value σn+1 inside ![]() by simple substitution of
by simple substitution of ![]() and ∇xyσn+1 into the corresponding integrals. This harmonic Bz algorithm has shown a remarkable performance in various numerical simulations (Oh et al. 2003; Seo et al. 2003b) and imaging experiments.
and ∇xyσn+1 into the corresponding integrals. This harmonic Bz algorithm has shown a remarkable performance in various numerical simulations (Oh et al. 2003; Seo et al. 2003b) and imaging experiments.
Early MREIT methods have used all three components of the magnetic flux density B = (Bx, By, Bz), and they require impracticable rotations of the imaging object inside the MRI scanner. The invention of the harmonic Bz algorithm using only Bz instead of B (Seo et al. 2003b) changed the problem of impracticable rotations into a mathematical problem (9.28) with achievable data through applications of two linearly independent Neumann data. This harmonic Bz algorithm has been widely used in experimental studies, including in vivo animal and human imaging experiments (Kim et al. 2007, 2008a,b, 2009, 2011).
We now briefly mention the convergence behavior of (9.49). When σ has a low contrast in Ω, the direction of the vector field σ∇uj[σ] is mostly dictated by the geometry of the boundary ∂Ω and the electrode positions ![]() (or Neumann boundary data) instead of the distribution of σ. This ill-posedness was the fundamental drawback of the corresponding inverse problem of EIT. But, in MREIT, we take advantage of this insensitivity of EIT. This means that the direction of the vector field σ∇uj[σ] is similar to that of σ0∇uj[σ0] with σ0 = 1, and therefore the data Bz, 1 and Bz, 2 hold the major information of the conductivity contrast. Various numerical simulations show that only one iteration of (9.49) may provide a conductivity image σ1 that is quite similar to the true conductivity σ. Rigorous mathematical theories regarding its convergence behavior have not been proven yet. There are some convergence results on (9.49) under a priori assumptions on the target conductivity (Liu et al. 2007).
(or Neumann boundary data) instead of the distribution of σ. This ill-posedness was the fundamental drawback of the corresponding inverse problem of EIT. But, in MREIT, we take advantage of this insensitivity of EIT. This means that the direction of the vector field σ∇uj[σ] is similar to that of σ0∇uj[σ0] with σ0 = 1, and therefore the data Bz, 1 and Bz, 2 hold the major information of the conductivity contrast. Various numerical simulations show that only one iteration of (9.49) may provide a conductivity image σ1 that is quite similar to the true conductivity σ. Rigorous mathematical theories regarding its convergence behavior have not been proven yet. There are some convergence results on (9.49) under a priori assumptions on the target conductivity (Liu et al. 2007).
9.5.3 Gradient Bz Decomposition and Variational Bz Algorithm
It would be better to minimize the amplitude of the injection current. However, the amplitude of the signal Bz is proportional to the amplitude of the injection current. For a given noise level of an MREIT system, this means that we have to deal with Bz data sets with a low SNR. Numerical implementation methods of an image reconstruction algorithm affect the quality of a reconstructed conductivity image since noise in Bz data is transformed into noise in the conductivity image. Depending on the chosen method, noise could be amplified or weakened.
Since double differentiation of Bz data tends to amplify its noise, the performance of the harmonic Bz algorithm could deteriorate when the SNR in the measured Bz data is low. To deal with this noise amplification problem, algorithms to reduce the number of differentiations have been developed. They include the gradient Bz decomposition algorithm (Park et al. 2004a) and the variational gradient Bz algorithm (Park et al. 2004b), which need to differentiate Bz only once. They show a better performance in some numerical simulations and we discuss only one of them for pedagogical purposes.
We briefly explain the gradient Bz decomposition algorithm in a special cylindrical domain ![]() , where D is a two-dimensional, smooth and simply connected domain. Suppose that u is a solution of ∇ · (σ∇u) = 0 in Ω with Neumann data g. We parameterize ∂D as ∂D: = {(x(t), y(t)):0 ≤ t ≤ 1} and define
, where D is a two-dimensional, smooth and simply connected domain. Suppose that u is a solution of ∇ · (σ∇u) = 0 in Ω with Neumann data g. We parameterize ∂D as ∂D: = {(x(t), y(t)):0 ≤ t ≤ 1} and define
![]()
for ![]() The gradient Bz decomposition algorithm is based on the following implicit reconstruction formula:
The gradient Bz decomposition algorithm is based on the following implicit reconstruction formula:
9.50 ![]()
where
![]()
and
![]()
Here, ϕ is a solution of
9.51 
and ψ is a solution of
9.52 
where τ: = ( − νy, νx, 0) is the tangent vector on the lateral boundary ![]() .
.
We may use an iterative reconstruction scheme with multiple Neumann data gj, j = 1, …, N, to find σ. Denoting by ![]() a solution of ∇ · (σm∇u) = 0 in Ω with Neumann data gj, the reconstructed σ is the limit of a sequence σm that is obtained by the following formula:
a solution of ∇ · (σm∇u) = 0 in Ω with Neumann data gj, the reconstructed σ is the limit of a sequence σm that is obtained by the following formula:
This method needs to differentiate Bz only once, in contrast to the harmonic Bz algorithm, where the numerical computation of ∇2Bz is required. It has an advantage of much improved noise tolerance, and numerical simulations with added random noise of a realistic amount showed its feasibility and robustness against measurement noise. However, in practical environments, it shows poor performance compared with the harmonic Bz algorithm and may produce some artifacts.
The major reason is that the updated conductivity σm+1 by the iteration process (9.53) is influenced by the global distribution of σm. We should note that there always exist some local regions having defective Bz data in human or animal experiments, and we always deal with a truncated region of the imaging object, which causes geometric errors. Hence, it would be very difficult to reconstruct the conductivity distribution in the entire region of the human or animal subject with reasonable accuracy, and it would be best to achieve robust reconstruction of σ in local regions where measured Bz data are reliable. In order to achieve a stable local reconstruction of conductivity contrast with moderate accuracy, poor conductivity reconstruction at one local region should not adversely influence conductivity reconstructions in other regions. This means that a conductivity image reconstruction algorithm should not depend too much on the global distribution of Bz, the global structure of σ and the geometry ∂Ω.
9.5.4 Local Harmonic Bz Algorithm
Noting that there inevitably exist defective regions inside the human body where measured Bz data are not reliable, Seo et al. (2008) and Jeon (2010) proposed a modified version of the harmonic Bz algorithm called the local harmonic Bz algorithm to improve its practical applicability. Assume that we sequentially inject two currents I1 and I2 through two pairs of surface electrodes ![]() and
and ![]() , respectively. For j = 1, 2, we let uj[σ] be a solution of the following boundary value problem:
, respectively. For j = 1, 2, we let uj[σ] be a solution of the following boundary value problem:
9.54 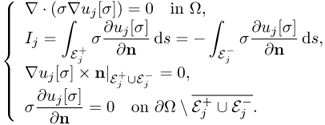
The z component of the curl of Ampère's law ∇ × J = (1/μ0)∇ × ∇ × B is
and Bz, j is the z component of the induced magnetic flux density subject to the injected current Ij. This identity indicates that (1/μ0)∇2Bz, j conveys information on any local change of σ along the direction ![]() , which is a nonlinear function of σ.
, which is a nonlinear function of σ.
We rewrite (9.55) as
Combining (9.56) for j = 1, 2, we get
where

We should choose an electrode configuration including their size and positions in such a way that the condition number of ![]() is presumably minimized. Two equally spaced pairs of large and flexible electrodes are advantageous in reducing the condition number.
is presumably minimized. Two equally spaced pairs of large and flexible electrodes are advantageous in reducing the condition number.
We convert (9.57) into the following second-order differential equation by taking the transverse divergence:
where
![]()
One may apply (9.58) to the harmonic Bz algorithm as well to reconstruct conductivity images of an entire imaging domain. In this case, we may need to adopt an iteration scheme to reconstruct σ in each slice ![]() since (9.58) is a nonlinear equation of σ.
since (9.58) is a nonlinear equation of σ.
We now assume that the imaging object Ω contains a local region R with small conductivity values, that is, σ ≈ 0 in R. Examples may include the outer layers of bones, lungs and gas-filled tubular organs. Note that they usually coincide with the defective regions of MR signal void discussed early. We let D be a two-dimensional smooth subdomain in ![]() excluding all problematic regions. Let σ0 be an initial guess of σ. We change the nonlinear equation (9.58) into the following Poisson equation with a Neumann boundary condition in D:
excluding all problematic regions. Let σ0 be an initial guess of σ. We change the nonlinear equation (9.58) into the following Poisson equation with a Neumann boundary condition in D:
where ∇x, y = (∂/∂x, ∂/∂y) and ν is the outward unit normal vector to the two-dimensional boundary ∂D. Note that (9.59) has a unique solution up to a constant and does not require any information other than measured data Bz, j in D. In this local harmonic Bz algorithm, the conductivity image quality is determined by the quality of the measured Bz, j data only, without requiring any assumption on the conductivity or voltage values on the boundary ∂Ω.
Provided that |∇σ| is small, the vector field σ∇uj[σ] is dictated mainly by the injected current Ij and the global geometry of the boundary ∂Ω instead of the local distribution of σ. In such a case, we may approximate σ∇uj[σ] ≈ σ0∇uj[σ0] with σ0 = 1. This means that we can perceive a local change of lnσ in the direction ![]() , which is approximately estimated by
, which is approximately estimated by ![]() . In the single-step local harmonic Bz algorithm, we can perform a conductivity image reconstruction using σ0 = 1 without iteration and produce a scaled conductivity image in D or any chosen region of interest.
. In the single-step local harmonic Bz algorithm, we can perform a conductivity image reconstruction using σ0 = 1 without iteration and produce a scaled conductivity image in D or any chosen region of interest.
9.5.5 Sensitivity Matrix-Based Algorithm
Using a sensitivity matrix S derived from (9.13) with the assumption of ![]() , we may linearize the relationship between Bz and σ as follows (Birgul and Ider 1995; Birgul and Ider 1996):
, we may linearize the relationship between Bz and σ as follows (Birgul and Ider 1995; Birgul and Ider 1996):
9.60 ![]()
where ΔBz is the difference in Bz from the imaging object with homogeneous and perturbed conductivity distributions, ![]() and
and ![]() , respectively. Inverting the sensitivity matrix, one can reconstruct a conductivity image from measured Bz data. This approach is similar to those used in time-difference EIT imaging.
, respectively. Inverting the sensitivity matrix, one can reconstruct a conductivity image from measured Bz data. This approach is similar to those used in time-difference EIT imaging.
Birgul et al. (2003) elaborated this method and presented experimental results using a two-dimensional saline phantom with 20 electrodes. Muftuler et al. (2004) and Birgul et al. (2006) studied the sensitivity-based method in terms of image resolution and contrast. Hamamura et al. (2006) demonstrated that this sensitivity-based method can image time changes of ion diffusion in agar phantoms. Muftuler et al. (2006) performed animal experiments on rats and imaged tumors using an iterative version of the sensitivity-based method. They showed that the conductivity values of tumor areas are increased in reconstructed conductivity images. This method cannot deal with the unknown term ![]() , which is not zero unless lead wires are perfectly parallel to the z axis.
, which is not zero unless lead wires are perfectly parallel to the z axis.
9.5.6 Anisotropic Conductivity Reconstruction Algorithm
Some biological tissues are known to have anisotropic conductivity values, and the anisotropy ratio depends on the type of tissue. For example, human skeletal muscle shows an anisotropy of up to 1–10 between the longitudinal and transverse directions.
Seo et al. (2004) applied the MREIT technique to anisotropic conductivity image reconstructions. Investigating how an anisotropic conductivity

affects the internal current density and thereby the magnetic flux density, they understood that at least seven different injection currents are necessary for the anisotropic conductivity image reconstruction algorithm. The algorithm is based on the following two identities:
where
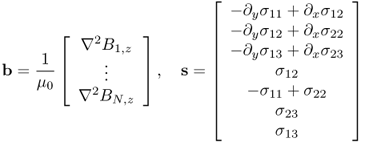
and

Here, uj is the voltage corresponding to the jth injection current, ![]() and
and ![]() is assumed to be a symmetric positive definite matrix. As in the harmonic Bz algorithm, we may use an iterative procedure to compute s in (9.61). Assuming that we have computed all seven terms of s, we can immediately determine
is assumed to be a symmetric positive definite matrix. As in the harmonic Bz algorithm, we may use an iterative procedure to compute s in (9.61). Assuming that we have computed all seven terms of s, we can immediately determine ![]() and
and ![]() . To determine σ11 and σ22 from s, we use the relation between s and
. To determine σ11 and σ22 from s, we use the relation between s and ![]() :
:
9.62 ![]()
The last component σ33 can be obtained by using the physical law ∇ · J = 0.
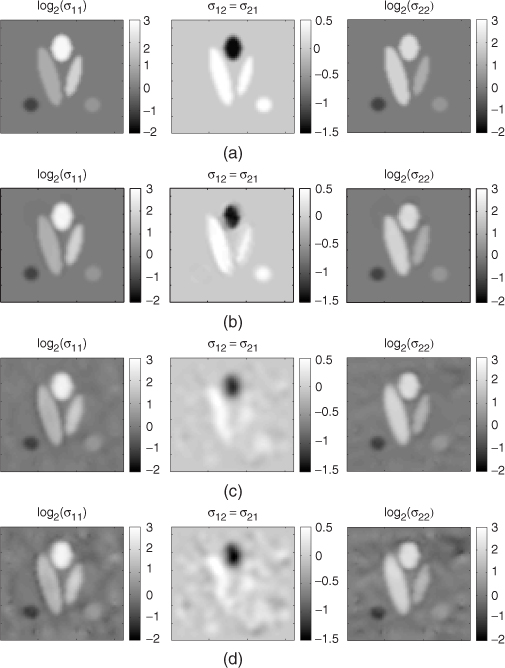
Numerical simulation results using a relatively simple two-dimensional model shown in Figure 9.11 demonstrated that the algorithm can successfully reconstruct images of an anisotropic conductivity tensor distribution provided that the Bz data have a high SNR. Unfortunately, this algorithm is not successful in practical environments since it is very sensitive to the noise and the matrix U is ill-conditioned in the interior region.
Figure 9.11 Numerical simulation of the anisotropic conductivity image reconstruction. (a) The target conductivity tensor image. (b)–(d) Reconstructed images when SNR is ![]() , 300 and 150, respectively. Here, SNR means the SNR of the corresponding MR magnitude image. From Seo et al. (2004)
, 300 and 150, respectively. Here, SNR means the SNR of the corresponding MR magnitude image. From Seo et al. (2004)
9.5.7 Other Algorithms
The algebraic reconstruction method (Ider and Onart 2004) may be considered as a variation of the harmonic Bz algorithm. They discussed numerous issues, including uniqueness, region-of-interest reconstruction and noise effects. Assuming that Bz data subject to an injection current into the head are available, Gao et al. (2005) developed a method to determine the conductivity values of the brain, skull and scalp layers using the radial basis function and simplex method. This kind of parametric approach may find useful applications in EEG/MEG source imaging problems. Gao et al. (2006) also suggested the so-called RSM-MREIT algorithm, where the total error between measured and calculated magnetic flux densities is minimized as a function of a model conductivity distribution by using the response surface methodology algorithm.
9.6 Validation and Interpretation
9.6.1 Image Reconstruction Procedure using Harmonic Bz Algorithm
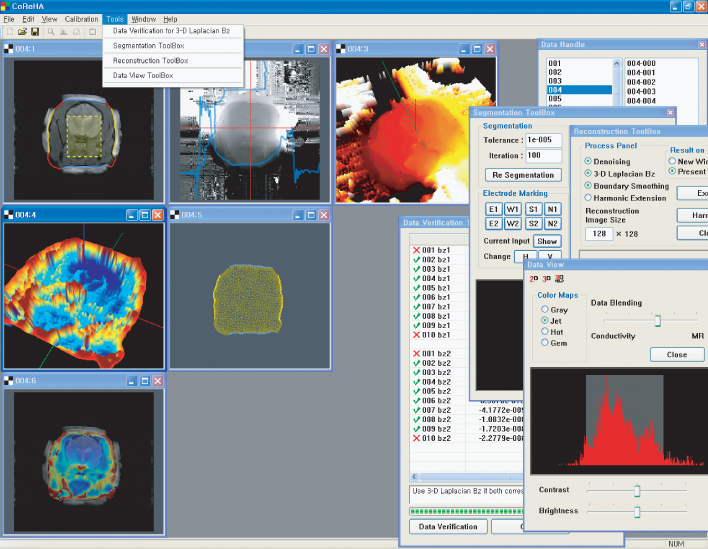
Based on the harmonic Bz algorithm, the Impedance Imaging Research Center (IIRC) in Korea developed MREIT software to offer various computational tools, from preprocessing to reconstruction of conductivity and current density images. Figure 9.12 shows a screen capture of the MREIT software, CoReHA (conductivity reconstructor using harmonic algorithms) (Jeon et al. 2009a,b). It includes three major tasks of preprocessing, model construction and data recovery, and conductivity image reconstruction.
- Preprocessing. We obtain magnetic flux density images Bz, 1 and Bz, 2 corresponding to two injection currents I1 and I2, respectively, from the k-space data after applying proper phase unwrapping and unit conversion. Since the magnetic flux density images could be quite noisy in practice, due to many factors, we may use a PDE-based denoising method such as harmonic decomposition.
- Model construction and data recovery. In the geometrical modeling of the conducting domain, identifications of the outermost boundary and electrode locations are critical to impose boundary conditions. We may use a semi-automatic tool employing a level-set-based segmentation method. There could be an internal region where an MR signal void occurred. In such a problematic region, measured Bz data are defective. We may use the harmonic inpainting method to recover Bz data, assuming that the local region is homogeneous in terms of the conductivity.
- Conductivity image reconstruction. We can use the harmonic Bz algorithm as the default algorithm for three-dimensional conductivity image reconstructions. We may apply the local harmonic Bz algorithm (Seo et al. 2008) for conductivity image reconstructions in chosen regions of interest.
Figure 9.12 Screen capture of CoReHA. It provides main menus for image viewing, calibration or coordinate setting and data processing, including data verification, segmentation, meshing and image reconstruction
9.6.2 Conductivity Phantom Imaging
Since Woo and Seo (2008) have summarized most of the published results of conductivity phantom imaging experiments (Oh et al. 2003, 2004, 2005), we introduce only one of them. Figure 9.13(a) shows a tissue phantom including chunks of three different biological tissues in a background of agar gel. Its MR magnitude and reconstructed conductivity images are shown in Figure 9.13(b) and 9.13(c) (Oh et al. 2005). Compared with the MR magnitude image in Figure 9.13(b), the reconstructed conductivity image in (c) shows excellent structural information as well as conductivity information. They measured conductivity values of the tissues beforehand and found that pixel values in the reconstructed conductivity image were close to the measured values. As shown in Figure 9.13(b), an air bubble was formed inside the phantom. The MR signal void in the air bubble caused the measured Bz data to be very noisy there. From Figure 9.13(c), we can see that the reconstructed conductivity image shows spurious spikes inside the region of the air bubble. Since this kind of technical problem can occur in a living body, the harmonic inpainting method was proposed (Lee et al. 2006).
Figure 9.13 Biological tissue phantom imaging using a 3 T MRI scanner. (a) The phantom, (b) its MR magnitude image and (c) reconstructed conductivity image using the harmonic Bz algorithm. From Oh et al. (2005)
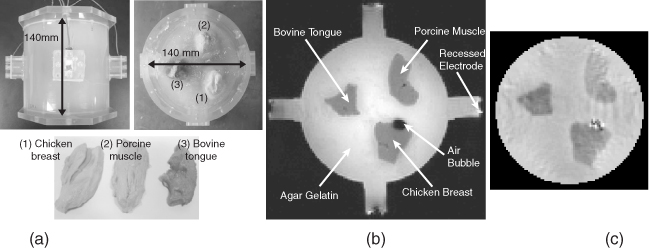
We should note that pixel values in Figure 9.13(c) provide totally different information about electrical conductivity values, whereas pixel values in Figure 9.13(b) are basically related to proton densities. There are enough examples showing that a conductivity image clearly distinguishes two objects whereas they are indistinguishable in the corresponding conventional MR image. This happens, for example, when two objects have almost the same proton densities but significantly different amounts of mobile ions.
9.6.3 Animal Imaging
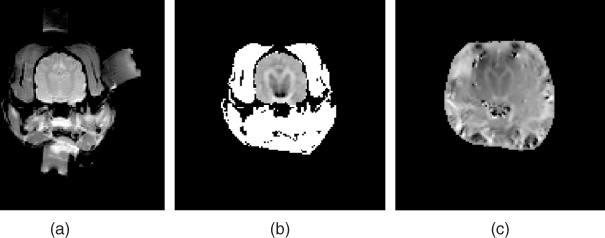
Figure 9.14 shows an experimental set-up for post mortem canine brain imaging experiments. Figure 9.15 shows reconstructed multi-slice conductivity images of a post mortem canine brain (Kim et al. 2007). These high-resolution conductivity images with a pixel size of 1.4 mm were obtained by using a 3 T MRI scanner and 40 mA injection currents. Restricting the conductivity image reconstruction only within the brain region to avoid technical difficulties related with the skull, these conductivity images of the intact canine brain clearly distinguish white and gray matter. Since the harmonic Bz algorithm cannot handle the tissue anisotropy, the concept of the equivalent isotropic conductivity should be adopted to interpret the reconstructed conductivity images. Figure 9.16 compares (a) an MR magnitude image, (b) a conductivity image of the brain region only and (c) a conductivity image of the entire head obtained from a post mortem canine head.
Figure 9.14 (a) Attachment of electrodes around a chosen imaging region and (b) placement of an imaging object inside an MRI scanner. B0 is the main magnetic field of the MRI scanner. From Kim et al. (2007)
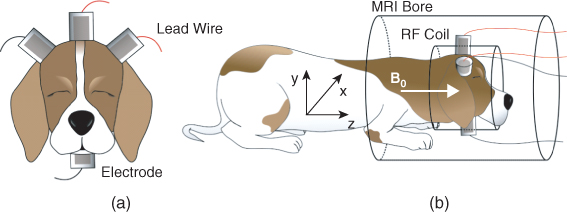
Figure 9.15 Post mortem animal imaging of a canine head using a 3 T MRI scanner. Multi-slice MR magnitude images of a canine head are shown in the upper panel, and reconstructed equivalent isotropic conductivity images of its brain are shown in the lower panel. From Kim et al. (2007)
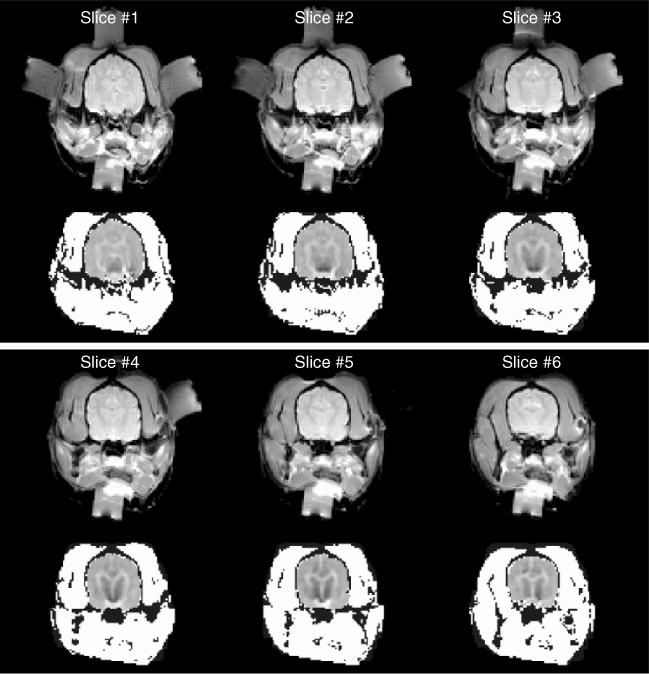
Figure 9.16 Comparison of (a) MR magnitude image, (b) conductivity image of the brain only, and (c) conductivity image of the entire head from a post mortem canine head
The image quality can be improved by using flexible electrodes with a larger contact area. Minhas et al. (2008) proposed a thin and flexible carbon-hydrogel electrode for MREIT imaging experiments. Using a pair of carbon-hydrogel electrodes with a large contact area, the amplitude of the injection current can be increased primarily due to a reduced average current density underneath the electrodes. Using two pairs of such electrodes, they reconstructed equivalent isotropic conductivity images of a swine leg, as shown in Figure 9.17, demonstrating the good contrast among different muscles and bones. From the reconstructed images, we can observe spurious spikes in the outer layers of bones, primarily due to the MR signal void there.
Figure 9.17 Post mortem animal imaging of a swine leg using a 3 T MRI scanner: multi-slice MR magnitude (top row), conductivity (middle row) and color-coded conductivity (bottom row). From Minhas et al. (2008)
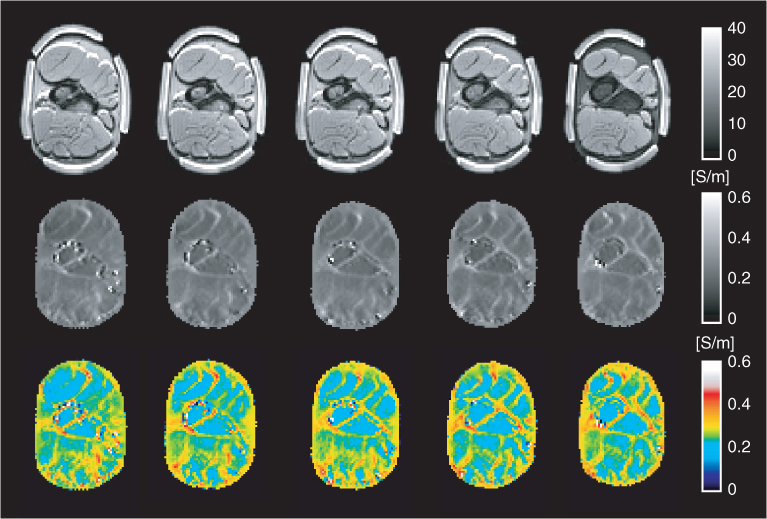
Figure 9.18(a) and 9.18(b) are MR magnitude and reconstructed conductivity images of a post mortem canine abdomen (Jeon et al. 2009b). Since the abdomen includes a complicated mixture of different organs, interpretation of the reconstructed conductivity image needs further investigation. They found that conductivity image contrast in the canine kidney is quite different from that of the MR magnitude image, clearly distinguishing the cortex, internal medulla, renal pelvis and urethra.
Figure 9.18 (a) MR magnitude image and (b) reconstructed conductivity image from a post mortem canine abdomen. The conductivity image in (b) shows a significantly different image contrast compared with the MR magnitude image in (a). From Jeon et al. (2009b)
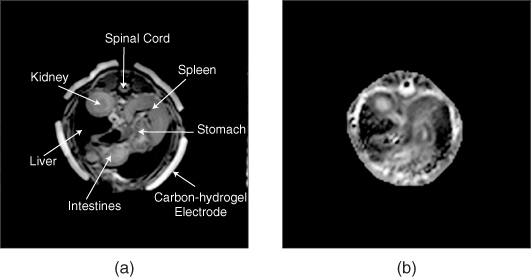
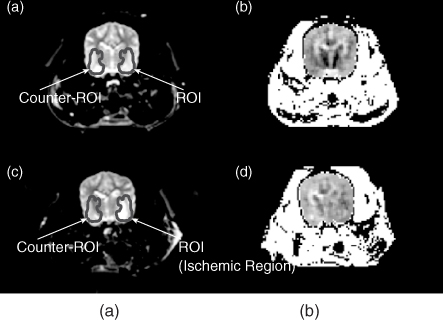
Figure 9.19 compares in vivo and post mortem conductivity images of the same canine brain (Kim et al. 2008a). Though the in vivo conductivity image is noisier than the post mortem image, primarily due to the reduced amplitude of injection currents, the in vivo image shows a good contrast among white matter, gray matter and other brain tissues. Figure 9.20 shows in vivo imaging experiments of canine brains without and with a regional brain ischemia. As shown in Figure 9.20, the ischemia produced noticeable conductivity changes in reconstructed images.
Figure 9.19 (a) In vivo and (c) post mortem MR magnitude images of a canine head. (b) In vivo and (d) post mortem equivalent isotropic conductivity images of the brain. The same animal was used for both in vivo and post mortem experiments. The image in (b) was obtained by using 5 mA injection currents, whereas 40 mA was used in (d). From Kim et al. (2008a)
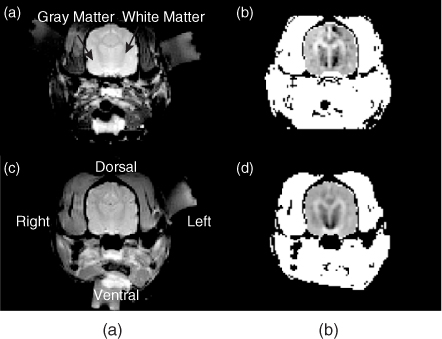
Figure 9.20 T2-weighted MR images of a canine head (a) before and (c) after the embolization. (b) and (d) The corresponding equivalent isotropic conductivity images. The region of interest (ROI) defines the ischemic region, and counter-ROI defines the symmetrical region in the other side of the brain. From Kim et al. (2008a)
9.6.4 Human Imaging
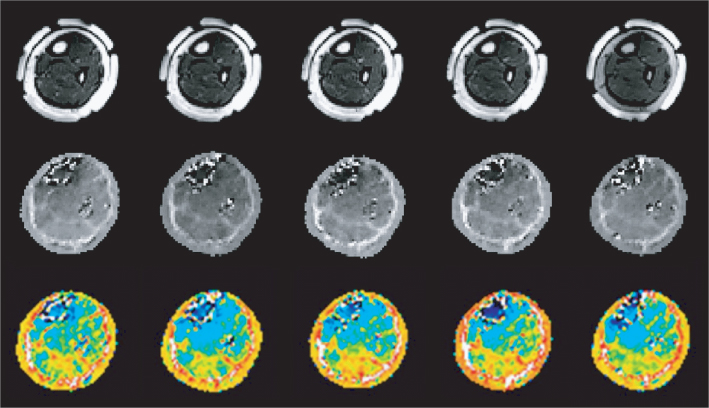
For an in vivo human imaging experiment, Kim et al. (2008b, 2009) chose the lower extremity as the imaging region. After a review by the Institutional Review Board, they performed an MREIT experiment of a human subject using a 3 T MRI scanner. They adopted thin and flexible carbon-hydrogel electrodes with conductive adhesive for current injections (Minhas et al. 2008). Owing to their large surface area of 80 × 60 mm2 and good contact with the skin, they could inject pulse-type currents with an amplitude as high as 9 mA into the lower extremity without producing a painful sensation. Sequential injections of two currents in orthogonal directions were used to produce the cross-sectional equivalent isotropic conductivity images in Figure 9.21 with 1.7 mm pixel size and 4 mm slice gap. The conductivity images distinguished well between different parts of muscles and bones. The outermost fatty layer was also clearly shown in each conductivity image. We could observe excessive noise in the outer layers of two bones due to the MR signal void phenomenon there.
Figure 9.21 In vivo MREIT imaging experiment of a human leg using a 3 T MRI scanner. Multi-slice MR magnitude images, reconstructed equivalent isotropic conductivity images, and color-coded conductivity images of a human leg are shown in the top, middle and bottom rows, respectively. From Kim et al. (2009). Reproduced with permission from IEEE
9.7 Applications
MREIT provides conductivity images of an electrically conducting object with a pixel size of about 1 mm. It achieves such a high spatial resolution by adopting an MRI scanner to measure internal magnetic flux density distributions induced by externally injected imaging currents. Theoretical and experimental studies in MREIT demonstrate that it is expected to be a new clinically useful bio-imaging modality. Its capability to distinguish the conductivity values of different biological tissues in their living wetted states is unique.
Following the in vivo imaging experiment of the canine brain (Kim et al. 2008b), numerous in vivo animal imaging experiments are being conducted for imaging regions of extremities, abdomen, pelvis, neck, thorax and head. Animal models of various diseases are also being tried. To reach the stage of clinical applications, in vivo human imaging experiments are also in progress (Kim et al. 2009). These trials are expected to accumulate new diagnostic information based on in vivo conductivity values of numerous biological tissues.
MREIT has been attempted to overcome the ill-posed nature of the inverse problem in EIT and to provide high-resolution conductivity images. Even though current EIT images have a relatively poor spatial resolution, the high temporal resolution and portability in EIT could be advantageous in several biomedical application areas (Holder 2005). Instead of competing in a certain application area, MREIT and EIT will be supplementary to each other. Taking advantage of the high spatial resolution in MREIT, Woo and Seo (2008) discussed numerous application areas of MREIT in biomedicine, biology, chemistry and material science. We should note that it is possible to produce a current density image for any electrode configuration once the conductivity distribution is obtained.
Future studies should overcome a few technical barriers to advance the method to the stage of routine clinical use. The biggest hurdle at present is the amount of injection current, which may stimulate muscle and nerve. Reducing it down to a level that does not produce undesirable side effects is the key to the success of this new bio-imaging modality. This demands innovative data processing methods based on rigorous mathematical analysis as well as improved measurement techniques to maximize SNRs for a given data collection time.
References
Alessandrini G and Magnanini R 1992 The index of isolated critical points and solutions of elliptic equations in the plane. Ann. Scuola Norm. Sup. Pisa Cl. Sci. (4) 19, 567–589.
Alessandrini G, Isakov V and Powell J 1995 Local uniqueness in the inverse problem with one measurement. Trans. Am. Math. Soc. 347, 3031–3041.
Bauman P, Marini A and Nesi V 2000 Univalent solutions of an elliptic system of partial differential equations arising in homogenization. Indiana Univ. Math. J. 128, 53–64.
Bernstein MA, King KF and Zhou XJ 2004 Handbook of MRI Pulse Sequences. Elsevier, Burlington, MA.
Birgul O and Ider YZ 1995 Use of the magnetic field generated by the internal distribution of injected currents for electrical impedance tomography. In Proc. 9th Int. Conf. on Electrical Bio-Impedance, Heidelberg, Germany, pp. 418–419.
Birgul O and Ider YZ 1996 Electrical impedance tomography using the magnetic field generated by injected currents. In Proc. 18th Annu. Int. Conf. IEEE Engineering in Medicine and Biology Society, Amsterdam, The Netherlands, pp. 784–785. IEEE, New York.
Birgul O, Eyuboglu BM and Ider YZ 2003 Experimental results for 2D magnetic resonance electrical impedance tomography (MREIT) using magnetic flux density in one direction. Phys. Med. Biol. 48, 3485–3504.
Birgul O, Hamamura MJ, Muftuler T and Nalcioglu O 2006 Contrast and spatial resolution in MREIT using low amplitude current. Phys. Med. Biol. 51, 5035–5049.
Folland G 1976 Introduction to Partial Differential Equations. Princeton University Press, Princeton, NJ.
Gao G, Zhu SA and He B 2005 Estimation of electrical conductivity distribution within the human head from magnetic flux density measurement. Phys. Med. Biol. 50, 2675–2687.
Gao N, Zhu SA and He BA 2006 New magnetic resonance electrical impedance tomography (MREIT) algorithm: the RSM-mREIT algorithm with applications to estimation of human head conductivity. Phys. Med. Biol. 51, 3067–3083.
Haacke EM, Brown RW, Thompson MR and Venkatesan R 1999 Magnetic Resonance Imaging: Physical Principles and Sequence Design. John Wiley & Sons, Inc., New York.
Hamamura MJ and Muftuler LT 2008 Fast imaging for magnetic resonance electrical impedance tomography. Magn. Reson. Imag. 26, 739–745.
Hamamura MJ, Muftuler LT, Birgul O and Nalcioglu O 2006 Measurement of ion diffusion using magnetic resonance electrical impedance tomography. Phys. Med. Biol. 51, 2753–2762.
Hasanov KF, Ma AW, Nachman AI and Joy MLG 2008 Current density impedance imaging. IEEE Trans. Med. Imag. 27, 1301–1309.
Hedeen RA and Edelstein WA 1997 Characterization and prediction of gradient acoustic noise in MR imagers. Magn. Reson. Med. 37, 7–10.
Holder D (ed.) 2005 Electrical Impedance Tomography: Methods, History and Applications. IOP Publishing, Bristol.
Ider YZ and Onart S 2004 Algebraic reconstruction for 3D MREIT using one component of magnetic flux density. Physiol. Meas. 25, 281–294.
Ider YZ, Onart S and Lionheart WRB 2003 Uniqueness and reconstruction in magnetic resonance electrical impedance tomography (MREIT). Physiol. Meas. 24, 591–604.
Jeon K, Lee CO, Kim HJ, Woo EJ and Seo JK 2009a CoReHA: conductivity reconstructor using harmonic algorithms for magnetic resonance electrical impedance tomography (MREIT). J. Biomed. Eng. Res. 30, 279–287.
Jeon K, Minhas AS, Kim YT, Jeong WC, Kim HJ, Kang BT, Park HM, Lee CO, Seo JK and Woo EJ 2009b MREIT conductivity imaging of the postmortem canine abdomen using CoReHA. Physiol. Meas. 30, 957–966.
Jeong WC, Kim YT, Minhas AS, Kim HJ, Woo EJ and Seo JK 2008 Design of carbon-hydrogel electrode for MREIT. In Proc. 9th Int. Conf. on Electrical Impedance Tomography, Dartmouth, NH.
Joy MLG, Scott GC and Henkelman RM 1989 In vivo detection of applied electric currents by magnetic resonance imaging. Magn. Reson. Imag. 7, 89–94.
Khang HS, Lee BI, Oh SH, Woo EJ, Lee SY, Cho MH, Kwon O, Yoon JR and Seo JK 2002 J-substitution algorithm in magnetic resonance electrical impedance tomography (MREIT): phantom experiments for static resistivity images. IEEE Trans. Med. Imag. 21, 695–702.
Kim HJ, Lee BI, Cho Y, Kim YT, Kang BT, Park HM, Lee SY, Seo JK and Woo EJ 2007 Conductivity imaging of canine brain using a 3T MREIT system: postmortem experiments. Physiol. Meas. 28, 1341–1353.
Kim HJ, Oh TI, Kim YT, Lee BI, Woo EJ, Seo JK, Lee SY, Kwon O, Park C, Kang BT and Park HM 2008a In vivo electrical conductivity imaging of a canine brain using a 3T MREIT system. Physiol. Meas. 29, 1145–1155.
Kim HJ, Kim YT, Jeong WC, Minhas AS, Woo EJ, Kwon OJ and Seo JK 2008b In vivo conductivity imaging of a human leg using a 3T MREIT system. In Proc. 9th Int. Conf. on Electrical Impedance Tomography, Dartmouth, NH.
Kim HJ, Kim YT, Minhas AS, Jeong WC, Woo EJ, Seo JK and Kwon OJ 2009 In vivo high-resolution conductivity imaging of the human leg using MREIT: the first human experiment. IEEE Trans. Med. Imag. 28, 1681–1611.
Kim YT, Yoo PJ, Oh TI and Woo EJ 2011 Magnetic flux density measurement in magnetic resonance electrical impedance tomography using a low-noise current source. Meas. Sci. Technol. 22, 105803.
Kwon O, Lee JY and Yoon JR 2002a Equipotential line method for magnetic resonance electrical impedance tomography (MREIT). Inv. Prob. 18, 1089–1100.
Kwon O, Woo EJ, Yoon JR and Seo JK 2002b Magnetic resonance electrical impedance tomography (MREIT): simulation study of J-substitution algorithm. IEEE Trans. Biomed. Eng. 48, 160–167.
Kwon O, Park C, Park EJ, Seo JK and Woo EJ 2005 Electrical conductivity imaging using a variational method in Bz-based MREIT. Inv. Prob. 21, 969–980.
Kwon O, Pyo H, Seo JK and Woo EJ 2006 Mathematical framework for Bz-based MREIT model in electrical impedance imaging. Int. J. Comput. Math. Appl. 51, 817–828.
Kwon OI, Lee BI, Nam HS and Park C 2007 Noise analysis and MR pulse sequence optimization in MREIT using an injected current nonlinear encoding (ICNE) method. Physiol. Meas. 28, 1391–1404.
Lee BI, Oh SH, Woo EJ, Lee SY, Cho MH, Kwon O, Seo JK and Baek WS 2003a Static resistivity image of a cubic saline phantom in magnetic resonance electrical impedance tomography (MREIT). Physiol. Meas. 24, 579–589.
Lee BI, Lee SH, Kim TS, Kwon O, Woo EJ and Seo JK 2005 Harmonic decomposition in PDE-based denoising technique for magnetic resonance electrical impedance tomography. IEEE Trans. Biomed. Eng. 52, 1912–1920.
Lee BI, Park C, Pyo HC, Kwon O and Woo EJ 2006 Optimization of current injection pulse width in MREIT. Physiol. Meas. 28, N1–7.
Liu JJ, Seo JK, Sini M and Woo EJ 2007 On the convergence of the harmonic Bz algorithm in magnetic resonance electrical impedance tomography. SIAM J. Appl. Math. 67, 1259–1282.
Minhas AS, Kim HJ, Kim YT, Jeong WC, Woo EJ and Seo JK 2008 Conductivity imaging of postmortem swine leg using MREIT. In Proc. 9th Int Conf. on Electrical Impedance Tomography, Dartmouth, NH.
Minhas AS, Woo EJ and Lee SY 2009 Magnetic flux density measurement with balanced steady state free precession pulse sequence for MREIT: a simulation study. In Conf. Proc. IEEE Engineering in Medicine and Biology Society, Minneapolis, MN, pp. 2276–2278.
Muftuler LT, Hamamura MJ, Birgul O and Nalcioglu O 2004 Resolution and contrast in magnetic resonance electrical impedance tomography (MREIT) and its application to cancer imaging. Technol. Cancer Res. Treat. 3, 599–609.
Muftuler LT, Hamamura MJ, Birgul O and Nalcioglu O 2006 In vivo MRI electrical impedance tomography (MREIT) of tumors. Technol. Cancer Res. Treat. 5, 381–387.
Nachman A, Tamasan A and Timonov A 2007 Conductivity imaging with a single measurement of boundary and interior data. Inv. Prob. 23, 2551–2563.
Nachman A, Tamasan A and Timonov A 2009 Recovering the conductivity from a single measurement of interior data. Inv. Prob. 25, 035014.
Nam HS and Kwon OI 2010 Optimization of multiply acquired magnetic flux density B(z) using ICNE-multiecho train in MREIT. Phys. Med. Biol. 55, 2743–2759.
Oh SH, Lee BI, Woo EJ, Lee SY, Cho MH, Kwon O and Seo JK 2003 Conductivity and current density image reconstruction using harmonic Bz algorithm in magnetic resonance electrical impedance tomography. Phys. Med. Biol. 48, 3101–3116.
Oh SH, Lee BI, Park TS, Lee SY, Woo EJ, Cho MH, Kwon O and Seo JK 2004 Magnetic resonance electrical impedance tomography at 3 Tesla field strength. Magn. Reson. Med. 51, 1292–1296.
Oh SH, Lee BI, Woo EJ, Lee SY, Kim TS, Kwon O and Seo JK 2005 Electrical conductivity images of biological tissue phantoms in MREIT. Physiol. Meas. 26, S279–288.
Oh TI, Cho Y, Hwang YK, Oh SH, Woo EJ and Lee SY 2006 Improved current source design to measure induced magnetic flux density distributions in MREIT. J. Biomed. Eng. Res. 27, 30–37.
Park C, Kwon O, Woo EJ and Seo JK 2004a Electrical conductivity imaging using gradient Bz decomposition algorithm in magnetic resonance electrical impedance tomography (MREIT). IEEE Trans. Med. Imag. 23, 388–394.
Park C, Park EJ, Woo EJ, Kwon O and Seo JK 2004b Static conductivity imaging using variational gradient Bz algorithm in magnetic resonance electrical impedance tomography. Physiol. Meas. 25, 275–269.
Park C, Lee BI, Kwon O and Woo EJ 2006 Measurement of induced magnetic flux density using injection current nonlinear encoding (ICNE) in MREIT. Physiol. Meas. 28, 117–127.
Reilly JP 1998 Applied Bioelectricity: From Electrical Stimulation to Electropathology. Springer, New York.
Sadleir R 2005 Noise analysis in MREIT at 3 and 11 Tesla field strength. Physiol. Meas. 26, 875–884.
Scott GC, Joy MLG, Armstrong RL and Henkelman RM 1991 Measurement of nonuniform current density by magnetic resonance. IEEE Trans. Med. Imag. 10, 362–374.
Scott GC, Joy MLG, Armstrong RL and Hankelman RM 1992 Sensitivity of magnetic resonance current density imaging. J. Magn. Reson. 97, 235–254.
Seo JK 1996 A uniqueness result on inverse conductivity problem with two measurements. J. Fourier Anal. Appl. 2, 515–524.
Seo JK and Woo EJ 2011 Magnetic resonance electrical impedance tomography (MREIT). SIAM Rev. 53, 40–68.
Seo JK, Kwon O, Lee BI and Woo EJ 2003a Reconstruction of current density distributions in axially symmetric cylindrical sections using one component of magnetic flux density: computer simulation study. Physiol. Meas. 24, 565–577.
Seo J K, Yoon J R, Woo E J and Kwon O 2003b Reconstruction of conductivity and current density images using only one component of magnetic field measurements. IEEE Trans. Biomed. Eng. 50, 1121–1124.
Seo JK, Pyo HC, Park CJ, Kwon O and Woo EJ 2004 Image reconstruction of anisotropic conductivity tensor distribution in MREIT: computer simulation study. Phys. Med. Biol. 49, 4371–4382.
Seo JK, Kim SW, Kim S, Liu J, Woo EJ, Jeon K and Lee CO 2008 Local harmonic Bz algorithm with domain decomposition in MREIT: computer simulation study. IEEE Trans. Med. Imag. 27, 1754–1761.
Verchota G 1984 Layer potentials and boundary value problems for Laplace equation in Lipschitz domains. J. Funct. Anal. 59, 572–611.
Woo EJ and Seo JK 2008 Magnetic resonance electrical impedance tomography (MREIT) for high-resolution conductivity imaging. Physiol. Meas. 29, R1–26.
Woo EJ, Lee SY and Mun CW 1994 Impedance tomography using internal current density distribution measured by nuclear magnetic resonance. Proc. SPIE 2299, 377–385.
Zhang N 1992 Electrical impedance tomography based on current density imaging. MS Thesis, University of Toronto, Canada.


