4
Variance
A measure of variability is perhaps the most important quantity in statistical analysis. The greater the variability in the data, the greater will be our uncertainty in the values of parameters estimated from the data, and the lower will be our ability to distinguish between competing hypotheses about the data.
Consider the following data, y, which are plotted simply in the order in which they were measured:
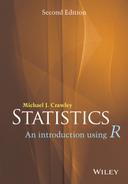
y <- c(13,7,5,12,9,15,6,11,9,7,12)plot(y,ylim=c(0,20))
How can we quantify the variation (the scatter) in y that we can see here? Perhaps the simplest measure is the range of y values:
range(y)
[1] 5 15
plot(1:11,y,ylim=c(0,20),pch=16,col="blue")lines(c(4.5,4.5),c(5,15),col="brown")lines(c(4.5,3.5),c(5,5),col="brown",lty=2)lines(c(4.5,5.5),c(15,15),col="brown",lty=2)
This is a reasonable measure of variability, but it is too dependent on outlying values for most purposes. Also, we want all of our data to contribute to the measure of variability, not just the maximum and minimum values.
How about estimating the mean value, and looking at the departures from the mean (known as ‘residuals’ or ‘deviations’)?
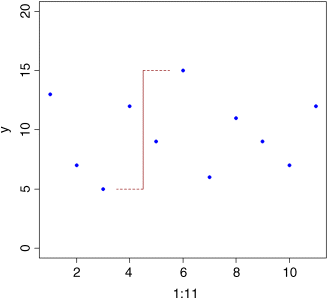
plot(1:11,y,ylim=c(0,20),pch=16,col="blue")abline(h=mean(y),col="green")for (i in 1:11) lines(c(i,i),c(mean(y),y[i]),col="red")
The longer the red lines, the more variable the data. So this looks promising. How about adding up the lengths of the red lines: ![]() ? A moment's thought will show that this is no good, because the negative residuals (from the points below the mean) will cancel out the positive residuals (from the points above the line). In fact, it is easy to prove that this quantity
? A moment's thought will show that this is no good, because the negative residuals (from the points below the mean) will cancel out the positive residuals (from the points above the line). In fact, it is easy to prove that this quantity ![]() is zero, no matter what the variation in the data, so that's no good (see Box 4.1).
is zero, no matter what the variation in the data, so that's no good (see Box 4.1).
But the only problem was the minus signs. How about ignoring the minus signs and adding up the absolute values of the residuals: ![]() . This is a very good measure of variability, and is used in some modern, computationally intensive methods. The problem is that it makes the sums hard, and we do not want that. A much more straightforward way of getting rid of the problem of the minus signs is to square the residuals before we add them up:
. This is a very good measure of variability, and is used in some modern, computationally intensive methods. The problem is that it makes the sums hard, and we do not want that. A much more straightforward way of getting rid of the problem of the minus signs is to square the residuals before we add them up: ![]() . This is perhaps the most important single quantity in all of statistics. It is called, somewhat unimaginatively, the sum of squares. So, in our figure (above) imagine squaring the lengths of each of the vertical red lines:
. This is perhaps the most important single quantity in all of statistics. It is called, somewhat unimaginatively, the sum of squares. So, in our figure (above) imagine squaring the lengths of each of the vertical red lines:
y - mean(y)
[1] 3.3636364 -2.6363636 -4.6363636 2.3636364 -0.6363636 5.3636364[7] -3.6363636 1.3636364 -0.6363636 -2.6363636 2.3636364
(y - mean(y))^2
[1] 11.3140496 6.9504132 21.4958678 5.5867769 0.4049587 28.7685950[7] 13.2231405 1.8595041 0.4049587 6.9504132 5.5867769
then adding up all these squared differences:
sum((y - mean(y))^2)
[1] 102.5455
So the sum of squares for our data is 102.5455. But what are its units? Well that depends on the units in which y is measured. Suppose the y values were lengths in mm. So the units of the sum of squares are mm2 (like an area).
Now what would happen to the sum of squares if we added a 12th data point? It would get bigger, of course. And it would get bigger for every extra data point we added (except in the unlikely event that our new data point was exactly equal to the mean value, in which case we would add zero squared = 0). We do not want our measure of variability to depend on sample size in this way, so the obvious solution is to divide by the number of samples, to get the mean squared deviation.
At this point we need to make a brief, but important, diversion. Before we can progress, we need to understand the concept of degrees of freedom.
Degrees of Freedom
Suppose we had a sample of five numbers and their average was 4. What was the sum of the five numbers? It must have been 20, otherwise the mean would not have been 4. So now let us think about each of the five numbers in turn.
We will put a number in each of the five boxes. If we allow that the numbers could be positive or negative real numbers, we ask how many values could the first number take? Once you see what I'm doing, you will realize it could take any value. Suppose it was a 2.
| 2 |
How many values could the next number take? It could be anything. Say, it was a 7.
| 2 | 7 |
And the third number? Anything. Suppose it was a 4.
| 2 | 7 | 4 |
The fourth number could be anything at all. Say it was 0.
| 2 | 7 | 4 | 0 |
Now then. How many values could the last number take? Just one. It has to be another 7 because the numbers have to add up to 20 because the mean of the five numbers is 4.
| 2 | 7 | 4 | 0 | 7 |
To recap. We have total freedom in selecting the first number. And the second, third and fourth numbers. But we have no choice at all in selecting the fifth number. We have 4 degrees of freedom when we have five numbers. In general we have n − 1 degrees of freedom if we estimated the mean from a sample of size n. More generally still, we can propose a formal definition of degrees of freedom: degrees of freedom is the sample size, n, minus the number of parameters, p, estimated from the data.
This is so important, you should memorize it. In the example we plotted earlier we had n = 11 and we estimated just one parameter from the data: the sample mean, ![]() . So we have n − 1 = 10 d.f.
. So we have n − 1 = 10 d.f.
Variance
We return to developing our quantitative measure of variability. We have come to the conclusion that the sum of squares ![]() is a good basis for assessing variability, but we have the problem that the sum of squares increases with every new data point we add to the sample. The intuitive thing to do would be to divide by the number of numbers, n, to get the mean squared deviation. But look at the formula for the sum of squares:
is a good basis for assessing variability, but we have the problem that the sum of squares increases with every new data point we add to the sample. The intuitive thing to do would be to divide by the number of numbers, n, to get the mean squared deviation. But look at the formula for the sum of squares: ![]() . We cannot begin to calculate it until we know the value of the sample mean,
. We cannot begin to calculate it until we know the value of the sample mean, ![]() . And where do we get the value of
. And where do we get the value of ![]() from? Do we know it in advance? Can we look it up in tables? No, we need to calculate it from the data. The mean value
from? Do we know it in advance? Can we look it up in tables? No, we need to calculate it from the data. The mean value ![]() is a parameter estimated from the data, so we lose one degree of freedom as a result. Thus, in calculating the mean squared deviation we divide by the degrees of freedom, n − 1, rather than by the sample size, n. In the jargon, this provides us with an unbiased estimate of the variance, because we have taken account of the fact that one parameter was estimated from the data prior to computation.
is a parameter estimated from the data, so we lose one degree of freedom as a result. Thus, in calculating the mean squared deviation we divide by the degrees of freedom, n − 1, rather than by the sample size, n. In the jargon, this provides us with an unbiased estimate of the variance, because we have taken account of the fact that one parameter was estimated from the data prior to computation.
Now we can formalize our definition of the measure that we shall use throughout the book for quantifying variability. It is called variance and it is represented conventionally by s2:
This is one of the most important definitions in the book, and you should commit it to memory. We can put it into a more mathematical form, by spelling out what we mean by each of the phrases in the numerator and the denominator:
Let's write an R function to do this. We have most of the necessary components already (see above); the sum of squares is obtained as sum((y-mean(y))^2). For the degrees of freedom, we need to know the number of numbers in the vector, y. This is obtained by the function length(y). Let us call the function variance and write it like this:
variance <- function (x) sum((x-mean(x))^2)/(length(x)-1)
Now we can try out the function on our data, like this:
variance(y)
[1] 10.25455
So there we have it. Our quantification of the variation we saw in the first plot is the sample variance, s2 = 10.25455. You will not be surprised that R provides its own, built-in function for calculating variance, and it has an even simpler name than the function we just wrote: var
var(y)
[1] 10.25455
Variance is used in countless ways in statistical analysis, so this section is probably the most important in the whole book, and you should reread it until you are sure that you know exactly what variance is, and precisely what it measures (Box 4.2).
Variance: A Worked Example
The data in the following table come from three market gardens. The data show the ozone concentrations in parts per hundred million (pphm) on 10 summer days.
ozone <- read.csv("c:\temp\gardens.csv")attach(ozone)ozone
gardenA gardenB gardenC1 3 5 32 4 5 33 4 6 24 3 7 15 2 4 106 3 4 47 1 3 38 3 5 119 5 6 310 2 5 10
The first step in calculating variance is to work out the mean:
mean(gardenA)
[1] 3
Now we subtract the mean value (3) from each of the data points:
gardenA - mean(gardenA)
[1] 0 1 1 0 -1 0 -2 0 2 -1
This produces a vector of differences (of length = 10). We need to square these differences:
(gardenA - mean(gardenA))^2
[1] 0 1 1 0 1 0 4 0 4 1
then add up the squared differences:
sum((gardenA - mean(gardenA))^2)
[1] 12
This important quantity is called ‘the sum of squares’. Variance is the sum of squares divided by degrees of freedom. We have 10 numbers, and have estimated one parameter from the data (the mean) in calculating the sum of squares, so we have 10 – 1 = 9 d.f.
sum((gardenA - mean(gardenA))^2)/9
[1] 1.333333
So the mean ozone concentration in garden A is 3.0 and the variance in ozone concentration is 1.33. We now do the same for garden B:
mean(gardenB)
[1] 5
It has a much higher mean ozone concentration than garden A. But what about its variance?
gardenB - mean(gardenB)
[1] 0 0 1 2 -1 -1 -2 0 10
(gardenB - mean(gardenB))^2
[1] 0 0 1 4 1 1 4 0 1 0
sum((gardenB - mean(gardenB))^2)
[1] 12
sum((gardenB - mean(gardenB))^2)/9
[1] 1.333333
This is interesting: so although the mean values are quite different, the variances are exactly the same (both have s2 = 1.33333). What about garden C?
mean(gardenC)
[1] 5
Its mean ozone concentration is exactly the same as in garden B.
gardenC - mean(gardenC)
[1] -2 -2 -3 -4 5 -1 -2 6 -2 5
(gardenC - mean(gardenC))^2
[1] 4 4 9 16 25 1 4 36 4 25
sum((gardenC - mean(gardenC))^2)
[1] 128
sum((gardenC - mean(gardenC))^2)/9
[1] 14.22222
So, although the means in gardens B and C are identical, the variances are quite different (1.33 and 14.22, respectively). Are the variances significantly different? We do an F test for this, dividing the larger variance by the smaller variance:
var(gardenC)/var(gardenB)
[1] 10.66667
Then look up the probability of getting an F ratio as big as this by chance alone if the two variances were really the same. We need the cumulative probability of the F distribution, which is a function called pf that we need to supply with three arguments: the size of the variance ratio (10.667), the number of degrees of freedom in the numerator (9) and the number of degrees of freedom in the denominator (also 9). We did not know in advance which garden was going to have the higher variance, so we do what is called a two-tailed test (we simply multiply the probability by 2):
2*(1 - pf(10.667,9,9))
[1] 0.001624002
This probability is much less than 5%, so we conclude that there is a highly significant difference between these two variances. We could do this even more simply by using the built-in F test:
var.test(gardenB,gardenC)
F test to compare two variancesdata: gardenB and gardenCF = 0.0938, num df = 9, denom df = 9, p-value = 0.001624alternative hypothesis: true ratio of variances is not equal to 195 percent confidence interval:0.02328617 0.37743695sample estimates:ratio of variances0.09375
So the two variances are significantly different. But why does this matter?
What follows is one of the most important lessons so far, so keep rereading it until you are sure that you understand it. Comparing gardens A and B, we can see that two samples can have different means, but the same variance. This is assumed to be the case when we carry out standard tests (like Student's t test) to compare two means, or an analysis of variance to compare three or more means. Constancy of variance is the most important assumption we make in most statistical analyses.
Comparing gardens B and C, we can see that two samples can have the same mean but different variances. Samples with the same mean are identical, right? Wrong! Let us look into the science in a bit more detail. The damage threshold for lettuces is 8 pphm ozone, so looking at the means shows that both gardens are free of ozone damage on their lettuces (the mean of 5 for both B and C is well below the threshold of 8). Let us look at the raw data for garden B. How many of the days had ozone > 8? Look at the dataframe and you will see that none of the days exceeded the threshold. What about garden C?
gardenC
[1] 3 3 2 1 10 4 3 11 3 10
In garden C ozone reached damaging concentrations on three days out of 10, so 30% of the time the lettuce plants would be suffering ozone damage. This is the key point: when the variances are different, we should not make inferences by comparing the means. When we compare the means, we conclude that garden C is like garden B, and that there will be no ozone damage to the lettuces. When we look at the data, we see that this is completely wrong: there is ozone damage 30% of the time in garden C and none of the time in garden B.
The moral of this story is: when the variances are different, don't compare the means. If you do, you run the risk of coming to entirely the wrong conclusion.
Variance and Sample Size
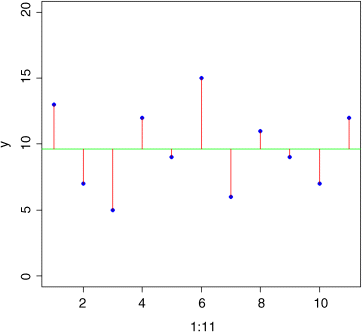
It is important to understand the relationship between the size of a sample (the replication, n) and the value of variance that is estimated. We can do a simple simulation experiment to investigate this:
plot(c(0,32),c(0,15),type="n",xlab="Sample size",ylab="Variance")
The plan is to select random numbers from a normal distribution using the function rnorm. Our distribution is defined as having a mean of 10 and a standard deviation of 2 (this is the square root of the variance, so s2 = 4). We shall work out the variance for sample sizes between n = 3 and n = 31, and plot 30 independent instances of variance at each of the selected sample sizes:
for (n in seq(3,31,2)) {for( i in 1:30){x <- rnorm(n,mean=10,sd=2)points(n,var(x)) }}
You see that as sample size declines, the range of the estimates of sample variance increases dramatically (remember that the population variance is constant at s2 = 4 throughout). The problem becomes severe below samples of 13 or so, and is very serious for samples of 7 or fewer. Even for reasonably large samples (like n = 31) the variance varies more than threefold in just 30 trials (you can see that the rightmost group of points vary from about 2 to about 6). This means that for small samples, the estimated variance is badly behaved, and this has serious consequences for estimation and hypothesis testing.
When people ask ‘How many samples do I need?’ a statistician will often answer with another question, ‘How many can you afford?’ Other things being equal, what we have learned in this chapter is that 30 is a reasonably good sample. Anything less than this is a small sample, and anything less than 10 is a very small sample. Anything more than 30 may be an unnecessary luxury (i.e. a waste of resources). We shall see later when we study power analysis how the question of sample size can be addressed more objectively. But for the time being, take n = 30 samples if you can afford it, and you will not go far wrong.
Using Variance
Variance is used in two main ways:
- for establishing measures of unreliability (e.g. confidence intervals)
- for testing hypotheses (e.g. Student's t test)
A Measure of Unreliability
Consider the properties that you would like a measure of unreliability to possess. As the variance of the data increases, what would happen to the unreliability of estimated parameters? Would it go up or down? Unreliability would go up as variance increased, so we would want to have the variance on the top (the numerator) of any divisions in our formula for unreliability:
What about sample size? Would you want your estimate of unreliability to go up or down as sample size, n, increased? You would want unreliability to go down as sample size went up, so you would put sample size on the bottom of the formula for unreliability (i.e. in the denominator):
Finally, consider the units in which you would want unreliability to be expressed. What are the units in which our current measure is expressed? Sample size is dimensionless, but variance is based on the sum of squared differences, so it has dimensions of squared values of y. So if the mean was a length in cm, the variance would be an area in cm2. This is an unfortunate state of affairs. It would make good sense to have the dimensions of the unreliability measure the same as the dimensions of the parameter whose unreliability is being measured. That is why all unreliability measures are enclosed inside a big square-root term. Unreliability measures are called standard errors. What we have just worked out is the standard error of the mean:
This is a very important equation and should be memorized. Let us calculate the standard errors of each of our market garden means:
sqrt(var(gardenA)/10)
[1] 0.3651484
sqrt(var(gardenB)/10)
[1] 0.3651484
sqrt(var(gardenC)/10)
[1] 1.19257
In written work one shows the unreliability of any estimated parameter in a formal, structured way like this:
‘The mean ozone concentration in garden A was 3.0 ± 0.365 pphm (1 s.e., n = 10)’
You write plus or minus, then the unreliability measure, the units (parts per hundred million in this case) then, in brackets, tell the reader what the unreliability measure is (in this case one standard error) and the size of the sample on which the parameter estimate was based (in this case 10). This may seem rather stilted, unnecessary even. But the problem is that unless you do this, the reader will not know what kind of unreliability measure you have used. For example, you might have used a 95% confidence interval or a 99% confidence interval instead of one standard error.
Confidence Intervals
A confidence interval shows the likely range in which the mean would fall if the sampling exercise were to be repeated. It is a very important concept that people always find difficult to grasp at first. It is pretty clear that the confidence interval will get wider as the unreliability goes up, so:
But what do we mean by ‘confidence’? This is the hard thing to grasp. Ask yourself this question. Would the interval be wider or narrower if we wanted to be more confident that out repeat sample mean will fall inside the interval? It may take some thought, but you should be able to convince yourself that the more confident you want to be, the wider the interval will need to be. You can see this clearly by considering the limiting case of complete and absolute certainty. Nothing is certain in statistical science, so the interval would have to be infinitely wide.
We can produce confidence intervals of different widths by specifying different levels of confidence. The higher the confidence, the wider the interval. How exactly does this work? How do we turn the proportionality (![]() ) in the equation above into equality? The answer is by resorting to an appropriate theoretical distribution (as explained below). Suppose our sample size is too small to use the normal distribution (n < 30, as here); then we traditionally use Student's t distribution. The values of Student's t associated with different levels of confidence are available in the function qt, which gives the quantiles of the t distribution. Confidence intervals are always two-tailed because the parameter may be larger or smaller than our estimate of it. Thus, if we want to establish a 95% confidence interval we need to calculate the value of Student's t associated with
) in the equation above into equality? The answer is by resorting to an appropriate theoretical distribution (as explained below). Suppose our sample size is too small to use the normal distribution (n < 30, as here); then we traditionally use Student's t distribution. The values of Student's t associated with different levels of confidence are available in the function qt, which gives the quantiles of the t distribution. Confidence intervals are always two-tailed because the parameter may be larger or smaller than our estimate of it. Thus, if we want to establish a 95% confidence interval we need to calculate the value of Student's t associated with ![]() (i.e. with 0.01(100%– 95%)/2). The value is found like this for the left-hand (0.025) and right-hand (0.975) tails:
(i.e. with 0.01(100%– 95%)/2). The value is found like this for the left-hand (0.025) and right-hand (0.975) tails:
qt(.025,9)
[1] -2.262157
qt(.975,9)
[1] 2.262157
The first argument in qt is the probability and the second is the degrees of freedom. This says that values as small as −2.262 standard errors below the mean are to be expected in 2.5% of cases (p = 0.025), and values as large as +2.262 standard errors above the mean with similar probability (p = 0.975). Values of Student's t are numbers of standard errors to be expected with specified probability and for a given number of degrees of freedom. The values of t for 99% are bigger than these (0.005 in each tail):
qt(.995,9)
[1] 3.249836
and the value for 99.5% confidence are bigger still (0.0025 in each tail):
qt(.9975,9)
[1] 3.689662
Values of Student's t like these appear in the formula for calculating the width of the confidence interval, and their inclusion is the reason why the width of the confidence interval goes up as our degree of confidence is increased. The other component of the formula, the standard error, is not affected by our choice of confidence level. So, finally, we can write down the formula for the confidence interval of a mean based on a small sample (n < 30):
For garden B, therefore, we calculate
qt(.975,9)*sqrt(1.33333/10)
[1] 0.826022
and we would present the result in written work like this:
‘The mean ozone concentration in garden B was 5.0 ± 0.826 (95% CI, n = 10).’
Bootstrap
A completely different way of calculating confidence intervals is called bootstrapping. You have probably heard the old phrase about ‘pulling yourself up by your own bootlaces’. That is where the term comes from. It is used in the sense of getting ‘something for nothing’. The idea is very simple. You have a single sample of n measurements, but you can sample from this in very many ways, so long as you allow some values appear more than once, and other samples to be left out (i.e. sampling with replacement). All you do is calculate the sample mean lots of times, once for each sampling from your data, then obtain the confidence interval by looking at the extreme highs and lows of the estimated means using a function called quantile to extract the interval you want (e.g. a 95% interval is specified using c(0.0275, 0.975) to locate the lower and upper bounds). Here are the data:
data <- read.csv("c:\temp\skewdata.csv")attach(data)names(data)
[1] "values"
We shall simulate sample sizes (k) between 5 and 30, and for each sample size we shall take 10 000 independent samples from our data (the vector called values), using the function called sample with replacement (replace=T):
plot(c(0,30),c(0,60),type="n",xlab="Sample size",ylab="Confidence interval")for (k in seq(5,30,3)){a <- numeric(10000)for (i in 1:10000){a[i] <- mean(sample(values,k,replace=T))}points(c(k,k),quantile(a,c(.025,.975)),type="b",pch=21,bg="red")}
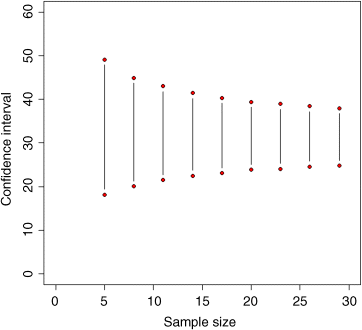
The confidence interval narrows rapidly over the range of sample sizes up to about 20, but more slowly thereafter. At n = 30, the bootstrapped CI based on 10 00 simulations was
quantile(a,c(0.025,0.975))2.5% 97.5%24.86843 37.6895
(you will get slightly different values because of the randomization). It is interesting to see how this compares with the normal theory confidence interval: ![]() implying that a repeat of the sample is likely to have a mean value in the range 24.39885 to 37.53846. As you see, the estimates from the bootstrap and normal theory are reassuringly close. But they are not identical.
implying that a repeat of the sample is likely to have a mean value in the range 24.39885 to 37.53846. As you see, the estimates from the bootstrap and normal theory are reassuringly close. But they are not identical.
Here are the bootstrapped intervals compared with the intervals calculated from the normal (blue solid line):
xv <- seq(5,30,0.1)yv <- mean(values)+1.96*sqrt(var(values)/xv)lines(xv,yv,col="blue")yv <- mean(values)-1.96*sqrt(var(values)/xv)lines(xv,yv,col="blue")
and Student's t distribution (green dotted line):
yv <- mean(values)-qt(.975,xv−1)*sqrt(var(values)/xv)lines(xv,yv,lty=2,col="green")yv <- mean(values)+qt(.975,xv−1)*sqrt(var(values)/xv)lines(xv,yv,lty=2,col="green")
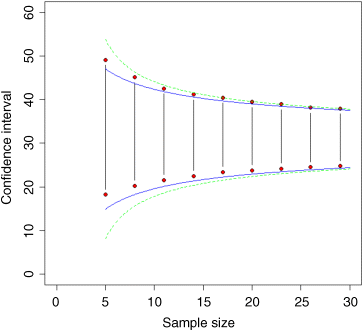
For the upper interval, you see that the bootstrapped intervals (vertical lines and red symbols) fall between the normal (the lower, blue line) and the Student's t distribution (the greater, dotted green line). For the lower interval, however, the bootstrapped intervals are quite different. This is because of the skewness exhibited by these data. Very small values of the response are substantially less likely than predicted by the symmetrical normal (blue line) or Student's t (dotted green line) distributions. Recall that for small-sample confidence intervals using Students t distribution, the sample size, n, enters the equation twice: once as the denominator in the formula for the standard error of the mean, then again as a determinant of the quantile of the t distribution qt(0.975,n-1). That is why the difference between the normal and the Student's t confidence intervals gets bigger as sample size gets smaller.
So which kind of confidence interval should you choose? I prefer the bootstrapped estimate because it makes fewer assumptions. If, as in our example, the data are skew, then this is reflected in the asymmetry of the confidence intervals above and below the mean (6.7 above the mean, and 6.1 below it, at n = 30). Both normal and Student's t assume that there is no skew, and so their confidence intervals are symmetrical, whatever the data actually show.
Non-constant Variance: Heteroscedasticity
One of the most important assumptions in classical statistical analysis is that the variance does not change with the mean value of the response variable. A good model must account adequately for the observed variance-mean relationship. A plot of standardised residuals against fitted values should look like the sky at night (points scattered at random over the whole plotting region as in the left hand panel), with no trend in the size or degree of scatter of the residuals. A common problem is that the variance increases with the mean, so that we obtain an expanding, fan-shaped pattern of residuals (right hand panel).
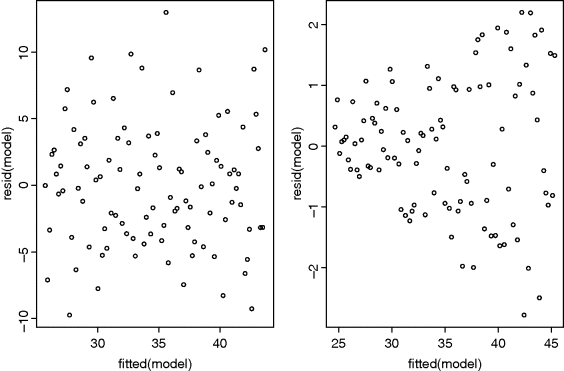
The plot on the left is what we want to see: no trend in the residuals with the fitted values. The plot on the right is a problem. There is a clear pattern of increasing residuals as the fitted values get larger. This is a picture of what heteroscedasticity looks like.
Further Reading
- Rowntree, D. (1981) Statistics without Tears: An Introduction for Non-Mathematicians, Penguin, London.