
CHAPTER 6
Maximizing Momentum: The Path Matters
“…as the formation period return accumulates gradually over many days, the flow of information is continuous.”1
—Z. Da et al., The Review of Financial Studies
Chapter 5 highlighted that stocks with strong intermediate-term momentum signals, generically calculated as the past 12-month cumulative returns (skipping the most recent month), exhibit a strong continuation in returns. The evidence is pervasive across multiple time periods and asset classes. Given this empirical fact, a natural question arises: Can we do better than the generic intermediate-term momentum indicator? Figuring out a way to accomplish this goal can be difficult, especially when the risk of optimization and data mining is high. However, academic researchers have been studying this question for a while and have developed solutions that improve on the generic momentum algorithm, while simultaneously showing how the improvement relates to the theoretical behavioral foundations for momentum's existence. In other words, momentum improvements are evidence-based enhancements developed through the lens of the sustainable active framework, and not data mining run amok.
For over a year, we examined every respectable research piece on momentum stock selection strategies we could find and came to the general conclusion that one of the core ways to improve on a generic momentum strategy is to focus on the time-series characteristics of a momentum stock. In other words, we need to look at the path through which a momentum stock actually became classified as a momentum stock (see Appendix A for information on some of the top competing ideas we examined and our analysis).
An example can highlight the importance of the path dependency of a momentum stock. Consider the so-called “Internet bubble,” which grew during the late 1990s and eventually burst in 2000. There were many firms with absurdly high generic momentum signals, as investors could not resist buying Internet stocks at sky-high valuations. We chose to examine two high-momentum stocks as of March 31, 2000 (this was near the end of the bubble).
The first firm we selected was Alliance Pharmaceutical Corp, a biotech company. This biotech company was hoping to provide the market with a new product, Oxygent, to help supply oxygen to tissues during surgery. The second firm we examined was International Rectifier Corp, a company founded in 1947 that produced power management semiconductors. As of March 31, 2000, both stocks were classified as high-momentum stocks.
Figure 6.1 plots the total cumulative returns over the past 12 months, as of March 31, 2000. Two points to note: First, there is a vertical line on February 29, 2000. To calculate intermediate-term momentum we measure up until February 29, 2000, because generic momentum calculations exclude the most recent month. As of February 29, 2000, Alliance Pharmaceutical was up 554 percent over the past year, while International Rectifier Corp was up 498 percent. Both stocks reflect a value investor's worst nightmare, but a momentum investor's dream.

Figure 6.1 Alliance and International Rectifier Past Performance
The second point is that the two stock charts follow a different path. Eyeballing the charts, we see that International Rectifier Corp follows a smoother path to high momentum, whereas Alliance Pharmaceutical Corp has a more jumpy path. Tossing aside our ad-hoc eyeballing of the charts, we can objectively quantify this observation. Assuming two stocks achieve roughly the same momentum, one way to measure “jumpy versus smooth” is to compute the percentage of days that have a positive return relative to the percentage of days that have a negative return. We would expect firms with a “smoother” momentum to have a higher percentage of positive return days and a lower percentage of negative return days. We see this expectation in the current situation: Measured over a year, Alliance Pharmaceutical had a positive return 49 percent of the trading days and a negative return on 43 percent of the trading days, whereas International Rectifier Corp had a positive return on 55 percent of the trading days and a negative return on 40 percent of the trading days (total days don't add up to 100 percent because there is a percentage of days with no movement).
In the situation outlined above, we can see both visually and quantitatively that International Rectifier had a smoother return stream. But does the “smoother” high-momentum stock outperform the “jumpier” high-momentum stock? We see the results of this cherry-picked example in Figure 6.2.

Figure 6.2 Alliance and International Rectifier Future Performance
Figure 6.2 documents the future three-month returns for both firms. International Rectifier Corp gains 46.9 percent and outperforms Alliance Pharmaceutical, which loses 24.7 percent over the next 3 months. Of course, we have cherry-picked this example to highlight that “smooth” high-momentum stocks tend to perform better relative to “choppy” high-momentum stocks. However, by the end of this chapter, we hope to convince the reader that momentum path dependency matters. This time-series aspect of momentum captures important information about market participant behavior that can be systematically exploited to improve upon a generic momentum strategy. To understand why, we examine the performance of “lottery-like” stocks, which have return characteristics that are similar to “jumpy” high-momentum stocks and placate the peculiar demand for “lottery” payoffs by many market participants.
THE PERFORMANCE OF LOTTERY STOCKS
Everyone loves a gamble, especially a long shot. And it's not just retirees who enjoy smoking cigarettes and pounding rum and cokes in front of the slot machine—no, sir. Heck, we've personally lost money gambling in Vegas and Atlantic City—and we're supposed to know better!
So what gives?
Nick Barberis, in his theory paper “A Model of Casino Gambling,” specifically addresses why people go to casinos and how they behave once they get there.2 Setting aside the known expected utility benefits of gambling (i.e., “it's fun”), the key assumption behind Barberis's theory is that there is something additional at play: Human beings suffer from an inability to properly weigh their chances of success for low-probability events. In other words, humans predictably overestimate their chances of winning the lottery.
But when we step outside of the casino and take a small leap over to the stock market, human behavior does not change. “Maxing Out: Stocks as Lotteries and the Cross-Section of Expected Returns” by Turan G. Bali, Nusret Cakici, and Robert F. Whitelaw examines how lottery-like stocks perform.3 Their central hypothesis is that investors irrationally overpay for lottery-like gambles, assume their odds are higher than they are in reality, and, thus, stocks with lottery-like characteristics will underperform on a risk-adjusted basis.
To test this hypothesis, Bali et al. first classify a subsample of stocks as “lottery” stocks if these stocks had extreme market movements in the recent past. Next, they examine the future performance of these lottery-like stocks. The underlying assumption is that investors identify stocks with extreme returns in the recent past as “lottery stocks” and bid these assets past fundamental value. The specific measure the authors look at to identify a lottery stock is to rank stocks based on the maximum daily return over the previous month (“MAX”).
An example can shed light on how the authors classify a stock as having lottery-like characteristics. Pretend it is January 31, 2017, and our universe consists of two stocks, Fast Money Inc. and Boring Money Inc. (Tickers: FAST and SLOW, respectively). We form a long/short portfolio on February 1 that exploits the fact that investors overpay for lotteries. We identify that FAST has a maximum daily return of 50 percent in the past month and SLOW has a maximum daily return of 1 percent. Therefore, our portfolio on February 1 will be short FAST (a lottery stock) and long SLOW (a non-lottery stock).
Table 6.1 summarizes the results from their paper highlighting the average monthly returns of 10 portfolios ranked on their MAX ranking, which is the maximum daily return over the past month. The top decile (“10”) represents “lottery” stocks and the bottom decile (“1”) reflects the “boring” stocks.
Table 6.1 Lottery Stock Results
| Avg. Monthly Return (VW Portfolio) | 4-Factor Alpha (VW Portfolio) | Average MAX | |
| Boring (1) | 1.01% | 0.05 | 1.30 |
| 2 | 1.00% | 0.00 | 2.47 |
| 3 | 1.00% | 0.04 | 3.26 |
| 4 | 1.11% | 0.16 | 4.06 |
| 5 | 1.02% | 0.09 | 4.93 |
| 6 | 1.16% | 0.15 | 5.97 |
| 7 | 1.00% | 0.03 | 7.27 |
| 8 | 0.86% | –0.21 | 9.07 |
| 9 | 0.52% | –0.49 | 12.09 |
| Lottery (10) | –0.02% | –1.13 | 23.60 |
| Long/Short (1–10) | 1.03% | 1.18 |
Not too shabby! A portfolio that buys boring stocks and shorts lottery stocks generates a raw return of 1.03 percent a month, or roughly 12 percent a year. Moreover, the four-factor alpha (which controls for market exposure, as well as known return drivers such as size, value, and momentum) is 1.18 percent a month, or 14.4 percent a year. We have not included the costs of implementation in these results, because that is beside the point. We are not trying to suggest this strategy as a practical approach to forming a portfolio, but merely to emphasize that market participants seem to misprice stocks with lottery-like characteristics.
Lottery bias may also help explain the so-called beta anomaly. Academic research has documented that low beta stocks tend to outperform high beta stocks.4 This finding is remarkable and is considered anomalous because a central prediction of theoretical asset pricing models is that stocks exposed to more market risk (i.e., high beta) should have higher expected returns than stocks with lower market risk (i.e., low beta). A working paper by Bali et al.5 examines the relationship between beta and lottery demand. Specifically, they try and understand how investor preferences for lotteries may explain the beta anomaly. We summarize some data from the Bali et al. paper and present the results in Table 6.2.
Table 6.2 Average Monthly Returns Sorting Stocks on Beta and the “Lottery” Ranking
| Low Beta Decile |
High Beta Decile |
|
| Boring (1) | 0.35% | 1.04% |
| 2 | 0.75% | 0.86% |
| 3 | 0.73% | 0.82% |
| 4 | 0.85% | 0.77% |
| 5 | 0.95% | 0.69% |
| 6 | 0.97% | 0.46% |
| 7 | 1.03% | 0.15% |
| 8 | 0.91% | 0.06% |
| 9 | 0.46% | –0.31% |
| Lottery (10) | –0.01% | –1.07% |
| Long/Short (1–10) | –0.36% | –2.11 |
| Long/Short Alpha (4-factor) | –0.83% | –2.14% |
Table 6.2 tabulates results associated with portfolios that sort stocks into 10 deciles based on beta, and then within each decile, sorts the portfolios based on their “lottery” ranking. We show the results to the top and bottom beta deciles for expositional purposes. On average, high beta stocks underperform relative to low beta stocks, which reflects the so-called “low beta anomaly.” But this average result is inconsistent across lottery ranking. Low beta boring stocks earn less than high beta boring stocks, which is in line with finance theory that suggests high beta stocks are riskier than low beta stocks and should therefore earn higher expected returns. The real anomalous results associated with the low beta effect are driven by stocks with lottery characteristics. The lottery characteristic is especially powerful among high beta stocks. For example, within the high beta decile, there is a monotonically decreasing relationship on the average returns as the “lottery” ranking increases. The authors explore this issue further and conduct testing to determine if lottery demand can explain why high beta stocks perform so poorly relative to low beta stocks. What they find is not too surprising, given what we know about the human mind: The lottery characteristic associated with high beta stocks is a key driver of these stocks' poor performance. (Lottery bias also goes a long way towards explaining the low beta anomaly, but this is a discussion for another day.)
But back to momentum strategies and why the research on lottery-like stocks is important. Based on the evidence discussed in the original “Maxing Out” paper, it appears investors are better off avoiding stocks with lottery characteristics. We should incorporate this knowledge into our algorithm when deciding which high-momentum stocks we want to purchase.6 And almost by design, high-momentum stocks with smoother momentum paths will be less prone to lottery bias mispricing than stocks with jumpier paths.
We should also consider the research, which relates lottery stocks to high beta stocks. As previously discussed, avoiding lottery-type stocks is a good idea, but what about the concept of avoiding high-beta stocks as well? To address that question we first need a quick refresher on beta. Beta is simply a measure of volatility, or systematic risk. And by design, high-momentum stocks with smoother price paths will generally have lower betas, while high-momentum stocks with choppier price paths will generally have higher betas. So to some degree, by focusing on momentum stocks with smoother price paths, we are avoiding an element of lottery bias, which afflicts many high flying generic momentum stocks.
What's the bottom line? Lottery bias plays a role in market mispricing. Stocks that are perceived as lotteries tend to do poorly because investors bid them past fundamental value. One can measure lottery bias by a variety of proxy metrics. We've discussed the MAX calculation and beta, and both of these measures are helpful in identifying stocks we should avoid. One could surely come up with many other permutations and find similar results. But when we step back and think about the big picture, really what we are trying to do is identify the nature of a stock's price path to glean information about market participant behaviors. We will see in the following section that the path to momentum profits is … the path.
THE PATH TO MOMENTUM PROFITS
Consider the story of putting a frog in water. If the frog is placed in a pot of boiling water, not surprisingly, the frog will immediately jump out. However, if the frog is placed in a pot of room temperature water, and this water is gradually heated to the boiling point, the frog will sit in the water until it is fully cooked. As least for our hypothetical frog, the path of water temperature changes clearly matters for the eventual outcome.
Interestingly enough, research has found that the frog's reaction to gradual water temperature changes is analogous to how investors react to gradual stock price changes. For example, if a stock has an immediate 100 percent gain (i.e., dropping the frog in a pot of boiling water), the strong price reaction immediately attracts investor attention, and the new stock price will typically reflect approximately fair value. However, if a stock gradually grinds along and achieves a 100 percent return (i.e., the water slowly heats up over time), investors will pay less attention to the gradual stock price movement and the security will likely be priced at less than fundamental value. In psychology terms, both the frog and human investors suffer from “limited attention,” which simply reflects the idea that our cognitive resources are limited and our brains will focus on processing the information that is most relevant or demanding at a given point in time. Determining what is “most relevant” turns out to be a challenging question. Psychology research, however, has found that dramatic changes in an environment, as opposed to small changes, attract more cognitive resources, all else being equal.7
In 2014, Zhi Da, Umit Gurun, and Mitch Warachka8 investigated the limited attention of investors to gradual-information diffusion. The authors hypothesize that there might be a relationship with the momentum anomaly. They describe their frog-in-the-pan hypothesis:
Their conclusions after conducting a battery of empirical analysis are fascinating: Momentum strategies that focus on optimizing the path-dependency of momentum generate a much stronger momentum effect. In other words, the evidence strongly supports the frog-in-the-pan hypothesis, and broadly supports the theoretical behavioral arguments outlined in the Barberis et al. 1998 paper, which suggests that the momentum anomaly is driven by an underreaction to marginally positive news.9
Da, Gurun, and Warachka construct a proxy for information discreteness (ID) that measures the relative frequency of small signals. A large ID means more discrete information, and a small ID denotes continuous information about small changes. For past winners with a high past return, a high percentage of positive returns (% positive > % negative) implies there are a large number of small positive returns. The exact measure is described by the equation:
To test their hypothesis Da et al. sequentially double-sort portfolios first on a 12-month formation-period returns, or what we refer to as “generic momentum” in previous chapters and further described in Jegadeesh and Titman.10 Next, they sort the stocks within these momentum portfolios on their information discreteness variable over the 1927 to 2007 sample period. We tabulate the most relevant results from the paper in Table 6.3, which examine the six-month holding period returns to portfolios that are long high momentum stocks and short low momentum stocks, while varying the information discreteness measure.
Table 6.3 Frog-in-the-pan Results to Long/Short Momentum Portfolios
| Discrete-Continuous Quintile | 6-Month Return | 3-Factor Alpha |
| Discrete | –2.07% | –2.01% |
| 2 | 0.64% | 3.53% |
| 3 | 3.12% | 5.05% |
| 4 | 4.36% | 6.71% |
| Continuous | 5.94% | 8.77% |
| Continuous–Discrete | 8.01% | 10.78% |
The results are astonishing. Over a six-month holding period, long-short momentum portfolios decrease monotonically from 5.94 percent for stocks with continuous information to negative 2.07 percent for stocks with discrete information. The three-factor alpha to long/short portfolios decreases from 8.77 percent for long/short portfolios with continuous information to negative 2.01 percent for long/short portfolios with discrete information—a spread of 10.78 percent (over 20 percent on an annualized basis) with a highly significant t-stat.
We know from prior analysis in Chapter 5 that higher frequency rebalancing translates into better performance for momentum strategies. The authors examine this question in their paper. Figure 6.3 shows the monthly alpha estimates to the long/short momentum portfolios (for both continuous and discrete information) from 1 to 10 months after portfolio formation. The results are consistent with the frog-in-the-pan hypothesis—continuous momentum seems to account for the bulk of the momentum effect. A few key points:
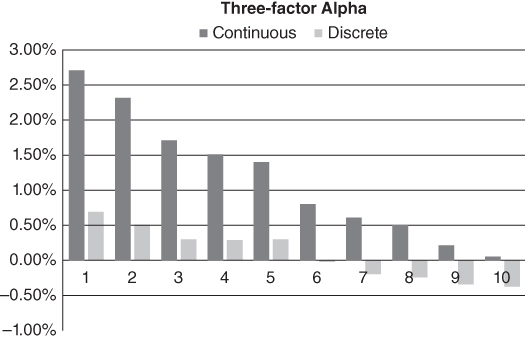
Figure 6.3 Frog-in-the-Pan Portfolio Alphas
- 1. Higher profits: Long/short momentum portfolios with continuous information have higher three-factor alphas than long/short momentum portfolios with discrete information.
- 2. Longer persistence: Long/short momentum profits following continuous information persist longer (the holding period can be extended with limited decay), while long/short momentum profits following discrete information are less persistent and more transitory.
Remarkably, by simply quantifying the nature of the path by which the high momentum status is achieved, the momentum anomaly can be vastly improved and focused on exploiting limited attention. Although this conclusion is not mentioned in the frog-in-the-pan paper, we also believe that the performance bonus of path-focused momentum algorithms is because of an indirect exploitation of the behavioral bias associated with lottery preferences by market participants (discussed in the previous section).
And while the authors do a meticulous job of documenting why limited attention may be a key insight in understanding the momentum anomaly, they are not the only authors to empirically investigate this concept. For example, a paper in 2000 by Hong, Lim, and Stein11 documents that momentum profits are larger for stocks with low analyst coverage and for small stocks. The authors argue that low analyst coverage and small-cap stock characteristics serve as a proxy for stocks that attract less attention, and therefore, are predicted to have higher momentum profits. The disposition effect, or the tendency to hold onto losing stocks too long and sell winning stocks too quickly, may also play a role in underreaction. This theory is described in 1985 by Shefrin and Statman12 and has been verified and explored in numerous empirical papers.13, 14
In addition, in our own tests we have found that splitting high momentum portfolios on other measures of attention, such as trading volume15 (more trading volume should cause more attention), yield similar results. Next we examine the results when incorporating the information discreteness measure for our universe of stocks.
THE RESULTS
In Chapter 5 we highlighted that generic momentum premiums decay over time, thus requiring a higher frequency rebalance (e.g., monthly rebalanced portfolios beat annually rebalanced portfolios). However, more rebalancing increases frictional costs. As a compromise, in this section we examine the results associated with quarterly rebalanced portfolios. We focus our analysis on overlapping quarterly rebalanced portfolios as described in Chapter 5. We only examine mid-cap and large-cap firms.16 Portfolios are formed by value-weighting the firms and the returns run from January 1, 1927, through December 31, 2014.17
In Table 6.4, we sort stocks based on their cumulative 12-month past returns (ignoring the most recent month), and buy a value-weighted basket of the top decile of stocks (“Generic Momentum” in column 3). We then split the portfolio of high generic momentum stocks into high-quality momentum (in column 1) and low-quality momentum (column 2). The momentum “quality” measure is the information discreteness measure, or frog-in-the-pan measure, described earlier in the Da, Gurun, and Waracha paper. Firms with higher-quality momentum are those with more continuous information, while firms with lower-quality momentum are those with more discrete information—to be perfectly clear, the portfolio of stocks in columns 3 is split in half by our information discreteness measure to create the portfolios in columns 1 and 2. The returns in Table 6.4 are gross of fees.
Table 6.4 Quality of Momentum Portfolio Annual Results
| High-Quality Momentum | Low-Quality Momentum | Generic Momentum | SP500 | |
| CAGR | 17.14% | 13.02% | 15.56% | 9.95% |
| Standard Deviation | 23.45% | 25.16% | 23.61% | 19.09% |
| Downside Deviation | 16.98% | 18.71% | 17.42% | 14.22% |
| Sharpe Ratio | 0.65 | 0.48 | 0.59 | 0.41 |
| Sortino Ratio (MAR |
0.81 | 0.56 | 0.71 | 0.45 |
| Worst Drawdown | –74.60% | –77.44% | –73.90% | –84.59% |
| Worst Month Return | –29.23% | –34.71% | –30.00% | –28.73% |
| Best Month Return | 30.63% | 37.15% | 33.88% | 41.65% |
| Profitable Months | 62.50% | 61.08% | 61.84% | 61.74% |
Using our own laboratory conditions, we replicate the nature of the findings from the Da, Gurun, and Waracha paper: Among high momentum stocks, those with higher quality, or “smooth,” momentum (measured via continuous information), show very strong relative performance. By contrast, low quality, or “jumpy,” momentum stocks still outperform the broad market, but show weaker performance. These results suggest that the generic momentum effect is driven by high-quality momentum and diluted by low-quality momentum. The spread between high-quality and low-quality momentum is large: over a multidecade time period (1927–2014) the spread between the high (column 1) and low (column 2) quality momentum portfolios is over 4 percent a year! This spread can be seen visually in Figure 6.4. The high-quality momentum portfolio also has better risk-adjusted returns (Sharpe and Sortino ratios) as well as lower drawdowns. While all the momentum strategies outperform the S&P 500 (before fees), our key takeaway is that an effective momentum strategy must consider the path by which stocks get their momentum.

Figure 6.4 Quality of Momentum Portfolio Returns
SUMMARY
The chapter began with a simple example of the performance of two stocks that were high “generic” momentum stocks during the Internet bubble. In our anecdote, we noticed that the firm with a “smoother” path toward high momentum status performed better in the future than the high momentum stock with “jumpy” momentum. Next, we explored two reasons why this anecdote may reflect a more systematic effect in the market. First, we examined how investors irrationally prefer lottery-like stocks, which have “jumpy” historical price paths. The evidence suggests that we should avoid these stocks because they tend to be overpriced. Second, we examined the “frog-in-the-pan” limited attention hypothesis presented by the authors, Da et al., which suggests that investors underreact to continuous information. To confirm their hypothesis, the authors provide evidence that high momentum stocks with smoother price paths to high momentum outperformed high momentum stocks with more volatile paths to high momentum. Our independent analysis of the Da et al. research corroborates their findings. The conclusion from the analysis is that the path by which momentum is achieved determines the effectiveness of the strategy—smoother paths are preferable to more volatile paths. This finding, that identifying “quality” momentum can help separate good high momentum stocks from bad high momentum stocks, can be explained via behavioral psychology:
- Avoid mispricing associated with lottery-like stocks.
- Exploit limited attention, which leads to systematic underreaction.