
CHAPTER 4
Why All Value Investors Need Momentum
“[Momentum] happens around the world, except Japan.”
—Eugene Fama, 2008 American Finance Association Interview1
“We find that momentum in Japan is actually a success.”
—Cliff Asness, 2011 Journal of Portfolio Management2
Despite its simplicity, as a stand-alone investment strategy generic momentum works well, but some might say it does not work everywhere. One example of a “failure” of momentum is in Japanese equities…more on this in a moment. But the broad consensus from academic researchers, who are arguably biased in favor of findings that support the efficient market hypothesis (EMH), is that the evidence supports the notion that momentum-based stock picking strategies have beaten the market, even after controlling for risk. In short, there is something special about momentum. Even Eugene Fama, famous for his incredible empirical work on efficient markets, suggested that momentum is the biggest embarrassment to the efficient market theory, or in his own words, momentum is the “premier anomaly.”3
MOMENTUM IS A MYTH
Nonetheless, the myth that momentum is “not real” continues to be widely disseminated. For example, in a classic 2008 interview at the American Finance Association, Richard Roll, a premier financial economist in his own right, interviewed Eugene Fama, the king of financial economists. Roll and Fama had a spirited discussion on the so-called value premium, which ended in a stalemate over whether the extra return associated with cheap stocks was compensation for extra risk or mispricing. Professor Roll then asked the “gotcha” question, about the momentum premium. Fama responded, begrudgingly, that momentum effects are pervasive in world stock markets, but he was quick to point out that Japanese stocks seemed to be immune to momentum effects. Roll responded in kind, and quipped that perhaps the Japanese investors were “more rational.” Fama, tongue in cheek, chuckled, and stated that he hoped that the poor results of momentum-based stock selection in Japan were the rule when it came to momentum results, and he hoped that the exceptions to the rule were simply a result of data dredging.4
ASNESS SEPARATES FACT FROM FICTION
But not everyone was happy with the high-level chatter among Roll and Fama. Cliff Asness, the founder of AQR, a University of Chicago finance PhD, and a former Fama student, was not interested in toeing the EMH party line. Perhaps Asness watched the interview between Fama and Roll, because a few years later in 2011, he published a paper in The Journal of Portfolio Management defiantly titled, “Momentum in Japan: The Exception that Proves the Rule.”
Asness's paper highlights a simple but sophisticated point related to momentum. On the one hand, if one looks at a generic Japanese momentum strategy in isolation, momentum appears ineffective. Asness, however, aptly points out that strategies need to be assessed in the context of a portfolio, so one can ascertain not only their stand-alone investment value, but also understand their potential diversification benefits for a portfolio. For example, if one assessed a strategy of continuously purchasing three-month put options on the stock market, the conclusion would be that the strategy has negative returns and a ton of volatility. These results, however, do not imply that put options are inefficiently priced, but this conclusion only becomes clear when we assess how put options act in the context of a portfolio. Viewed through a portfolio lens, put options provide incredible diversification benefits (i.e., insurance), and it becomes obvious why investors will gladly accept negative expected returns for a put buying strategy.
In contrast to puts, momentum-based stock selection strategies won't provide extreme insurance-like diversification benefits, but momentum strategies can pack a punch as it relates to overall diversification. For example, long-only momentum strategies are not perfectly correlated to the broad equity market, and they have low correlations with classic value strategies. These features make momentum strategies highly desirable in a portfolio context when they are pooled with value strategies.
Moving along this line of reasoning, Asness shows that Japanese investors, concerned about maximizing their portfolio's expected risk-adjusted return, would always invest a substantial amount of their portfolio in a momentum strategy. This demonstrates a great insight, and the paper makes the point clear. But the entire premise of the Asness paper is that we need to try hard to highlight how valuable momentum can be in Japan. A deeper investigation of the Asness results shows that his analysis focuses on Japanese long/short portfolios, which are not the typical sort of portfolio that many long-term investors would deploy. These long/short portfolios suffer because the short side of the momentum portfolio eats at the performance of the long-only momentum portfolio. Asness doesn't focus on long-only results, but we replicate and extend his analysis using more traditional long-only portfolios in Table 4.1. We show the results for the long-only Japanese momentum portfolio using AQR's data for this analysis.5 The Japanese index is represented by the MSCI Japan Total Return Index. The returns are from January 1, 1982, through December 31, 2014. All returns are total returns and include the reinvestment of distributions (e.g., dividends). Results are gross of fees.
Table 4.1 Japanese Equity Market Performance (1982–2014)
| Japan Momentum | Japan Index | |
| CAGR | 5.82% | 3.81% |
| Standard Deviation | 23.10% | 19.37% |
| Downside Deviation | 13.57% | 12.84% |
| Sharpe Ratio | 0.18 | 0.08 |
| Sortino Ratio (MAR |
0.24 | 0.05 |
| Worst Drawdown | –65.95% | –68.83% |
| Worst Month Return | –21.88% | –21.06% |
| Best Month Return | 22.99% | 19.97% |
| Profitable Months | 55.05% | 53.54% |
A long-only momentum portfolio clearly works, outperforming the index by a wide margin. This result is not entirely surprising, since momentum works in just about every context where researchers can get access to a reasonably long dataset. We understand why Asness focused on the long/short momentum portfolio for his research purposes, but this focus confuses investment audiences and muddies the issues. The reality is that generic long-only momentum does work in Japan. And yes, Asness brings up a great point that even in his context, investors should love long/short momentum exposures, especially when pooled with long/short value exposures.
We explore Asness's idea of combining value and momentum exposures in more depth throughout the rest of this chapter (with an emphasis on long-only results, not long/short). After being barraged with the facts, we think reasoned investors will agree: Investors benefit from momentum, and value investors, the investors least likely to accept momentum, stand to really benefit from momentum. And as the title of Asness's journal article highlights, a deeper analysis of momentum in Japan doesn't put a damper on momentum, it merely highlights its effectiveness.
EXPANDING YOUR HORIZONS WITH MOMENTUM
Modern portfolio theory, which outlines how an investor can mathematically compile a portfolio that will maximize expected returns for a given level of risk, and the most famous spinoff from the theory, the Capital Asset Pricing Model (i.e., CAPM), is best described by Fischer Black in the following way: “The [theory] is right. It just doesn't work.”6 The feel-good construct, which we teach to our finance students each year, is a great learning tool. Simply input a vector of expected returns and a covariance matrix associated with a set of assets or securities into your computer, and voilà, you have the so-called optimal portfolio weights that maximize one's expected return for a given level of risk. Like all things viewed with the benefit of hindsight, the lessons from modern portfolio theory seem simple. However, the underlying analysis behind the theory earned Harry Markowitz a Nobel Prize for his original paper on optimal portfolio selection.
Even though some academics and practitioners—including us—often rant about why one should be skeptical of complex portfolio optimization theories, the core ideas that underlie modern portfolio theory are critical for building successful investment programs. And that includes knowing when to adopt—and when to discard—certain ideas. The punch line, or core proposition, from modern portfolio theory is the so-called mean-variance (MV) frontier, often called the efficient frontier. The MV frontier takes the ingredients available—expected returns and the covariance matrixes across assets—and maps out all the best expected combinations of risk and reward an investor can achieve by shifting the weights among the assets under investigation. Think of the MV frontier as the best recipes available for an investor to maximize return and minimize risk, given the set of ingredients available.
As an illustration of modern portfolio theory put into practice, Figure 4.1 includes the historical returns and standard deviations associated with four portfolios from 1927 to 2014 using Ken French data for the value and momentum portfolios.7 These portfolios are described below:
Figure 4.1 Modern Portfolio Theory Chart (1927-2014)

- SP500 = SP500 Total Return Index
- VALUE = Top decile value-weight portfolio formed on book-to-market
- MOM = Top decile value-weight portfolio formed on 2-12 momentum
- LTR = Merrill Lynch 7–10 year Government Bond Index, spliced with data from Ibbotson's Stocks, Bonds, Bills, and Inflation Yearbook.
We map out the efficient frontier using historical values for expected returns and the covariance matrix. The results are gross of management fee and transaction costs and all returns are total returns and include the reinvestment of distributions (e.g., dividends). We impose short selling constraints such that no asset weights can be negative. For MV frontier purposes, in Figure 4.1 we only allow the optimizer to invest in the S&P 500 Index and Treasury bonds.
Over the 1927 to 2014 period, domestic equities (SP500) have relatively high expected returns and standard deviations, whereas domestic value equities (VALUE) and momentum equities (MOM) have high expected returns, but extremely high volatility. Long-term bonds (LTR) have the lowest standard deviation, but have relatively lower expected returns.
Modern portfolio “works” in the sense that an investor can combine generic stocks and bonds in a smart way and exploit the benefits of diversification. We can visualize this finding via the mean variance (MV) frontier (i.e., the dotted line), which highlights a “curve” in the line in the section between the long-bond-only portfolio and the S&P 500-only. This curve represents the benefit of diversification, which allows a portfolio to achieve a lower standard deviation for a given expected return.
In an ideal world, we could find portfolios that would expand the MV frontier and create opportunities with higher expected returns for a given level of risk. Perhaps counter-intuitively, adding highly volatile assets such as value and momentum, can expand the MV frontier, if the volatility associated with the portfolio being added is unrelated to the other assets already included in the portfolio.
We explore this concept further by allowing the mean variance optimizer to allocate across not only the S&P 500 and bonds, but also our two additional equity portfolios: value and momentum. Table 4.2 outlines the stand-alone characteristics of the passive and the generic value and momentum equity strategies from 1927 to 2014.
Table 4.2 Asset Class Historical Results (1927-2014)
| SP 500 | Value | Mom | LTR | |
| CAGR | 9.95% | 12.41% | 16.85% | 5.45% |
| Standard Deviation | 19.09% | 31.92% | 22.61% | 6.92% |
| Downside Deviation | 14.22% | 21.34% | 16.71% | 4.43% |
| Sharpe Ratio | 0.41 | 0.41 | 0.66 | 0.31 |
| Sortino Ratio (MAR |
0.45 | 0.54 | 0.79 | 0.12 |
| Worst Drawdown | –84.59% | –91.67% | –76.95% | –20.97% |
| Worst Month Return | –28.73% | –43.98% | –28.52% | –8.41% |
| Best Month Return | 41.65% | 98.65% | 28.88% | 15.23% |
| Profitable Months | 61.74% | 60.51% | 63.16% | 63.35% |
Do the returns associated with value and momentum provide enough benefit to offset their extreme volatility? To answer this question, Figure 4.2 shows how the MV frontier changes after adding momentum and adding value.

Figure 4.2 Modern Portfolio Theory with Momentum (1927-2014)
The results are surprising. When we allow the optimizer to allocate to value portfolios, we can expand the MV frontier. For a given level of risk, as measured by standard deviation on the x-axis, a portfolio that includes value offers a higher return. But if we also allocate to momentum, the frontier is greatly expanded. Note, again, that for a given standard deviation, the expected return is dramatically higher for portfolios that include both value and momentum. Notably, in this case the optimizer recommends a zero percent allocation to the passive index, highlighting that a portfolio with access to bonds and long-only value and momentum equity exposures captures all the benefits of a portfolio—and then some—that only has access to a passive equity index portfolio (e.g., S&P 500). Momentum and value greatly expand the investment opportunity set at every level of risk (as measured by standard deviation). This evidence suggests that investors, regardless of their risk tolerance, can increase their expected risk and reward trade-offs by replacing generic equity allocations with active momentum and value allocations.
MARRYING VALUE AND MOMENTUM
“… value and momentum are negatively correlated with each other, both within and across asset classes.”
—Asness, Moskowitz, and Pedersen8
Cliff Asness, Toby Moskowitz, and Lasse Pedersen published a remarkable paper in 2013 appropriately titled “Value and Momentum Everywhere.” The research highlights an interesting, but not entirely surprising, phenomenon— namely, that value and momentum premiums are literally everywhere:
- US stocks
- UK stocks
- European stocks
- Japanese stocks
- Currencies
- Fixed income
- Commodities
We update the analysis from the original research paper using their data and compile the results in Tables 4.3 and 4.4.9 We examine long only portfolio results for the four biggest equity markets—United States, United Kingdom, Europe, and Japan—from 1982 through 2014. Data are available for earlier periods on some markets, but for an apples-to-apples comparison, we conduct the analysis over the period when data are available for all markets.
Table 4.3 Momentum Performance (1982–2014)
| US Momentum | UK Momentum | Europe Momentum | Japan Momentum | |
| CAGR | 13.75% | 13.69% | 14.88% | 5.82% |
| Standard Deviation | 17.14% | 19.84% | 19.13% | 23.10% |
| Downside Deviation | 13.02% | 14.11% | 13.93% | 13.57% |
| Sharpe Ratio | 0.60 | 0.54 | 0.61 | 0.18 |
| Sortino Ratio (MAR |
0.73 | 0.70 | 0.77 | 0.24 |
| Worst Drawdown | –48.31% | –60.71% | –54.92% | –65.95% |
| Worst Month Return | –23.89% | –27.16% | –18.95% | –21.88% |
| Best Month Return | 17.65% | 16.44% | 18.56% | 22.99% |
| Profitable Months | 65.66% | 60.35% | 64.90% | 55.05% |
Table 4.4 Value Performance (1982–2014)
| US Value | UK Value | Europe Value | Japan Value | |
| CAGR | 12.79% | 12.59% | 15.09% | 11.11% |
| Standard Deviation | 15.55% | 20.02% | 19.27% | 21.67% |
| Downside Deviation | 11.88% | 12.87% | 14.06% | 11.91% |
| Sharpe Ratio | 0.59 | 0.49 | 0.62 | 0.40 |
| Sortino Ratio (MAR |
0.70 | 0.69 | 0.78 | 0.66 |
| Worst Drawdown | –49.80% | –54.65% | –55.30% | –41.35% |
| Worst Month Return | –18.45% | –21.02% | –21.78% | –15.34% |
| Best Month Return | 15.40% | 19.22% | 18.04% | 28.88% |
| Profitable Months | 66.16% | 58.08% | 64.65% | 55.05% |
First, the momentum results are tabulated in Table 4.3.
Next, the value results are tabulated in Table 4.4.
For some context, over the same time period the US stock index (S&P 500 Total Return Index) earned a CAGR of 11.96 percent, the UK stock index earned a CAGR of 9.60 percent, and the Japanese stock index returned a CAGR of 3.81 percent.10
When people observe something they cannot explain, they say, “It must be something in the water;” clearly, these results also suggest there is something in the water, when it comes to value and momentum. Value shows up in every equity market and momentum has strong performance in all markets. We think this finding is partially explained by increased risk, but it is also a manifestation of the sustainable active investing framework highlighted at the beginning of this book. Some of the excess returns associated with value and momentum are attributed to marketplace participants who are afflicted by behavioral bias, which creates mispricing opportunities. Those mispricing opportunities continue to exist in the data because the investment opportunities created by these strategies are hard to exploit via riskless arbitrage trading activity.
But the evidence that value and momentum work across a wide variety of assets and time periods is not entirely novel. What makes the Asness et al. paper unique, and what we alluded to via our quick modern portfolio theory lesson in the prior section, is that they explore the remarkable performance of using value and momentum together, as a system.
In Table 4.5 we look at why value and momentum work well as a system. The correlation matrix across global value and momentum equity portfolios is low for long-only portfolios.
Table 4.5 Correlation of Value and Momentum
| US Momentum | UK Momentum | Europe Momentum | Japan Momentum | |
| US Value | 71% | 56% | 57% | 26% |
| UK Value | 53% | 79% | 63% | 33% |
| Europe Value | 55% | 65% | 84% | 41% |
| Japan Value | 29% | 40% | 41% | 75% |
To highlight how the value and momentum system works, we look at combination portfolios that invest 50 percent in value and 50 percent in momentum, and rebalance the allocation monthly. The summary statistics for the value and momentum portfolios for the period 1982 to 2014 are tabulated in Table 4.6.
Table 4.6 Value and Momentum Combination Portfolios
| US | UK | Europe | Japan | Global V/M | |
| CAGR | 13.49% | 13.37% | 15.15% | 8.76% | 13.29% |
| Standard Deviation | 15.14% | 18.86% | 18.43% | 20.95% | 15.08% |
| Downside Deviation | 11.60% | 12.93% | 13.72% | 11.88% | 11.20% |
| Sharpe Ratio | 0.64 | 0.54 | 0.64 | 0.31 | 0.63 |
| Sortino Ratio (MAR |
0.77 | 0.73 | 0.79 | 0.47 | 0.78 |
| Worst Drawdown | –48.95% | –57.66% | –55.04% | –47.36% | –49.72% |
| Worst Month Return | –20.88% | –24.09% | –20.13% | –18.44% | –17.75% |
| Best Month Return | 13.32% | 16.74% | 15.62% | 25.24% | 11.83% |
| Profitable Months | 64.90% | 61.87% | 64.14% | 54.29% | 63.64% |
Risk-adjusted statistics are marginally improved across the board and the global value and momentum (designated as Global V/M) delivers. But summary statistics don't capture the extent to which one could “stick with the program.” For example, value investing looks great over the long haul, and there are some investors with the intestinal fortitude to hang on to a deep value strategy through a five-year stretch of underperformance, but this fortitude is unrealistic for most investors. And the same goes for momentum portfolios, which can sustain stomach-churning underperformance over extended time periods. Thankfully, we can combine value and momentum to reduce the torture associated with each of the strategies as a stand-alone investment approach.
To assess the ability of combination value and momentum portfolios to smooth the pain on the path to long-term expected performance, we examine the spread between 5-year compound annual growth rates for a specific strategy relative to its passive benchmark. We examine the combination portfolio, the momentum-only portfolio, and the value-only portfolio. The results are in Figures 4.3 through 4.7.

Figure 4.3 US Rolling Five-Year Spreads

Figure 4.4 UK Rolling Five-Year Spreads

Figure 4.5 Europe Rolling Five-Year Spreads

Figure 4.6 Japan Rolling Five-Year Spreads
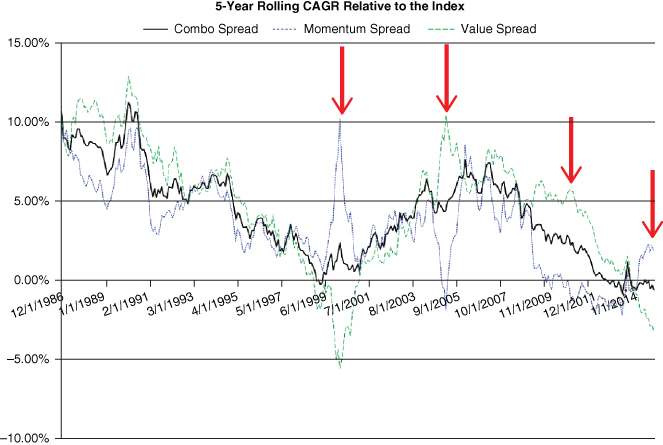
Figure 4.7 Global Rolling Five-Year Spreads
First, let's look at the United States (see Figure 4.3). These results are over the 1982 to 2014 time period and use the value and momentum portfolios identified in the Asness et al. paper. Value and momentum each have multiple stretches where they underperform the benchmark over five-year cycles. The combination portfolio suffers periods when it underperforms over a five-year cycle, but grinds a long-term edge most of the time as does the momentum portfolio.
Next we look at the United Kingdom over the same period as the US analysis (Figure 4.4). Value and momentum can underperform the benchmark over five-year cycles. However, the combination portfolio minimizes the pain along the way.
We look at Europe in Figure 4.5, which runs from 1999 to 2014, due to data limitations on the passive index. Similar to prior analysis, value and momentum combinations give the investor a smoother success rate over five-year cycles—especially in the most recent period analyzed.
We end with Japan (Figure 4.6), which runs from 1982 to 2014, where value investing is king and momentum investing plays second fiddle. Even in Japan, the combination portfolio exploits the natural yin and yang relationship between value and momentum to create a robust long-term active allocation.
Finally, we assess a global value and momentum portfolio and compare this portfolio to a global value portfolio, a global momentum portfolio, and a global index portfolio (Figure 4.7). The analysis runs from 1982 to 2014 and really highlights why value and momentum—working as a system—can give active investors a reasonable way to consistently beat passive benchmarks over longer horizons.11
The evidence suggests that a blended strategy, which combines both value and momentum into a single portfolio, may prevent a value-only investor or a momentum-only investor from suffering through extended, long-term stretches of poor performance. Of course, not all pain can be erased, and investors must always be aware that they will be required to endure sustained stretches of volatility and underperformance, even with a globally diversified value and momentum equity portfolio.
SUMMARY
In this chapter, we describe the benefits of marrying the value religion and the momentum religion. Each has its merits, but combining the two systems into a unified portfolio really highlights the benefits of value and momentum. We showed that value and momentum tend to have a low correlation across the globe and that creating a global value and momentum portfolio seems to provide a potential solution for long-term active investors to beat passive market-capitalization weighted indices over long periods of time. All of the analysis to date has been done with generic value and generic momentum exposures that are well established and understood in the academic literature. In the next section of the book, we'll carefully investigate how one might logically and empirically improve on the generic momentum strategy.