
Chapter 13
Optimizing Your Campaigns for Maximum ROI
IN THIS CHAPTER
![]() Optimizing your campaigns by running split tests
Optimizing your campaigns by running split tests
![]() Using the necessary tools for split testing
Using the necessary tools for split testing
![]() Knowing the pages to test and not to test
Knowing the pages to test and not to test
![]() Launching and understanding how a test performed
Launching and understanding how a test performed
![]() Analyzing a test
Analyzing a test
Imagine that you’ve built a web page designed to sell a Caribbean cruise. At the top of this page, you show a headline that reads “Save on Caribbean Cruise Deals! Nobody Beats Our Prices!” Your business partner approaches you with a couple of new headline ideas that she thinks will improve the number of cruise bookings. What should you do — trust her gut and make the change? Or stick with the original?
The correct answer is to test it. As we discuss in Chapter 12, a data-driven business goes beyond making marketing decisions based on hunches and guesswork. To truly maximize your campaign’s ROI (return on investment), you need to gather data and run tests to increase the impact. Otherwise, your actions are like throwing spaghetti at the wall and seeing what sticks — and they’ll be just as efficient and impactful to your bottom line.
In this chapter, we examine the dedicated, repeatable process of campaign optimization. Although this process is easy to overcomplicate, we break it into understandable parts and give you the outline you need to run a successful optimization campaign — from the required tools to the final test analysis.
Understanding Split Testing
The cornerstone of optimizing a website is split testing, which means to conduct controlled, randomized experiments with the goal of improving a website metric, such as clicks, opt-ins, or sales. Split testing takes two different forms: A/B testing, a technique in which two versions of a page can be compared for performance, and multivariate testing, a testing method in which a combination of variables is tested at one time.
During a split test, you split incoming website traffic between the original (control) page and different variations of the page. You then look for improvements in the goals you’re measuring (such as leads, sales, or engagement) to emerge so that you can determine which version performed best. You use split testing to test areas where you might be able to improve a measurable goal, such as your online checkout process. The test helps you try to determine what factors increase conversions, what factors deter conversions, and what can lead to an increase in orders.
Obtaining the tools you need to run split tests
To run split tests, you need effective tools. This section tells you about the technology you need to run split tests so that you can optimize your campaign for maximum results.
An analytics suite
To choose the right pages to test on your website, you rely heavily on your website analytics tool. This chapter focuses on Google Analytics, a website analytics solution made available by search engine giant Google. This tool measures website, app, digital, and offline data to gain customer insights. Google Analytics has two pricing tiers: free and premium. For most small and medium-sized businesses, the standard, free version of Google Analytics is more than sufficient. For an introduction to working with Google Analytics, see Chapter 12 or visit https://marketingplatform.google.com/about/analytics/.
Testing tech
Split tests require the technology that enables you to edit variations, split test variations, and track conversions. You can choose from among several services, including:
- Visual Website Optimizer: An easy-to-use split testing tool. It allows you to run A/B and multivariate testing to optimize your website for increased conversion rates and sales. This paid tool has several pricing packages to choose from for individuals to large agencies. Visit
https://vwo.com/to learn more. - Unbounce: Gives marketers the power to build, publish, and optimize and test landing pages. It has several pricing tiers to choose from for entrepreneurs and enterprise-level businesses alike. Find it at
https://unbounce.com/. - Optimizely: One of the world’s leading experimentation platforms for websites, mobile apps, and connected devices. Optimizely makes customer-experience optimization software for companies, which gives businesses the capability to conduct A/B and multivariate testing. The company offers three pricing tiers, and you can see them at
https://www.optimizely.com/.
 Make sure to integrate your testing tech tool with Google Analytics so that your Google Analytics reports reflect accurate data.
Test duration calculator
A test duration calculator is a simple calculator that determines how long you need to run your split test to get a reliable test result. You input data such as the existing conversion rate, the number of variations in the test, the amount of traffic your site gets, and more. The calculator then determines how many days to run this test to get a reliable result. Figure 13-1 shows the free test duration calculator offered by Visual Website Optimizer.
 Not every page on your website needs to be tested or requires optimization. In the next section, we discuss the ways for you to isolate the pages to test so you can maximize your return on investment (ROI).
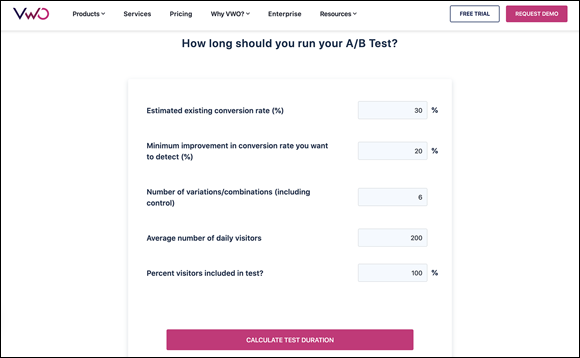
Source: https://vwo.com/tools/ab-test-duration-calculator/
FIGURE 13-1: A test duration calculator from Visual Website Optimizer.
Following the split test guidelines
When you’re looking for pages to split test, use the following guidelines to determine how worthy a page is to test. First, here’s what not to test:
- Your worst-performing pages (this sounds counter intuitive, but we explain why).
- Pages that don’t impact your longer-term business goals, for example, your 404 page.
- Pages that don’t get enough traffic to run a split test.
So why shouldn’t you test your worst-performing pages? When looking for pages to optimize, your job is to focus on opportunity pages, which are pages that will have the greatest impact on your goals. For instance, if you expect a 10 percent increase in conversions from your efforts, would you rather that lift be on a page converting at 50 percent or 5 percent? The one at 50 percent is an opportunity page.
Further, your worst-performing pages don’t need a testing campaign; rather, they need an overhaul. The ship is sinking, and you don’t have time to hypothesize over what to do next; you need to make a drastic change that likely doesn’t need to be tested. Remember, in such a case, don’t test; implement!
For the same reason that you don’t want to test the worst-performing pages, you also don’t need to test your nonconversion-oriented pages. These nonconverting pages include your About Us page or your “dead end” 404 page.
However, optimizing 404 pages has proven to be useful in marketing. Even on that page, you should include an offer, a call to action, or some additional steps to keep the user engaged. You don’t need to test adding these elements to the page, however; just add content that meets your goals and then move on to more important pages that impact conversion. Amazon’s 404 page, shown in Figure 13-2, directs people to the Amazon home page or suggests continuing to search.

Source: https://www.amazon.com/pizza
FIGURE 13-2: 404 pages, like Amazon’s, should offer users a next step but they don’t need to be split tested.
The final guideline you should follow when determining whether to split test a page is the page’s traffic. Look at the number of visits and of conversions that your page gets over the potential test period. Notice where traffic falls off considerably.
You can easily identify your pages and their traffic numbers using Google Analytics. Examine the number of Unique Pageviews for pages under consideration for split testing. The best report to employ for this job in Google Analytics is in the Behavior suite, which we detail in Chapter 12. In Google Analytics, navigate to the Reporting section and then select the following: Behavior ⇒ Site Content ⇒ All Pages. The All Pages report loads. From there, use the filter tool in Google Analytics to search for the specific pages you’re considering for a split test. Figure 13-3 shows an example of what an All Pages Report looks like from DigitalMarketer.
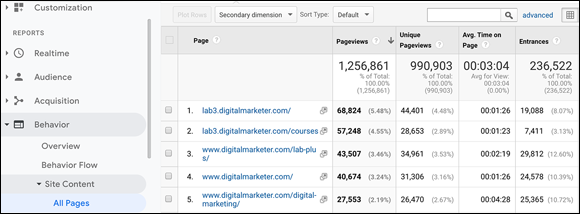
Source: https://analytics.google.com/analytics/web/
FIGURE 13-3: An All Pages Report from DigitalMarketer’s Google Analytics.
After you gather the data from the All Pages report, you should contextualize the pages. You’ll always see a massive drop-off in page views (the total number of pages viewed by a user; repeated views of a single page are counted) after your home page. However, your home page is so far away from your main converting action that it doesn’t make sense to test. Now, if you see a massive drop from a product page to the checkout page, you know that something is wrong with your product page and that you need to optimize it, and that merits a split test.
By following the guidelines in this section, you can hone in on pages worthy of your time and resources for testing. When you find a page that you consider to be test worthy based on the guidelines, make sure to ask these four questions:
- Does the page get enough unique visitors?
- Does the page get enough raw conversions?
- Does this page directly impact my goals? If indirect, how far away from the primary conversion action is the page?
- What’s the potential impact on your goal, such as for sales or leads?
Answering these four questions before you commit to testing a page accomplishes the following:
- Qualifies that the page is worth using resources to test.
- Gives you an idea of whether testing will actually be useful.
By determining which pages aren’t worth split testing, you can find the pages that merit testing.
Selecting Page Elements to Optimize
After you find the page you want to optimize and run a split test on, what’s your next step? What do you specifically test on that page? You have several factors to consider in determining the features you test on a page.
These elements will help you come up with the new versions, or variants, of your page to enter into the split test experiment. One way to start finding your variants is by using qualitative data, described next.
Considering qualitative data
Qualitative data is information that people can observe but not measure. In terms of digital marketing, qualitative data considers the users’ behavior. Gathering qualitative data is relatively easy and inexpensive, and it’s extremely helpful for picking the right elements to optimize on your page.
One of the most basic types of qualitative data involves click tracking, mouse movement, and scrolling. Much of this data gets reported in what is referred to as a heat map. A heat map is a visual representation of a user interacting on your site; it reveals where users focus on your site. Figure 13-4 shows a typical heat map.
Running a heat map on any page you’re split testing is a good idea. Most good testing technology tools, such as Visual Website Optimizer, include heat map technology. Heat and scroll map reports can shed light on whether a call to action (CTA) is getting clicks, or whether people are consuming your content.
Here are other types of qualitative data and how to collect it:
- User surveys: Use a tool such as TruConversion (
https://www.truconversion.com/) to survey your site visitors and get qualitative data to analyze. - Session recordings: Also use TruConversion to record visitor sessions and analyze those recording to find elements to test on the page.
- Customer service questions: Any team members who talk to customers are often a treasure trove of qualitative data.

FIGURE 13-4: A heat map shows user interaction with your page.
Using qualitative tools
Qualitative data is incredibly important and severely underused. Some great tools are available, so start with one and move on to others when you run into user knowledge gaps. These tools can include:
- TruConversion (
https://www.truconversion.com/): This suite of tools has heat maps, session recordings, user surveys, funnel analysis, and form-field analysis. - Crazy Egg (
https://www.crazyegg.com/): Focuses primarily on heat maps, tracking clicks, mouse movement, and scrolling. - UsabilityHub (
https://usabilityhub.com/): This site helps test design and uncover design issues with user tests such as:- Preference tests
- Five-second tests
- Click tests
- Design surveys
UsabilityHub’s five-second test, and ones like it, are extremely powerful. The five-second test measures people’s first impressions of your site. If people can’t figure out who you are and what they’re supposed to do on your site within five seconds, you need to rethink your page.
Getting Ready to Test
After you determine what pages to test and select the appropriate variants, you’re well on your way to implementing your test. You still have several other elements to keep in mind before you start your test, however. Pay attention to these components, described in the following sections, to create a strong split test.
Developing an optimization hypothesis
Your test needs a hypothesis. For your test to truly be meaningful and actionable, you need to come up with a plan, and you need to document statistics. Testing for the sake of testing or for a particular hunch only wastes your business’s time and resources. A clear hypothesis puts a stop to ad hoc testing.
Create a hypothesis based on this format:
Because we observed [A] and feedback [B], we believe that changing [C] for visitors [D] will make [E] happen. We’ll know this when we see [F] and obtain [G].
Following a basic hypothesis format like the preceding one sets your test’s scope, the segment, and the success criteria. Without a hypothesis, you’re guessing, and you don’t want to base a campaign’s success or failure on a guess.
Choosing the metrics to track
After you choose a page to split test and the variations you will be testing on the page, you need to determine the key performance indicators (KPIs) that you will use to evaluate your split test. KPIs are metrics that gauge crucial factors and help you to determine the success of a test. For instance, if you run a test that looks only at top funnel metrics, such as clicks, you don’t get a full understanding of the actual impact. For this reason, you need to select your KPIs and know how they impact your business goals.
To help define your KPIs, make sure to have page-level goals as well as campaign-level goals for all your tests. Your split test goals might look like this:
- Page goal: Leads generated
- Campaign goal: Specific product purchased
Page and campaign goals give you the short view, that is, what happened on the page; and the long view, that is, how what happened on the page impacted your overall campaign. It is possible to see an improvement in the performance at the page level while experiencing a decrease in performance at the campaign level. In our preceding example, we may run a test that generates more leads at the page level but actually decreases the number of products purchased at the campaign level.
Keep a common thread throughout your KPIs and have them measure related metrics, such as add-to-cart rate and sales.
Calculating your test timeline
Every test needs a definitive stopping point. If you test into perpetuity, you ignore the possibility that no change occurs between variants. You need to create a clearly defined test time period before you start testing, and then stick to that time table.
Use your duration calculator, mentioned in the “Obtaining the tools you need to run split tests” section, earlier in this chapter, and round up to the next week. For example, if your duration calculator says that you would have meaningful results in ten days, run the test for fourteen. People behave differently on different days, and you must account for this variance in behavior. This little trick will help you gather more complete data.
Preparing to Launch
When you have your hypothesis, your variations, your KPIs, and your test schedule outlined, you’re almost ready to begin your split test. Complete the following steps to take in preparation for your test and then you’ll be ready to click the Start button in your testing tool!
Defining goals in Google Analytics
Just having Google Analytics on your site isn’t enough; you need to establish your goals. (See Chapter 12 for how to set up goals in Google Analytics.) Setting custom events or e-commerce tracking works as well — you just need something to measure.
Having a measureable goal is important because when you have proper e-commerce or goal reporting in Google Analytics, the results of your testing are determined by objective numbers rather than subjective opinion. Having goals set up in Google Analytics is incredibly powerful and will start to show you the efficacy of your campaigns in a single platform.
Checking that your page renders correctly in all browsers
If a page isn’t performing properly, it will corrupt the data. You may think that the variation you are testing has failed because your hypothesis was incorrect, but in truth, it might be a tech issue. For instance, if one of the pages you are testing is showing a broken image, the conversion lift (or failure) for that page is not caused by the changed variable but rather by the page’s functionality, in which case your test will be for naught. Before you launch your test, double-check your page for bugs by using tools such as BrowserStack or preview options in Visual Website Optimizer.
Ensuring that you have no testing conflicts
You don’t want your tests to overlap. Therefore, you should never run multiple tests on the same page at the same time; for instance, running a second, separate test on a page while another test is already being performed on the same page results in conflicting data.
You can run tests on different pages at the same time. However, when running tests on different pages at the same time, you need to make sure that traffic included in one test isn’t included in the other.
Checking links
Just as you need to ensure that your page is functioning, you also have to make sure that your links actually work and go to the right page. A split test between a page with links and a page without properly functioning links is obviously a fatally flawed test that won’t give you true results.
Keeping variation load times similar or identical
Keep your load time in mind when you optimize. If you have a variant with a better load time, that variant will likely beat out its competition, skewing your results. Use tools such as PageSpeed (https://developers.google.com/speed) to analyze and ensure that your variant load times are as close as they can be.
Calling a Test
As we state earlier, you don’t want a test to run indefinitely. You need to set a testing timeline and stick to it so that you can analyze the data and make informed decisions. Here’s when you know you can call your test:
- Your test timeline matches your schedule: Make sure to actually run your test for the time you scheduled it for. Do not call a test early because it “looks good” and gives you favorable data. Likewise, don’t string out a test longer because you didn’t get the results you wanted. When you hit your scheduled end date, call the test.
- You’ve ”completed the week”: Unless otherwise specified by your test duration calculator, your test should run for a full seven days before calling it. In other words, a test that starts on a Tuesday must end on a future Tuesday to ensure that you’ve collected the minimum amount of data to make informed decisions.
Knowing How a Test Performed
For some tests, the data may overwhelmingly conclude that the variation you tested was a winner or a dud. But if you have trouble determining how a variation performed, follow these guidelines:
- Your variation indicates it is successful and you should consider implementing it if
- Your lift is statistically significant.
- You show at least 100 conversions, or more, per variation.
- Your variation indicates it is a failure and you shouldn’t consider implementing it if
- Your loss is statistically significant.
- You show fewer than 100 conversions per variation.
- Your variation comes out null if
- No statistically significant difference emerges.
- The numbers have normalized.
- The test ran for the entire test schedule.
Analyzing the Test
By now you either have a successful, a failed, or a null test result. After you’ve concluded the test, you can dig into the data to analyze what happened during the test period and determine your next steps. To analyze your split-testing data, follow these steps:
-
Report all your findings.
Collect and put your testing data into words. You can use a test report sheet or PowerPoint deck for this. Considering breaking your report into the following sections:
- Slide 1: Test title, URL, timeline, and metric(s) measured
- Slide 2: Hypothesis
- Slide 3: All the variants you tested
- Slide 4: In-depth results
- Slide 5: Results showcasing the winning variant, conversion lift, and confidence rate
- Slide 6: Analysis
- Slide 7: Other observations
- Slide 8: Recommendations
-
Report your conversion range.
The conversion range is the range between the lowest highest possible conversion rate. This range may be written in the form of a formula, as in 30% lift ± 3%, or you might say that you expect conversions to be between 27 and 33 percent. Be sure to report your conversion rate as a range. When you report a 40 percent conversion lift, but you really have a range of 35–43 percent, you’re doing yourself a disservice by not properly setting expectations for your results or your recommendations.
Don’t let your boss or client think that the conversion rate is static. It isn’t. Set proper expectations by reporting on your conversion rate as a range. Tools such as Visual Website Optimizer create this range for you.
-
Look at each variant’s heat map.
Observing each variant’s heat map helps you find new things to optimize and test. Place these finding in the “Other Observations” section of your report.
-
Analyze key segments in Google Analytics.
Here, you’re determining whether the test indicates a higher or lower conversion rate for certain types of visitors.
-
Implement the successful variation.
Ideally, thanks to the results of your split testing, you know what works. Now you can put that knowledge to work. Use your data to make educated decisions about what changes you should make on the page.
-
If the result of the split test was null, pick your preferred variation.
At this point, if your test has declared no winner from either variation, you can choose which one you’d like to implement. Use this data to develop a new hypothesis and create a new test.
-
Use your findings to create new hypotheses and plan future tests.
Optimization is a process. Your latest findings should feed into your future work. Here is where you can learn from segments, heat maps, or the test proper to develop your next iteration or fuel a test on a new page.
-
Share your findings.
At the very least, you should send your report over to your boss or client, and to your colleagues who have a stake in the test. If you want to go above and beyond, you could even publish your findings as your own primary research. Case studies are valuable resources that can establish you as an authority in the market and also generate leads within your market. Turn to Chapters 3, 4, and 6 for more on the value of primary research and how to implement it.