
2
An Analytical Review of Deep Learning Algorithms for Stress Prediction in Teaching Professionals
Ruby Bhatt
Department of Computer Science, Medicaps University, Indore, India
Abstract
Latest statistical figures on human health show that hypertension, cardiac disease, renal failure etc. along with all sorts of popular diseases are overpassed by mental illness. The graph for mental health shows an exponential increase. It shows that 51% of adults who felt stressed resulted in depression, 61% reported feeling anxious, a big group of teenagers said that they had suicidal thoughts and feelings etc. Seeing a present scenario, mental illness, stress, depression etc. has become a fundamental and inescapable part of our lives. It has created a distressing situation for the psychological health of teenagers and youth internationally. At the dangerous stage of teenage to adulthood transition, many challenges are faced by teenagers. These may be because of the excessive exposure to social networking sites and devices. Hence, it is a need of an hour to know about the various aspects that can be the source of stress among teenagers, working professionals, homemakers, actually every person of the society; knowing the reasons, recognizing the factors that are more substantial reasons and to take appropriate measures to handle up the worst situation excellently. This chapter is a small step towards analyzing the stress among teaching professionals using deep learning algorithms.
Keywords: Deep learning, deep neural network, environmental stress, physiological stressor
2.1 Introduction
The health of masses and living conditions of many all over the globe is directly affected by the coronavirus pandemic. The biggest impact of this infection that resulted worldwide is in the form of various types of mental illnesses. There are different sources of stress like external stress, environmental stress, and physical stress [1]. The external stress occurs because of the environmental stressor when the person is unable to respond to the external and internal stimulus or situation. Even the environment disorder, big gatherings, heavy traffic, a high number of crimes in the societies, pollution can be the cause for external stress. Every individual lives in a society and interact with many people in their day to day life. This can lead to social stress. The external stressor can become the source of stress an individual’s life which includes- hot and cold climate, natural disasters, criminal offenses, contamination, and death. These kinds of stressors happen to the earth and humans have no control over these kinds of stressors. Every individual suffers from a different kind of stressful situation in their lives may be because of Physiological Stressor. Every individual also plays a social role in their lives by playing multiple characters with different people. Each person does their jobs to live in a society and with family, such as brother, parents, friends, boss, life partners, and many more social roles they play.
Deep Learning Algorithms are now a days playing crucial role in training machines to behave like a human mind [5]. To drive such a human-like ability to adapt and learn and to function accordingly, there have to be some strong forces which we popularly called algorithms. Deep learning algorithms are dynamically made to run through several layers of neural networks, which are nothing but a set of decision-making networks that are pre-trained to serve a task. Later, each of these is passed through simple layered representations and move on to the next layer. However, most machine learning is trained to work fairly well on datasets that have to deal with hundreds of features or columns. For a data set to be structured or unstructured, machine learning tends to fail mostly because they fail to recognize a simple image having a dimension of 800 × 1000 in RGB. It becomes quite unfeasible for a traditional machine learning algorithm to handle such depths. This is where deep learning.
It is a very important data science element that channels its modeling based on data-driven techniques under predictive modeling and statistics. This is one of the main reasons deep learning is not considered effective as linear or boosted tree models. Simple models aim to churn out custom data, track fraudulent transactions, and deal with less complex datasets with fewer features [9]. Also, there are various cases like multiclass classification where deep learning can be effective because it involves smaller but more structured datasets but is not preferred usually.
The various types of algorithms used in Deep Learning are [7]:
- Convolutional Neural Networks (CNNs) [7]: ConvNets majorly consists of several layers and are specifically used for image processing and detection of objects.
- Long Short Term Memory Networks (LSTMs) [7]: It can memorize and recall past data for a greater period and by default, it is its sole behavior.
- Recurrent Neural Networks (RNNs): RNNs consist of some directed connections that form a cycle that allow the input provided from the LSTMs to be used as input in the current phase of RNNs.
- Generative Adversarial Networks (GANs) [7]: GANs are defined as deep learning algorithms that are used to generate new instances of data that match the training data. GAN usually consists of two components namely a generator that learns to generate false data and a discriminator that adapts itself by learning from this false data.
- Radial Basis Function Networks (RBFNs) [7]: RBFNs are specific types of neural networks that follow a feed-forward approach and make use of radial functions as activation functions. They consist of three layers namely the input layer, hidden layer, and output layer which are mostly used for time-series prediction, regression testing, and classification.
- Multilayer Perceptrons (MLPs) [7]: MLPs are the base of deep learning technology. It belongs to a class of feed-forward neural networks having various layers of perceptrons.
- Self-Organizing Maps (SOMs): SOMs help in visualizing the data by initializing weights of different nodes and then choose random vectors from the given training data. They examine each node to find the relative weights so that dependencies can be understood. The winning node is decided and that is called Best Matching Unit (BMU).
- Deep Belief Networks (DBNs) [7]: DBNs are called generative models because they have various layers of latent as well as stochastic variables.
- Restricted Boltzmann Machines (RBMs): This algorithm is mainly used in the field of dimension reduction, regression and classification, topic modeling and are considered the building blocks of DBNs.
- Autoencoders [7]: Autoencoders are a special type of neural network where inputs are outputs are found usually identical. It was designed to primarily solve the problems related to unsupervised learning. Autoencoders are highly trained neural networks that replicate the data.
2.2 Literature Review
In this chapter [1], the authors used a performance parameter to find true positive rate, false positive rate, recall, and F-Score. Different types of Machine Learning technique were applied to predict the stress level of the students. With the help of questionnaires dataset, student’s different circumstances and conditions were recognized. With the help of these, the proposed model included PSS and adult Adha questionnaires dataset collection, pre-processing, cleaning, feature extraction and comparison on the basis of their performance parameter.
In [2], the authors used a decision tree algorithm which was then applied to the data which was collected from the two tests to say that these tests are unsatisfactory: the stress level among the students at the starting of the term or semester and the end of the semester. The study reveals that the level of stress among students at the starting of the semester was less and at the end of the semester the level of stress is increased.
In [3], the research introduces a novel self-supervised deep learning model for stress detection using an intelligent solution that detects the stress state using the physiological parameters. It represents a concise review of different intelligent techniques for processing physiological data and the emotional states of humans. Also, for all covered methods, special attention is made to semi-supervised learning algorithms. Lastly, a novel semi-supervised deep learning model for predicting the stress state is proposed.
In this paper [4], predictions of anxiety, depression, and stress were made using machine learning algorithms. In order to apply these algorithms, data were collected from employed and unemployed individuals across different cultures and communities through the Depression, Anxiety, and Stress Scale questionnaire. It was named – DASS 21. Anxiety, depression and stress were predicted as occurring on five levels of severity by five different machine learning algorithms – because these are highly accurate, they are particularly suited to predicting psychological problems. After applying the different methods, it was found that classes were imbalanced in the confusion matrix. Thus, the f1 score measure was added, which helped identify the best accuracy model among the five applied algorithms as the Random Forest classifier. Furthermore, the specificity parameter revealed that the algorithms were also especially sensitive to negative results.
Reece et al. [4] focused on the predictors of depression and Post Traumatic Stress Disorder (PTSD) among Twitter users. The Hidden Markov Model (HMM) was used to recognize increases in the probability of PTSD. Of the entire dataset, 31.4% and 24% were observed to be affected by depression and PTSD.
Braithwaite et al. [10] collected tweets from 135 participants recruited from Amazon Mechanical Turk (MTurk) and applied decision tree classification to measure suicide risk. The accuracy level for the prediction of suicide rate was observed to be 92%.
Du et al. [4] extracted streaming data from Twitter and used psychiatric stressors to annotate tweets that had been deemed suicidal. The Convolution Neural Network (CNN) outperformed the Support Vector Machine (SVM) and extra trees (ET) etc. with a precision of 78% in recognizing tweets with suicidal tendencies. The audio-text approach can also be used to model depression, where the researcher collects data from individuals with depression. The long short-term memory neural network model was used for detecting depression in [4], which observed that the context-free model produced the best results for audio (weighted, sequence and multi-model).
Depression was also predicted in [4] in the early stages through social media content. Data collection was carried out using CLEF eRisk. After evaluating five systems, it was discovered that a combination of machine learning and information retrieval gave the optimum result.
In Hou et al. [4], a big data approach was used to predict depression based on a person’s reading habits. The features of Chinese text were extracted in order to develop a book classifier and after applying five classifications, naïve Bayes was found to be the most appropriate [4].
2.3 Dataset Pre-Processing
One questionnaires dataset was taken from more than 20 teaching professionals of the University. Data set were collected through a primary and secondary source like mails on Gmail, data shared through Google drive, Google Survey Form etc. PSS Scale was used on the collected dataset. The different types of questions on the PSS scales were related to mood burst, uncontrolled emotions, joyous feelings etc. The dataset was collected for PSS, a test which incorporates various inquiries by large including the whole enthusiastic inquiry.
This type of questions has three option answers like (a) Happens Many Times (b) Does Not Happen and (c) Cannot Comment.
Every selection has its points for calculation of stress. It was asked from by straightforward questions about their moods, sentiment, and the current states that they might have come across in the last few months and their response to it. The stress divided into basically three categories like regular, modest, and highest. The found dataset is converted into numeric data [3]. The dataset is then split into training and testing data.
PSS Scale [1]: The Perceived Stress Scale (PSS) is a stress pressure assessment instrument. This was established by a physiological researcher by Sheldon Cohen in 1983. [1] This scaled show presents about your emotions, feelings during the previous many month and present [1].
Adult Adha Self-Report Scale: Adult Adha is a self- report scale is known as a stress assessment instrument. There are different types of questions ask on this scale which is related to emotions, feelings, history, during previous many month and present [1].
Weka [1]: It is an Open Source Data Mining programming included as part inside Pentaho that gives techniques to pre-handling content, It is very helpful for mining of various opinions of people, so it is highly used in the opinion mining field also used for other areas, for example, drawing data from a database and perusing CSV records, and a lot of programmed learning calculations.
2.4 Machine Learning Techniques Used
Machine learning is one of the domains of Artificial Intelligence that provides computers and computing systems the ability to independently learn and improve from previous experience without being explicitly programmed by a human. Machine learning is based on the development of computing programs that can retrieve data and learn for themselves.
This is highly effective in healthcare as there is enormous amount of data and if this is properly fed to an intelligent system and trained accordingly, the resulting prediction model will be unparalleled and free from human errors and reduce the time required for diagnostics. Hence, the responses of the dataset that were used to train the following study are tested in healthcare based classification problems [6].
- Logistic Regression [6]: Like all regression methods, the logistic regression is a predictive analysis. It is used in scenarios where one binary variable is dependent on one or more independent variables. Here, we take the 14 relevant attributes to be independent variables and the possibility of an employee having stress and needing treatment as the dependent variable which is to be predicted by the trained model.
- KNN Classifier [6]: K-Nearest Neighbor (KNN) classifier is a supervised learning algorithm that can be implemented on labeled data. It was used here for predicting if a person needs treatment or not. KNN classifies the dependent variable based on how similar its independent variables are to a similar instance from the already know data.
- Decision Trees [6]: A decision tree can be used to model multiple choices or if-else statements/decisions in a tree-like fashion. Here, decision trees are used to find the most contributing factors among the 14 features that are used. This is highly helpful, as now more attention can be given to these areas and necessary steps are taken on those lines.
- Random Forest Classifier [6]: Random Forests are a cluster of decision trees working together with each other and it has proved to be more effective than a single decision tree. Random Forest is a flexible, easy to use ML algorithm that produces a good result persistently, even without hyper tuning.
- Boosting [6]: We also implemented ensembled methods that augment the performance of existing models. Boosting is a highly effective and commonly used ensemble classifier. The main motive for boosting is to reduce bias in the model.
- Bagging [6]: Another effective ensemble method is, Bootstrap Aggregating (or bagging). It involves training of a model using the same algorithm but on different subsets of data from the dataset. This not only helps in improving the stability and accuracy of the model but also in reducing the variance of the model.
2.5 Performance Parameter
In this research we are using different types of parameters are:-
True Positive Rate [1]: It is also known as Sensitivity (TP) [8]. It calculates the values which are correctly classified the accuracy and formula is:-
False Positive: It is also known as Specificity [1]. It calculates the values which are incorrectly classified as true and formula is:-
Recall: Normally, we can use recall for wholeness what percentage of positive tuple did the classifier label as positive. In recall 1.0 is best Score. In others Words we can say that Inverse connection between recall and precision.
F-Score [1]: F-score is also known as F – measure. It is used to calculate by detecting out the harmonic mean of recall and precision and formula is:-
MCC [1]: MCC is known as Matthews’s correlation [1] coefficient. It is used in machine learning technique and used to measure the quality of binary (two-class) classifications. It generally gives the value between + 1 and −1.
Precision: Precision compares the quantity of effective magnificence predictions that truly belong to the high quality elegance [1]. Formula is-:
Classification Accuracy: It is a measure of the effectiveness of the classification model. Classification accuracy is the percentage of successful predictions out of the total predictions made. It can be used as a rank of performance among different models.
2.6 Proposed Methodology
In this chapter, different types of Machine Learning technique are used to predict the stress level of the faculty members. In the questionnaires dataset, the faculty data in different ways, circumstances, and conditions are evaluated. This includes PSS and adult Adha questionnaires dataset collection, pre-processing, cleaning, feature extraction [3] and comparison on the basis of their performance parameter as shown in Figure 2.1.
The raw data is collected from questionnaires and other datasets, it is the faculty data in different ways. But, the main intension behind collection of data remains the same for more and more accuracy and acquainted data. The raw data becomes useful only after cleaning and preprocessing. Cleansing of data is done to extract meaningful information out of it. Data cleansing is the process of identifying and resolving corrupt, inaccurate, or irrelevant data. This critical stage of data processing — also referred to as data scrubbing or data cleaning — boosts the consistency, reliability, and value of your company’s data. Common inaccuracies in data include missing values, misplaced entries, and typographical errors. In some cases, data cleansing requires certain values to be filled in or corrected, while in other instances, the values will need to be removed altogether. The dataset is given to many cleansing algorithms for better preparation of meaningful information out of it. Use Data Cleansing to fix common data quality issues. You can replace null values, remove punctuation, modify capitalization, and more! The Data Cleansing tool is not dynamic. Few of these tools are free, while others may be priced with free trial available on their website. OpenRefine: Formerly known as Google Refine, this powerful tool comes handy for dealing with messy data, cleaning and transforming it. It’s a good solution for those looking for free and open source data cleansing tools and software programs. The consequence of extracting data can be that it can have loss of some meaningful information out of it. Efficiency, especially if you’re planning to execute the extraction manually. Hand-coding can be a painstaking process that is prone to errors and difficult to replicate across multiple extractions. When the raw data is in the raw format, no pattern can be interpreted out of it. So, in order to extract meaningful pattern out of the raw data, data is extracted using different Classifiers and Comparison operators. They are then interpreted and the meaningful information is extracted out of it.
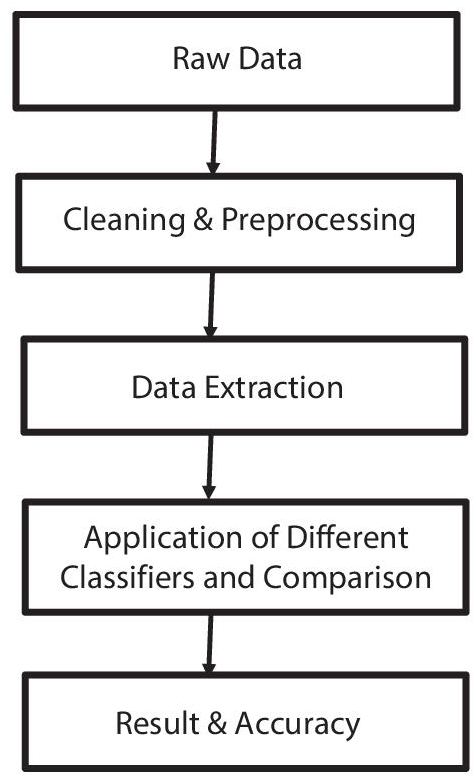
Figure 2.1 Process of data extraction from dataset.
A decision is only as good as the data that informs it. And with massive amounts of data streaming in from multiple sources, a data cleansing tool is more important than ever for ensuring accuracy of information, process efficiency, and driving your company’s competitive edge. Some of the primary benefits of data scrubbing include:
- Improved Decision Making — Data quality is critical because it directly affects your company’s ability to make sound decisions and calculate effective strategies. No company can afford wasting time and energy correcting errors brought about by dirty data.
- Consider a business that relies on customer-generated data to develop each new generation of its online and mobile ordering systems, such as AnyWare from Domino’s Pizza. Without a data cleansing program, changes and revisions to the app may not be based on precise or accurate information. As a result, the new version of the app may miss its target and fail to meet customer needs or expectations.
- Boosted Efficiency — Utilizing clean data isn’t just beneficial for your company’s external needs — it can also improve in-house efficiency and productivity. When information is cleaned properly, it reveals valuable insights into internal needs and processes. For example, a company may use data to track employee productivity or job satisfaction in an effort to predict and reduce turnover. Cleansing data from performance reviews, employee feedback, and other related HR documents may help quickly identify employees who are at a higher risk of attrition.
- Competitive Edge — The better a company meets its customers’ needs, the faster it will rise above its competitors. A data cleansing tool helps provide reliable, complete insights so that you can identify evolving customer needs and stay on top of emerging trends. Data cleansing can produce faster response rates, generate quality leads, and improve the customer experience. A data cleansing tool can automate most aspects of a company’s overall data cleansing program, but a tool is only one part of an ongoing, long-term solution to data cleaning. The steps needed to take to make sure data is clean and usable:
- Identify the Critical Data Fields — Companies have access to more data now than ever before, but not all of it is equally useful. The first step in data cleansing is to determine which types of data or data fields are critical for a given project or process.
- Collect the Data — After the relevant data fields are identified, the data they contain is collected, sorted, and organized.
- Discard Duplicate Values — After the data has been collected, the process of resolving inaccuracies begins. Duplicate values are identified and removed.
- Resolve Empty Values — Data cleansing tools search each field for missing values, and can then fill in those values to create a complete data set and avoid gaps in information.
- Standardize the Cleansing Process — For a data cleansing process to be effective, it should be standardized so that it can be easily replicated for consistency. In order to do so, it’s important to determine which data is used most often, when it will be needed, and who will be responsible for maintaining the process. Finally, you’ll need to determine how often you’ll need to scrub your data. Daily? Weekly? Monthly?
- Review, Adapt, Repeat — Set time aside each week or month to review the data cleansing process. What has been working well? Where is there room for improvement? Are there any obvious glitches or bugs that seem to be occurring? Include members of different teams who are affected by data cleansing in the conversation for a well-rounded account of your company’s process.
Data Extraction retrieves and extracts data from various sources for data processing and analyzing purposes. The extracted data may be structured or unstructured data. The extracted data is migrated and stored into a data warehouse from which it is further analyzed and interpreted for business cases. One of the most extensively used web scraping and Data Extraction tools in the market, OutWit Hub browses the Web and automatically collects and organizes relevant data from online sources. The tool first segregates web pages into separate elements and then navigates them individually to extract the most relevant data from them. Extraction also allows you to share data in a common, usable format. Accuracy and precision. Manual processes and hand-coding increase opportunities for errors, and the requirements of entering, editing, and re-enter large volumes of data take their toll on data integrity. Extraction allows many different kinds of data to be combined and ultimately mined for business intelligence. Transformation: Once the data has been successfully extracted, it is ready to be refined. During the transformation phase, data is sorted, organized, and cleansed.
2.7 Result and Experiment
In this chapter, own developed questionnaire dataset from survey form is used. Data set holds more than 20 instances and has 6 attributes. The data set has: Instances = 210 and Attributes = 6. Different tables for the values of true positive rates, false-positive rates, recall, F-Score, MCC, Precision etc. are created. These give different speculation values and calculations with different specifications are evaluated. These values are then used for the evaluation of numeric values in between +1 and -1 and results interpreted. With the help of accuracy and classifier, an accuracy graph is generated. Machine-learning framework compared with classifiers using accuracy, TP, FP is also evaluated. These results helped to interpret the conclusion out of it. Data collection from dataset is collected and shown in Table 2.1.
Table 2.1 Data collection from dataset.
| Able to give 100% in my performance | Regular and on time in my class | Students gets satisfy with the content | Students’ Queries are sorted out efficiently | Satisfied with the time and work load assigned | Monetary gains is in proportion to assigned work |
|---|---|---|---|---|---|
| Happens Many Times | Does Not Happen | Happens Many Times | Does Not Happen | Happens Many Times | Does Not Happen |
| Does Not Happen | Does Not Happen | Does Not Happen | Does Not Happen | Does Not Happen | Does Not Happen |
| Happens Many Times | Does Not Happen | Happens Many Times | Does Not Happen | Happens Many Times | Does Not Happen |
| Does Not Happen | Cannot Comment | Does Not Happen | Cannot Comment | Does Not Happen | Cannot Comment |
| Happens Many Times | Happens Many Times | Happens Many Times | Happens Many Times | Happens Many Times | Happens Many Times |
| Cannot Comment | Does Not Happen | Cannot Comment | Does Not Happen | Cannot Comment | Does Not Happen |
| Does Not Happen | Does Not Happen | Does Not Happen | Does Not Happen | Does Not Happen | Does Not Happen |
| Happens Many Times | Happens Many Times | Happens Many Times | Happens Many Times | Happens Many Times | Happens Many Times |
| Does Not Happen | Cannot Comment | Does Not Happen | Cannot Comment | Does Not Happen | Cannot Comment |
| Happens Many Times | Happens Many Times | Happens Many Times | Happens Many Times | Happens Many Times | Happens Many Times |
| Does Not Happen | Does Not Happen | Does Not Happen | Does Not Happen | Does Not Happen | Does Not Happen |
| Happens Many Times | Does Not Happen | Happens Many Times | Does Not Happen | Happens Many Times | Does Not Happen |
| Cannot Comment | Happens Many Times | Cannot Comment | Happens Many Times | Cannot Comment | Happens Many Times |
| Does Not Happen | Does Not Happen | Does Not Happen | Does Not Happen | Does Not Happen | Does Not Happen |
| Happens Many Times | Happens Many Times | Happens Many Times | Happens Many Times | Happens Many Times | Happens Many Times |
| Cannot Comment | Cannot Comment | Cannot Comment | Cannot Comment | Cannot Comment | Cannot Comment |
| Does Not Happen | Happens Many Times | Does Not Happen | Happens Many Times | Does Not Happen | Happens Many Times |
| Cannot Comment | Does Not Happen | Cannot Comment | Does Not Happen | Cannot Comment | Does Not Happen |
| Happens Many Times | Happens Many Times | Happens Many Times | Happens Many Times | Happens Many Times | Happens Many Times |
2.8 Comparison of Six Different Approaches For Stress Detection
Table 2.2 Comparison of six different approaches for stress detection.
| Serial number | Method | Advantages | Limitations | Exploited data | Results, accuracy |
|---|---|---|---|---|---|
| 1 | Feature based ML approach [3] | Speed, interpretability, low compute power | Required expert knowledge of the features | All the sensors | 93% (stress detection) |
| 2 | ML approach, per subject [3] | Same as 1 + tailored to a single subject | Same as 1 + need to be retrained for each subject | All the sensors | 88–99% (per subject) |
| 3 | ML approach [3] | Same as 1 + applicable to commercial smart watches | Same as 1 | Smart watch compatible data: wrist only without EDA | 87% (stress detection, balanced accuracy) |
| 4 | DL approach [3] | High-accuracy no expert knowledge | High compute, complex model | All sensors | 85% (3 classes) |
| 5 | DL, Self-supervised learning [3] | Very high accuracy no expert knowledge | High compute, complex method | ECG only + additional data sets | 97% (4 classes) |
| 6 | DL, Self-supervised learning [3] | Can leverage unlabeled data | More complex than supervised learning | New research WESAD smart watch data (all wrist data without EDA as in 3 | 85% (stress detection) |
2.9 Conclusions
Stress is a not a problem, it’s a pandemic. It is increasing day by day. It is also affecting the individual physical and psychological health. This chapter is proposed for stress prediction based on the faculty data-set of a university. After comparing the six methods in Table 2.2 it can be very well stated that DL, self-supervised learning is the best in accuracy. It uses PSS (perceived stress scale) to calculate stress level on student dataset. The classification techniques that are used in this study are Baye’s Net, Logistic Regression, Naïve Bayes, J48, Random Forest and Multilayer perceptron techniques for the prediction of stress. With the help of Weka tool, the accuracy of different techniques is calculated and compared. According to this paper we observe the Kappa statistic, F-measure, mean absolute error, MCC, ROC Area, False positive (FP), True positive (TP), RMSE and Recall and Random Forest classifier gives the best accuracy of 94.73 %.
2.10 Future Scope
The proposed work has lot of scope for future and it can be extended further. In this study, the case of a university faculty is taken. It can be extended to get the stress prediction for college faculties and can be extended to know how well the students those who belong to university, college or school even. This study will surely help us to know that the university faculties are facing a stress levels to some extent and needs proper intervention for better lifestyle.
Additional methods like the Naïve Bayes classifier can be used to test the efficiency of the model. One can implement deep learning techniques like CNN (Convoluted Neural Networks) and verify how the model performs for the given dataset. A much more specific and vast dataset can be used as a training model since the number of responses is limited in our case.
References
- 1. Sharma, D., Kapoor, N., Kang, S.S., Stress prediction of students using machine learning. IJMPERD, 10, 3, 5609–5620, July 2020.
- 2. Norizam, S., Determination and Classification of Human Stress Index Using Nonparametric Analysis of EEG Signals, Diss. Universiti Teknologi MARA, Malaysia, 2015.
- 3. Alshamrani, M., Semi-supervised deep learning for stress prediction: A review and novel solutions. Int. J. Adv. Comput. Sci. Appl., 12, 9, 426, 2021.
- 4. Priyaa, A., Garga, S., Tigga, N.P., Predicting anxiety, depression and stress in modern life using machine learning algorithms. Sci. Direct Proc. Comput. Sci., Elsevier, 167, 1258–1267, 2020.
- 5. Jiang, H., Nie, Z., Yeo, R., Farimani, A.B., Kara, L.B., StressGAN: A generative deep learning model for 2D stress distribution prediction. J. Appl. Mech., 234–243, January 2021.
- 6. Reddy, S., Thota, A.V., Dharun, A., Machine Learning Techniques for Stress Prediction in Working Employees, Conference Paper, December 2018.
- 7. Java Point, Deep learning algorithms, https://www.javatpoint.com/.
- 8. https://www.simplilearn.com/
- 9. Tutorial Point, Deep learning algorithms, https://www.javatpoint.com/.
- 10. Zhuang, X., Nguyen, L.C., Nguyen-Xuan, H., Alajlan, N., Rabczuk, T., Efficient deep learning for gradient-enhanced stress dependent damage model. Appl. Sci. MDPI, 1002–1011, April 8, 2020.
Note
- Email: [email protected]