
10
A Comparative Intelligent Environmental Analysis of Air-Pollution in COVID: Application of IoT and AI Using ML in a Study Conducted at the North Indian Zone
Rohit Rastogi1*, Abhishek Goyal2, Akshit Rajan Rastogi1 and Neha Gupta1
1Dept. of CSE, ABES Engineering College, Ghaziabad, U.P., India
2Dept. of CSE, KIET Engineering College, Ghaziabad, U.P., India
Abstract
In the populated and developing countries, governments consider the regulation and protection of environment as a major task and should take into consideration the concept of Smart Environment Monitoring. The main motive of these systems is to enhance the environment with various technology including sensors, processors, data sets and other devices connected across the globe through a network. This system can basically help in monitoring air quality which is necessary in the field of meteorological studies and movement factors. Also, these factors contribute a lot in air pollution. So, forecasting air quality index using an Intelligent Environment system includes a machine learning model in order to predict air quality index for NCR (National Capital Region). The values of major pollutants like SO2, PM2.5, CO, PM10, NO2, and O3. In recent years, machine learning in most emerging technology for predicting on historical data with 99.99% of accuracy.
The authors’ team has implemented different machine learning algorithms of classification and regression techniques like Linear Regression, multiple linear regression, KNN, Random Forest Regression, Decision Tree Regression, Support Vector Regression, and Artificial Neural Networks. To make our prediction more accurate, mean square error, mean absolute error and R square errors have been considered. To prognosticating air quality index of NCR, India in different aspects like stubble farming, motor vehicle emission, and open construction practices which result in polluting the air quality of NCR.
The manuscript is helping to frame a structured view of air quality prediction methods in reader’s mind and also gives suggestions for other prediction methods as well. The real challenge is to decide which method will be applied in predicting the air quality. Hence, it is important to test and use all these methods.
Keywords: Machine learning, air pollution prediction, linear regression, artificial neural network, KNN, SO2, PM2.5
10. 1 Introduction
This chapter discusses the different parameters of air quality and environment using various machine learning algorithms. This paper also introduces us with the reason behind the contamination of air. Pollution can cause harm to not only air but to water bodies as well. It can take the form of noise, heat, and even light. The substances which are responsible for pollution can be either foreign substance or they may have been naturally occurred in the nature. Pollution is mostly classified as to be caused by any one single source rather than many.
10.1.1 Intelligent Environment Systems
In this era of globalization, every country in the world is facing problems related to environment. In order to control these problems, it has become a primary concern of thinking for the various organizations and governments. This emerging problem produces a need of monitoring of environment and finding more environment nourishing solutions. And, this need brings smart monitoring techniques into the picture [5].
Intelligent Environment Systems plays an important role in approximately all sectors. This field is becoming a must have for cities with increased industrialization, high population and massive transportation, as these sectors are the main reason behind increasing pollution [18].
10.1.2 Types of Pollution
Pollution is mainly of four types: water pollution, soil pollution, noise pollution and air pollution. We here elaborate detail about air pollution. A factor which induces air pollution is stubble farming, motor vehicle emission, topological factor, and open construction work. The ordinance of environmental contamination has drawn public examination. NCR (National Capital Region) is one of the most contaminated territories in the world [17].
10.1.3 Components in Pollution Particles
Different researches have carried out several experiments and have come to a conclusion that the concentration of pollutants in NCR is alarmingly higher as compared to any other region [16].
This has made the lives of all the residents less for up to 6 years. While some researchers have [1] concluded that pollution has affected human fitness. Hence, we enhancing the air quality forecasting is one of the best objectives for civilization. Sulphur dioxide, PM2.5 and NO are major pollutants found in the air. Sulphur dioxide is a gas, present in air [6].
This combines easily with different substances to form harmful substances like sulphur acid, sulfurous acid etc. Sulfur dioxide affects social fitness when it is inhaled in. It causes a burning feeling in the nose, throat, and airways to result into coughing, wheezing, the brevity of breath, or a tense feeling around the chest. The concentration of Sulphur dioxide in the environment affects the places we can live in [3]. PM2.5 is also known as fine particulate matter (2.5 micrometers is one 400th of a millimeter). Fine particulate matter (PM2.5) is important among the pollutant index because it is a big concern to people’s health when its level in the air becomes high [11]. So, it has been categorized according to Air quality index table.
10.1.4 Research Problem Introduction and Motivation
- With an average of 98.6 Particulate Matter (PM 2.5) concentration, Delhi was the most polluted city in the world. 21 cities out of 30, which were the most polluted, were from India.
- India leads the charts for the most polluted cities in the world. All those cities in India, who were to be monitored as per WHO, didn’t report for the annual pollution exposure 2019.
10.2 Related Previous Work
Numerous other models exist to check the concentration of pollutants in cities like Delhi. Traditionally analytical models and statistical models include synthetic variation models and atmospheric dispersal models, which were applied for prognostication. Recently it was seen that machine learning methods give a more accurate result in cases of prognostication models.
10.2.1 Machine Learning Models
We know that machine learning has made our lives easier because of their accurate predictions. But when these algorithms are combined with that of AI’s, the results become clearer. A machine learning approach takes various different factors into account unlike the statistical approach. Artificial Neural Networks (ANNs) have emerged to be one of the several broadly accepted methods for the prognostication of air quality [2]. Many researchers have built their models based on regression. Artificial intelligence algorithms such as fuzzy logic, generative algorithm, Principal component analysis (PCA) along with ANNs have been applied to create such models like Adaptive Neuro Fuzzy Interface System (ANFIS) model [13] etc. Another machine learning models that have been recognized add Support Vector Machine (SVM) situated model, PCA-SVM and several also. A modified Lasso and Ridge regression technique model [15] is where K-nearest neighbor algorithm has also been implemented to determine concentrations of PM2.5, SO2 and PM10. Another study conducted in Quito, Ecuador [14], worked on six meteorological constituents for predicting AQI concentrations. K. Hu et al. [2], planned a machine training model HazeEst for prognosticating the air index. Here, first, the method was evaluated using seven distinctive regression technique, and finally, SVR (Support vector regressor) was chosen as the ultimate prognostication model. The main goal is to prognosticate an air contamination level in an urban area with the ground data set [15].
10.2.2 Regression Techniques Applications
This method has used the linear regression and Support vector regression for the forecast of the contamination of the next month, the next day, and any date of future. The method improves to prognosticate any date contamination details within one period based on independent parameters and examining pollution parts and determine future pollution. Time Series Analysis was also used for the identification of future data points which have seasonality and trends in air pollution prediction [3].
This designed method performs two significant tasks. (i) Identifies the levels of pollutants (S02, PM2.5, CO, benzene) based upon provided meteorological values. (ii) Prognosticates the level of pollutants for a special date [10]. Logistic regression is used to identify a data sample is either contaminated or not contaminated. Auto regression is used to prognosticate projected values of pollutants based upon the early pollutants’ interpretations. The prime aim is to prognosticate the air pollution level within a particular area with the raw data set [11].
- Air quality prediction using machine learning model by Tripathi, C.B. [17].
- Nandigala Venkat Anurag, Yagnavalk Burra, S. Sharanya they carried out case study on Air Quality Index Prediction with Meteorological Data Using Feature Based Weighted Xgboost by analyzing trend in air quality with year wise the explore key factor that responsible for Air Quality Index predication [4].
- Chavi Srivastava, Shyamli Singh, and Amit Prakash Singh they also carried out case study on Estimation of Air Pollution in Delhi Using Machine Learning Techniques by estimate the value of AQI by train machine learning model on various regression model like linear regression and etc. [12].
- Shivangi Nigam, B.P.S. Rao, N. Kumar, V. A. Mhaisalkar evaluate the Air Quality Index – A Comparative Study for Assessing the Status of Air Quality they evaluate dataset to find specific trends in season related to previous years data with present year and find some pattern in dataset which is use full to find different factor which is best fit for estimate value of AQI and trends according season and lot of factor having correlation between them [8].
10.3 Methodology Adopted in Research
10.3.1 Data Source
To prognosticate the air quality of The NCR area, authors’ team wanted the pollutant concentration of all the elements available in the air, which will be available in the cpcb.nic.in the website, which holds all the data that contaminates the area every year. Research Team used data from several stations which measures many elements present in the atmosphere. Data is taken from 10 different stations in NCR. These data are stored in the form of a table which consists of a total of 3469 rows and having eight columns in each row. The AQI formulae will be applied in order to calculate the AQI by using the various regression algorithm for a particular year.
The first step, to build such a model is to collect the raw dataset. The air pollutant dataset was collected from government website cpcb.com which place all record of air pollutant of every year in day wise format, of various formats. The snapshot for the same is shown in Table 10.1.
Duration: 1 January, 2017 – 1 January, 2020
Various Station: Anand Vihar, Delhi – DPCC, Indirapuram, Ghaziabad –
UPPCB, AshokVihar, Delhi – DPCC, Bawana, Delhi – DPCC, etc.
Daily Time Span: 0:00 to 23:59 h (24 h)
- Number of tuples recorded per day: 1
- Total number of tuples in wanted duration: 3469 after cleaning
NOTE: The data is collected from different station
Table 10.1 Sample dataset of air pollutant.
| From date | PM2.5 | PM10 | NO2 | Ozone | CO | AQI | |
|---|---|---|---|---|---|---|---|
| 0 | 26-09-2017-00:00 | 75.77 | 104.98 | 24.72 | 45.75 | 104.98 | 75.73758 |
| 1 | 27-09-2017-00:00 | 103.23 | 149.3 | 25.07 | 55.18 | 149.3 | 97.67374 |
| 2 | 28-09-2017-00:00 | 34.32 | 116.97 | 25.37 | 54.59 | 116.97 | 81.67202 |
| 3 | 29-09-2017-00:00 | 80.18 | 112.76 | 25.89 | 55.45 | 112.76 | 79.58828 |
| 4 | 30-09-2017-00:00 | 36.15 | 112.9 | 25.33 | 51.86 | 112.9 | 79.65758 |
| 5 | 01-10-2017-00:00 | 67.24 | 109.68 | 25.04 | 48.03 | 109.68 | 78.06384 |
| 6 | 02-10-2017-00:00 | 38.83 | 55.34 | 24.88 | 43.57 | 55.34 | 51.16828 |
| 7 | 03-10-2017-00:00 | 51.2 | 72.22 | 25.68 | 53.17 | 72.22 | 59.52303 |
| 8 | 04-10-2017-00:00 | 78.04 | 112.26 | 26.3 | 56.01 | 112.26 | 79.34081 |
| 9 | 05-10-2017-00:00 | 77.16 | 101.28 | 27.79 | 58.34 | 101.28 | 73.90626 |
| 10 | 06-10-2017-00:00 | 62.62 | 86.48 | 27.36 | 59.36 | 86.48 | 66.58101 |
| 11 | 07-10-2017-00:00 | 17.91 | 24.48 | 26.31 | 54.66 | 24.48 | 22.66667 |
| 12 | 08-10-2017-00:00 | 37.63 | 108.94 | 25.92 | 59.16 | 108.94 | 77.69758 |
| 13 | 09-10-2017-00:00 | 128.1 | 153.99 | 24.42 | 48.71 | 153.99 | 99.99505 |
| 14 | 10-10-2017-00:00 | 30.39 | 139.72 | 24.62 | 51.28 | 139.72 | 92.93212 |
| 15 | 11-10-2017-00:00 | 74.4 | 119.73 | 25.11 | 50.32 | 119.73 | 83.03808 |
| 16 | 12-10-2017-00:00 | 29.88 | 166.77 | 28.46 | 69.42 | 116.77 | 106.8256 |
| 17 | 13-10-2017-00:00 | 92.2 | 151.41 | 28.1 | 63.01 | 151.41 | 98.71808 |
10.3.2 Data Pre-Processing
Removing Rows with Missing Values
- The easiest way to take care of such missing values is to remove the whole row. But, these information should be contained in different rows so that there is no loss of data. Deleting the whole row has not been proved to be so beneficial.
Fixing Errors in the Structure
Typographical or grammatical errors should be always avoided. But, if any how these error are present in dataset, we need to remove it so that they do not cause a problem with the machine learning model. Such errors create confusion in the code.
10.3.3 Calculating AQI
An air quality index (AQI) is used by the government to tell the people how much the cities are polluted. Public health risks increase with the increase in AQI. Different countries have their own AQI. Here, we had focused on the AQI used in India.
10.3.4 Computing AQI
The air quality index is a linear function of the pollutant concentration. At the boundary between AQI categories, there is a discontinuous jump of one AQI unit. To convert from concentration to AQI this equation is used:
(As per given Figure 10.1, the formula to calculate AQI)
Table 10.2 is showing AQI Category, pollutants and Health Breakpoints.

Figure 10.1 The equation to calculate AQI.
Table 10.2 EPA table.

10.3.5 Data Pre-Processing
Following Steps were performed for data preprocessing and collection.
Data Refinement
The data to be analyzed by first cleaned, by removing all the unfavorable values. The missing values in case of the target object, i.e., the pollutants are estimated using an imputer function to perform the interpolation. The strategy used here for estimation is the mean value. Data pre-processing projection of the null values by heat map is shown in Figure 10.2 and Figure 10.3.
Removing null rows having maximum number of null values as show in Figure 10.6.
Fill Null Values
Values are shown in Figure 10.4 and correlation of data is shown in Figure 10.5.

Figure 10.2 Heat map of our dataset.
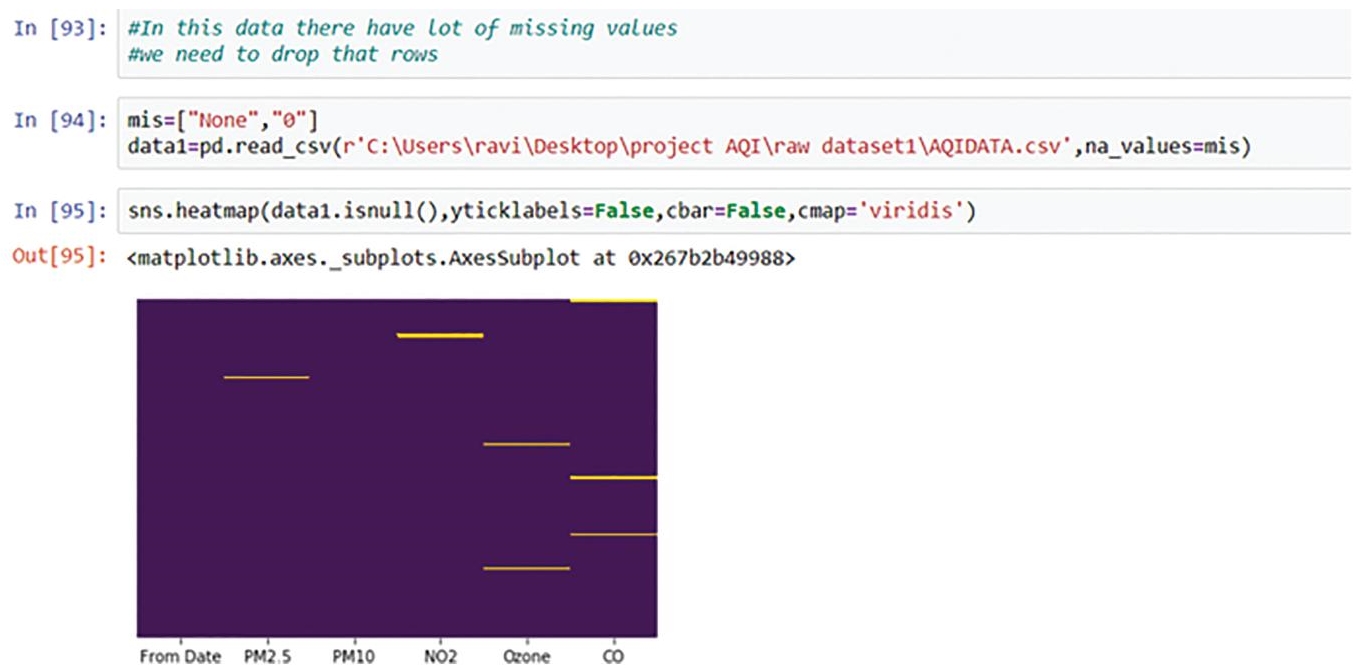
Figure 10.3 Heat map after removing null rows.
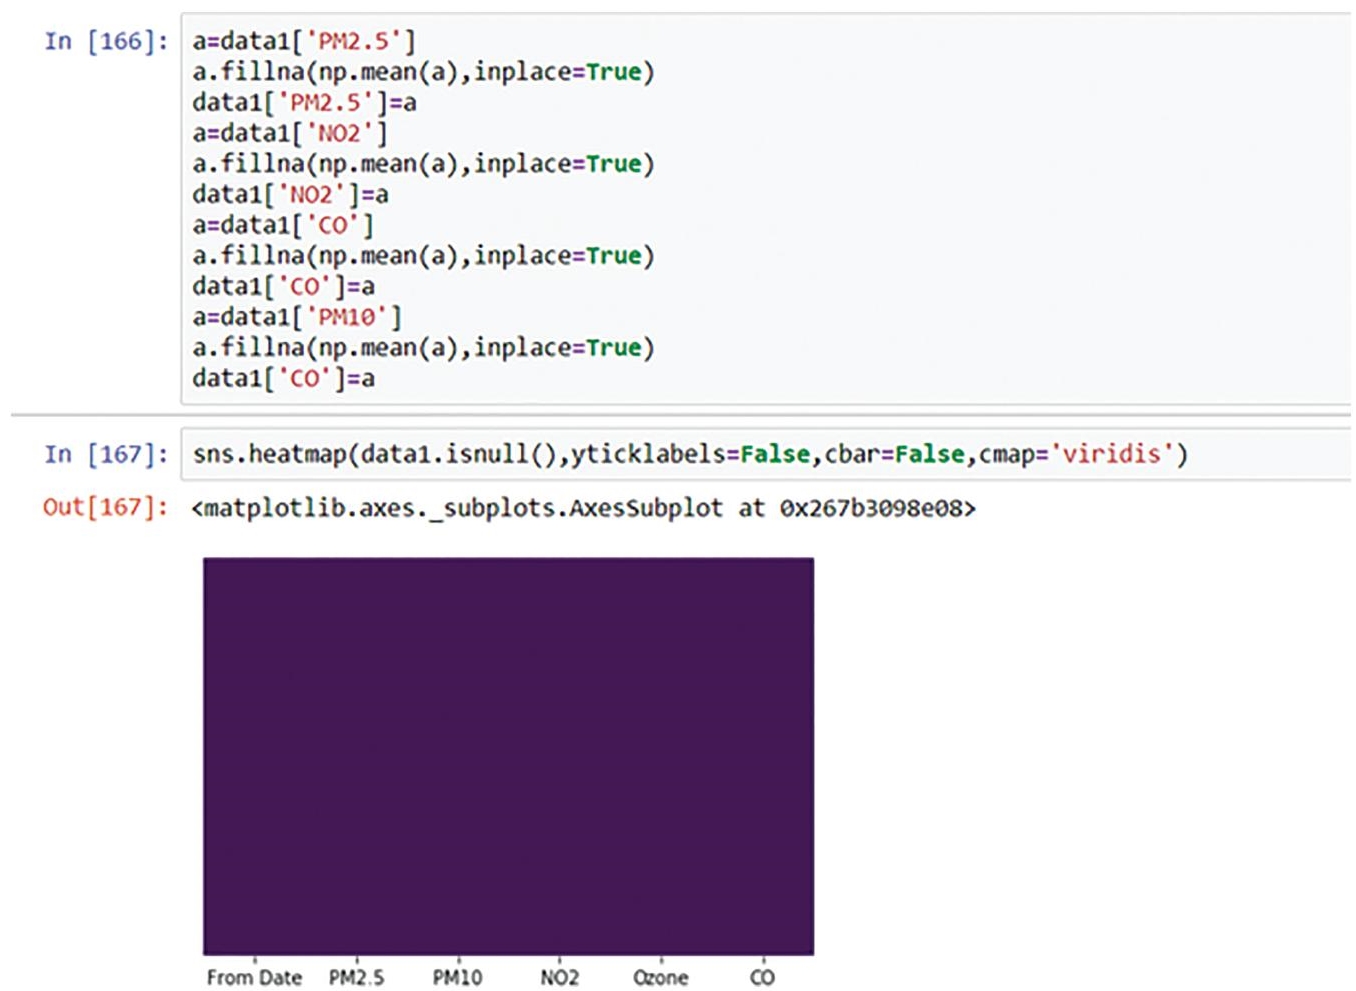
Figure 10.4 Filling missing values by mean.

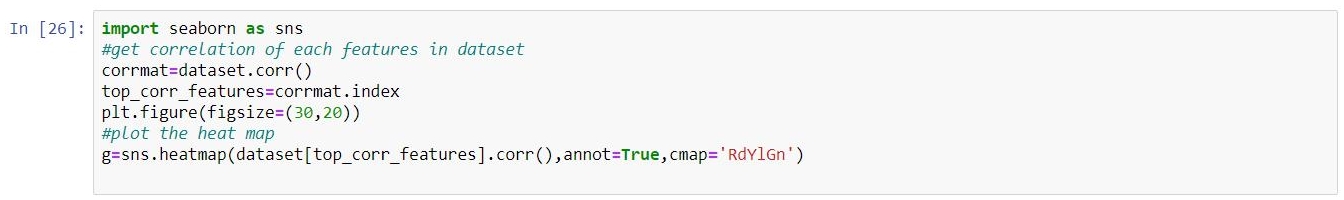
Figure 10.5 Correlation in dataset.
Now, visualize the dataset. We’d try to find the correlation between attributes using ‘heat map’ as shown in Figure 10.5.
10.3.6 Feature Selection
Feature selection is the method of choosing a subset from the features that contain important data. In the case of unnecessary data, feature extraction implies used. Feature extraction includes the choice of best input parameters of the chosen input dataset. The unified dataset which was gathered is used for further analysis. The maximum amount of inputs available for review is seven, hence all the inputs are selected for the computations (as per Figure 10.6).
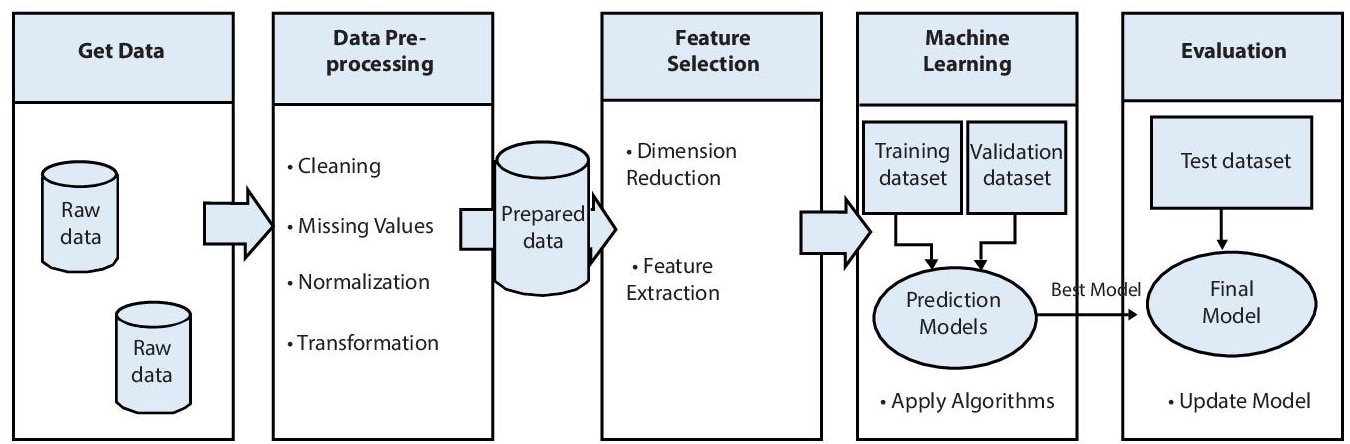
Figure 10.6 Model for training the dataset.
Training the Model
Data splitting was done as 80% for training and 20% for testing.
10.4 Results and Discussion
10.4.1 Collective Analysis
The machine learning model to predict air pollution was one the most important objective of the research paper. We here predict air pollution on particular data i.e. 1 January 2020. We take data of previous years the data from www.cpcb.nic.in. By using linear regression, Lasso-Ridge regression, KNN and support vector machine. We actually compare actual value and predicted values. Self-explanatory Data Visualization as shown in Figure 10.7 to Figure 10.9 as per order of Year, Month and their averages.
After evaluation of different type of regression model, it was found that the best fit model for predict AQI is K-nearest neighbor model which having accuracy of 97.5 percentage. This model is best fit.
Here, we show that the almost all values is equal some particular values show anomalous behavior. If we see average of AQI in month wise Figures 10.8 and 10.9, we easily say that AQI not only depends on concentration of particle it also show that AQI also depends on temperature, humidity, etc. It concludes that we need more data and Add more column in dataset of other factor like temperature and etc.
We clearly see that, if we particularly show average July and august month in 2017 it is far more differ than other years same month.
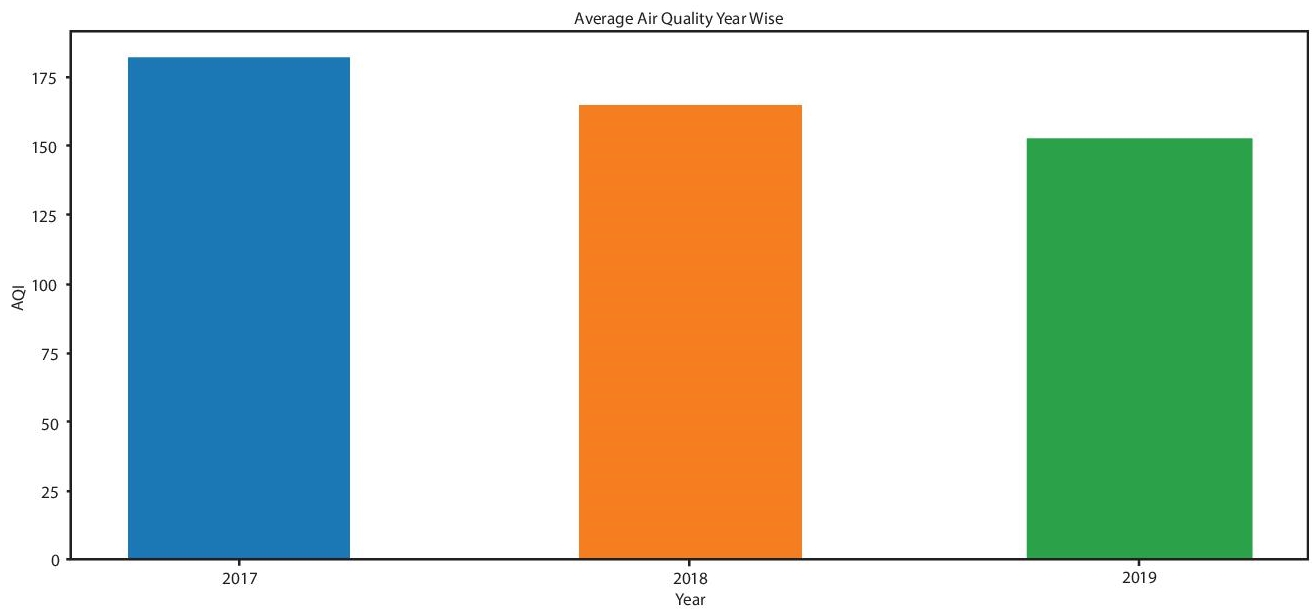
Figure 10.7 Average of AQI year wise.
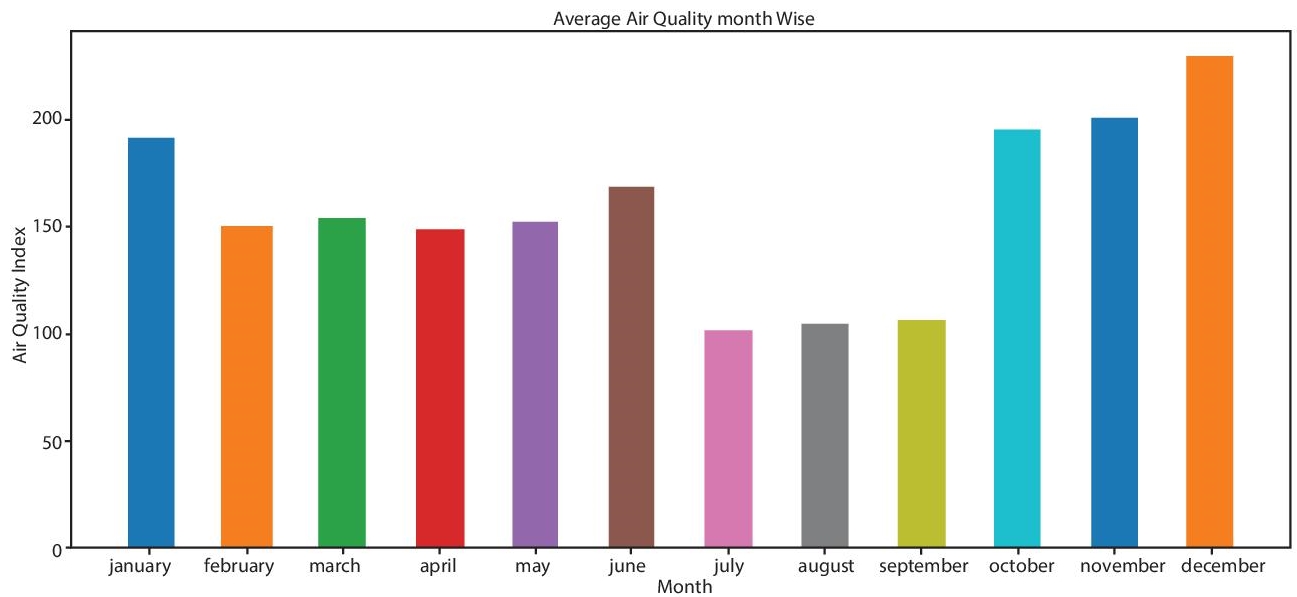
Figure 10.8 Average of AQI monthwise.

Figure 10.9 Average of AQI according to month.
10.4.2 Applying Various Repressors
Here we used various regression algorithm for predicting dependent variable such that
- Multiple linear regression
- Lasso and Ridge regression
- Support vector regressor
- k-nearest neighbors regression
K nearest neighbor is best fit model which having accuracy of 97.5%. It is best model of predicting air quality index prediction on independent variable (PM2.5, PM10 and etc.) as shown in Figure 10.10 and Figure 10.11.
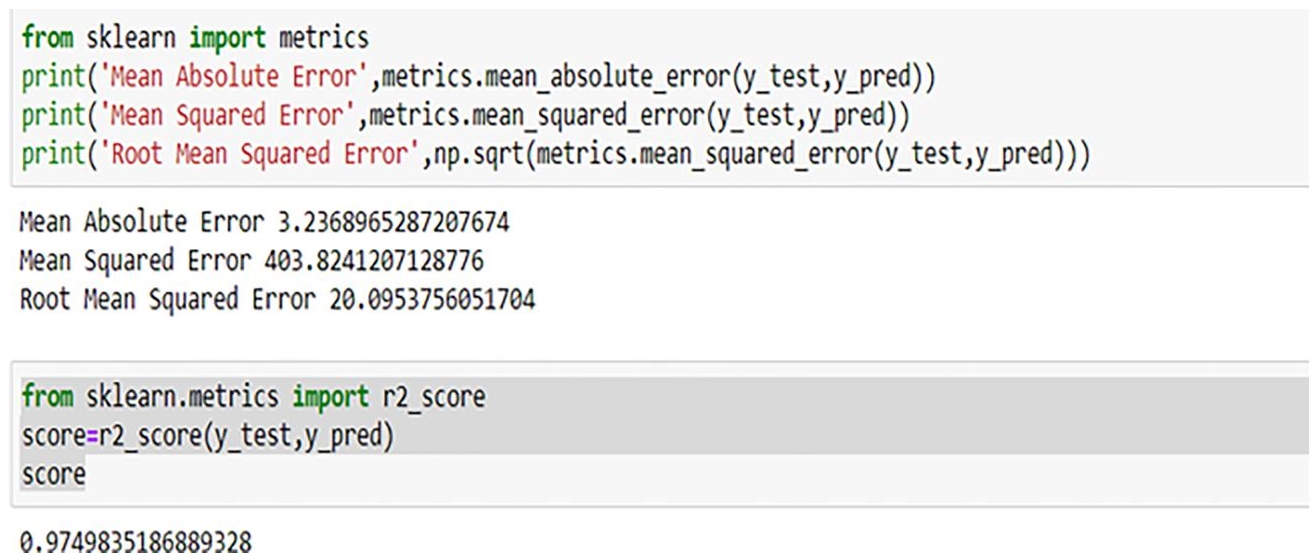
Figure 10.10 Accuracy of k-nearest neighbor.
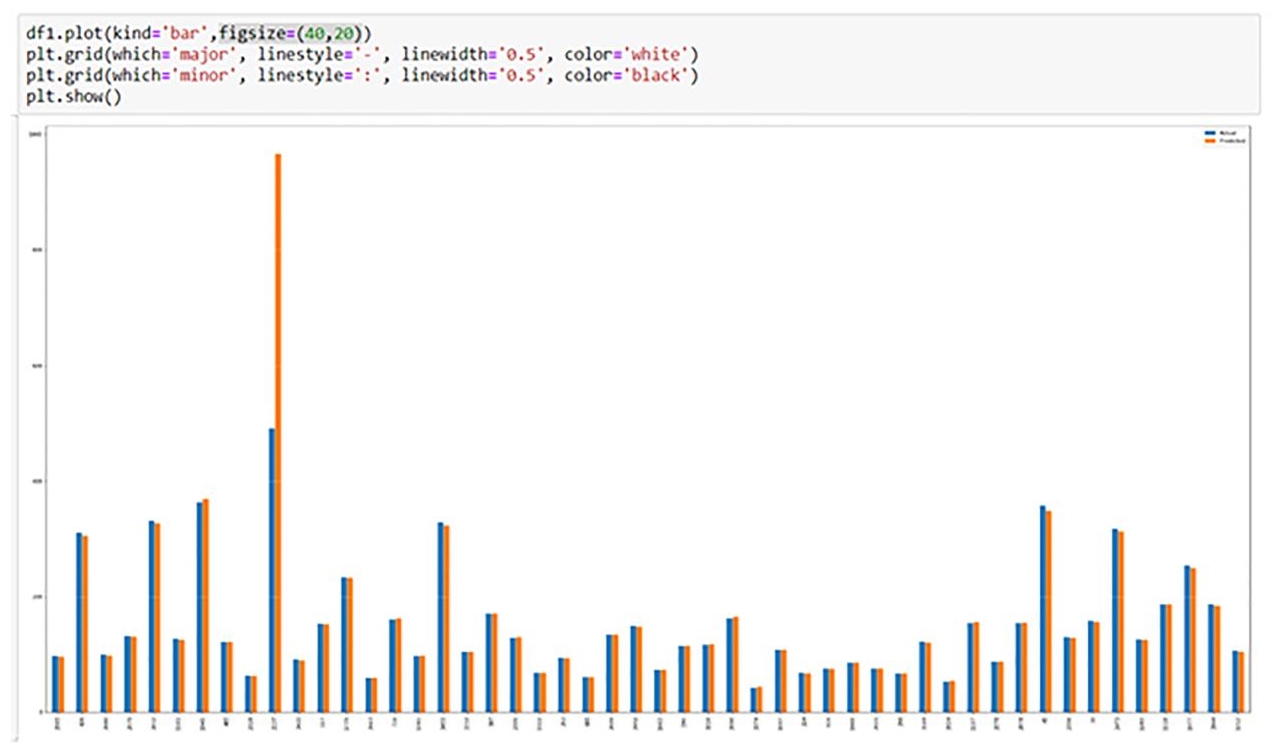
Figure 10.11 Comparison between actual values and predicted values.
As shown Figure 10.11 comparing actual values with predicted values.
Figure 10.11 shows comparison between actual values and predicted values here we show that actual values are almost equal to predicted values except some values.
10.4.3 Comparison with Existing State-of-the-Art Technologies
This project has used several factors like temperature, occasion and weather conditions in order to improve the results.
Table 10.3 Model evaluation.
| Models | Mean absolute error | Root mean squared error |
|---|---|---|
| Multiple Linear Regression | 38.386647 | 65.075391 |
| Lasso Regression | 38.344869 | 65.059393 |
| Ridge Regression | 38.385283 | 65.075104 |
| Support Vector Regressor | 0.099856 | 0.387394 |
| K-Nearest Neighbors | 3.236896 | 20.095375 |
Performance Evaluation
- Based on the comparison of out-of-sample RMSE among the models, along with taking into account the interpretability of the model, we have decided that k nearest neighbor is the best model. For reference, following is the performance of the models and comparison of their in-sample and out-of-sample RMSE values (as per Table 10.3).
Evaluation
- After implementing different types of algorithm, we need to evaluate which algorithm is best for predict AQI of NCR. Table 10.3 show root mean and r squared values of algorithm which mention in above paragraph.
10.5 Novelties in the Work
This research used various algorithms of regression and classification like LR, SDGR, RFR, DTR, SVM, and ANN. To make the predictions more accurate the research team has used MSE and MAE with R square. For predicting air quality index of NCR (National Capital Region) in different aspects of like stubble farming, Motor vehicle emission, and open construction practice which impact of air quality of NCR.
10.6 Future Research Directions
There is a lot of scope in future regarding this topic as various aspects can be covered regarding this field. Also, air pollution and environment analysis can also be done with the help of Advanced Machine Learning Algorithms or Deep Neural Networks. In order to build a good predicting model, we can find the air quality index by taking various parameters into consideration like temperature, humidity, etc. Also, models implemented in this paper can be applied to a greater number of stations for increase the training input [2]. It is also observed that the approach can also help to identify the predictor(s) for which the variance is not properly captured (reason for heteroscedasticity). This will also help to solve the problem for normality as well. We can still search for other avenues in order to look for quality controlled data. The next research seekers can also train their model for next year data and also, solve the problem of auto-correlations [7].
10.7 Limitations
Various limitations were faced in writing this challenging paper and carrying out such a difficult task. The experiment needs further more tiny constraints for future predicting AQI. In this paper, instruments applied for finding readings were limited to some range and generated the limited results [9]. So, to get more refined results, one needs more refined instruments. Due to the limitation of the data, some aspects are still left to be covered which can be interesting research area. Also, this experiment was confined to a small place, so in order to view the environmental situation from different perspectives, one may need to extend future research to different parts of the country or continent [7].
10.8 Conclusions
In the populated and developing countries, governments consider the regulation of air as a major task. Monitoring air quality using Intelligent and Smart Environment Solutions is a necessity due to various pollution causing activities including stubble burning and open construction practices contributing a lot in the air pollution. So, we can forecast air quality index using machine learning algorithms working as a part of Smart Environment systems in order to predict air quality index for NCR zone at India.
For making an advanced training and predicting model, any researcher seeker and interested can take various parameters into examination like temperature, concentration of each gas in the atmosphere, pressure, etc. Place of experiment is also a major parameter to take into consideration as each and every place has its own environment related problems.
Air quality indexes of major pollutants like PM2.5, PM10, CO, NO2, SO2, and O3. In recent years machine learning in most emerging technology for predicting on historical data with 99.99% of accuracy. Advanced fields including Artificial Intelligence, Data Analytics, Deep Learning Algorithms, etc. can be very helpful in saving the environment from pollution.
Acknowledgements
The authors want to extend sincere thanks to management and officials of ABES Engineering College, Ghaziabad who gave all facilities, permissions and support to conduct the experiment and we also want to extend thanks to professors and guides from reputed universities, Dr. D.K. Chaturvedi of DEI, Dr. Santosh Satya of IIT Delhi and Dr. Navneet Arora of IIT Roorkee for their motivation and encouragement. We also extend sincere thanks to the Almighty and all direct and in direct supporters and well-wishers.
Key Terms and Definitions
Multiple Linear Regression
Multiple Linear Regression (MLR) is a statistical technique for finding the linear relation between the independent variables (predictors) and the dependent or response variable. The general MLR model is built from N observations of the multiple predictor variables xk (k = 1, 2,.., m) and the observed target data y.
Lasso and Ridge Regression
Ridge regression and Lasso regression are very similar in working to Linear Regression. The only difference is the addition of the l1 penalty in Lasso Regression and the l2 penalty in Ridge Regression. The primary reason why these penalty terms are added is two ensure there is regularization, shrinking the weights of the model to zero or close to zero to ensure that the model does not overfit the data.
Support Vector Regressor
Support Vector Machine can also be used as a regression method, maintaining all the main features that characterize the algorithm (maximal margin). The Support Vector Regression (SVR) uses the same principles as the SVM for classification, with only a few minor differences. First of all, because output is a real number it becomes very difficult to predict the information at hand, which has infinite possibilities.
k-Nearest Neighbor Regression
K nearest neighbor is a simple algorithm that stores all available cases and predicts the numerical target based on a similarity measure (e.g., distance functions). KNN has been used in statistical estimation and pattern recognition already in the beginning of 1970’s as a non-parametric technique.
Data Visualization
Data visualization is used to represent dataset and understand it through various plots and graphs. In air quality, we have used heat map, correlation matrix, and boxplot to visualize the data. Through, Data visualization, we get to know the relation between various attributes of the dataset. Python offers multiple libraries for data visualization and analysis.
Few popular plotting libraries:
- Matplotlib: low level, provides lots of freedom.
- Pandas Visualization: easy to use interface, built on Matplotlib.
- Seaborn: high-level interface, great default styles.
- ggplot: based on R’s ggplot2, uses grammar of graphics..
- Plotly: can create interactive plots.
Additional Readings
World’s Air Pollution: Real-time Air Quality Index
https://waqi.info/
National Air Quality Index
https://app.cpcbccr.com/AQI_India/
New Delhi Real-time Air Quality Index (AQI) & Pollution Report ...
https://air-quality.com/place/india/new-delhi/dd4464ff?lang=en&standard=aqi_us
AQI India: Real-Time Air Quality Index | Air Pollution Level
https://www.aqi.in/
New Delhi, Delhi Air Pollution Level, Real-Time Air Quality Index (AQI)
https://www.aqi.in/dashboard/india/delhi/new-delhi
Annex:
Code for Auto Correlation
References
- 1. Aggarwal, P. and Jain, S., Impact of air pollutants from surface transport sources on human health: A modelling and epidemiological approach. Environ. Int., 83, 146–157, 2015.
- 2. Baawain, M., Systematic approach for the prediction of ground level air pollution (around an industrial port) using an artificial neural network. Aerosol Air Qual. Res., 14, 1, 2014.
- 3. Bhalgat, P., Pitale, S., Bhoite, S., Air quality prediction using machine learning algorithms. IJCATR, 8, 09, 367–370, 2019.
- 4. Bhalla, N. and O’Boyle, J., Who is responsible for Delhi air pollution? Indian newspapers’ framing of causes and solutions. Int. J. Commun., 12, 41–64, 2018.
- 5. Dipanda, A., Damiani, E., Yetongnon, K., Special issue on intelligent systems and applications in vision, image and information computing. J. Reliab. Intell. Environ., 2, 117–118, 2016. https://doi.org/10.1007/s40860-016-0032-8.
- 6. Gallardo, M., Lavado, L., Panizo, L. et al., A constraint-based language for modelling intelligent environments. J. Reliab. Intell. Environ., 3, 55–79, 2017. https://doi.org/10.1007/s40860-017-0040-3.
- 7. Hornos, M.J., Application of software engineering techniques to improve the reliability of intelligent environments. J. Reliab. Intell. Environ., 3, 1–3, 2017. https://doi.org/10.1007/s40860-017-0043-0.
- 8. Hornos, M.J. and Rodríguez-Domínguez, C., Increasing user confidence in intelligent environments. J. Reliab. Intell. Environ., 4, 71–73, 2018. https://doi.org/10.1007/s40860-018-0063-4.
- 9. Jalan, I. and Dholakia, H., Issue Brief, What is Polluting Delhi’s Air? Understanding Uncertainties in Emissions Inventories, Council on Energy, Environment and Water, New Delhi, India, March 2019, www.ceew.in.
- 10. Kumar, S., Air pollution and climate change: Case study National Capital Territory of Delhi. Int. J. Sci. Eng. Res., 9, 6, 844–848, 2018.
- 11. Pandey, G., Zhang, B., Jian, L., Predicting sub-micron air pollution indicators: A machine learning approach. Environ. Sci. Process. Impacts, 15, 5, 996–1005, 2013.
- 12. Rizwan, S.A., Nonengkynrith, B., Gupta, S.K., Center for Community Medicine, All India Institute of Medical Sciences, New Delhi, India, 2007.
- 13. Sharma, A.K. and Baliyan, P., Air pollution and public health: The challenges for Delhi, India. Rev. Environ. Health, 33, 1, 77–86, Mar. 2018.
- 14. Singh, S. and Singh, A.P., Estimation of air pollution in Delhi using machine learning techniques. International Conference on Computing, Power and Communication Technologies, 2018, https://www.researchgate.net/publication/332430367.
- 15. Siris, V.A., Fotiou, N., Mertzianis, A. et al., Smart Application-aware IoT data Collection. J. Reliab. Intell. Environ., 5, 17–28, 2019, https://doi.org/10.1007/s40860-019-00077-y.
- 16. Srivastava, C., Singh, A.P., Singh, S., Estimation of Air Pollution in Delhi Using Machine Learning Techniques, 2018, https://www.researchgate.net/publication/332430367.
- 17. Tripathi, C.B., Baredar, P., Tripathi, L., Air pollution in Delhi: biomass energy and suitable environment policies are sustainable pathways for health safety. Curr. Sci., 117, 7, 1153–1160, Oct. 10, 2019.
- 18. Wilson, T., Legay, A., Sedwards, S. et al., Group abstraction for assisted navigation of social activities in intelligent environments. J. Reliab. Intell. Environ., 4, 107–120, 2018, https://doi.org/10.1007/s40860-018-0058-1.
Note
- *Corresponding author: [email protected]