
7
Building a Predictive Schedule
One of the most common questions we are asked as project managers is, “When will it be done?” Sometimes it seems like that question is the adult version of your kids asking, “Are we there yet?” In all seriousness, your project schedule is the most comprehensive view of project progress. It contains all kinds of information from milestones to resources to start and end dates and more. Knowing how to develop, optimize, and maintain your schedule is a fundamental requirement for project success.
In this chapter we'll discuss how you can use a schedule management plan to help plan how you manage the predictive and adaptive aspects of your schedule. Then we will describe four steps for building a schedule with well‐defined scope.
ORGANIZING WITH A SCHEDULE MANAGEMENT PLAN
A project where some deliverables can be well defined with reasonably accurate duration estimates can be scheduled with a fair degree of confidence and accuracy. The same can't be said for projects where some of the deliverables can't be defined or agreed to until part way through the project. The schedule approaches for these two situations are very different. But on a hybrid project you still have to put together a schedule that accounts for both situations. This is where a schedule management plan can help you think through the best way to develop and maintain a project schedule.
Like all project artifacts, a schedule management plan should be tailored to meet your needs. Table 7‐1 describes information commonly found in a schedule management plan.
TABLE 7-1 Schedule Management Plan Contents
| Schedule methodology | Document the scheduling methodology that will be used for the project, including critical path, Agile, or other methodology. |
| Scheduling tool | Identify the scheduling tool(s) that will be used for the project: scheduling software, task boards, and so forth. |
| Level of accuracy | Describe the level of accuracy needed for estimates. If there are guidelines for rolling wave planning and the level of refinement that will be used for duration and effort estimates, then you will indicate the levels of accuracy desired as time progresses. |
| Units of measure | Indicate whether duration estimates will be in days, weeks, months, story points, or some other unit of measure. |
| Variance thresholds | Indicate acceptable variances for work to be considered on time, in jeopardy, or late. |
| Schedule updates | Document the process for updating the schedule, including update frequency and version control. Indicate the guidelines for maintaining baseline integrity and for re‐baselining if necessary. |
For the Dionysus Winery project, the schedule management plan will include information about how the deliverables, which use multiple development approaches and different scheduling methods, will be incorporated into one schedule. There are several scheduling terms in the Dionysus Winery schedule management plan that have not been defined or used thus far. Those terms are defined below.
The schedule management plan for the Dionysus Winery project is shown below.
Many projects don’t need a schedule management plan. But because hybrid projects have different methods of scheduling and may use different schedule tools, it is a good idea to think through how to integrate that information. Having an integrated master schedule promotes efficient schedule planning, manages stakeholder expectations, and allows you to determine overall project status.
PREDICTIVE SCHEDULING
Developing a schedule for those parts of the project that have clear and fixed scope involves six steps:
- Identify tasks;
- Sequence tasks;
- Assign team members;
- Estimate durations;
- Analyze the schedule; and
- Finalize the schedule.
The next several sections cover this steps 1 through 4 in more detail. Steps 5 and 6 are in the next chapter.
Identify Tasks
Tasks are the actions needed to create the work packages. When you create your WBS, you decompose the work to create work packages. For creating the schedule, you decompose work packages to create tasks. In other words, tasks are verbs. Your WBS should be composed of nouns, and your task list should be composed of verbs.
Figure 6‐1 in Chapter 6 shows a high‐level WBS. The task list below elaborates the work package for the foundation. You can see that the numbering scheme developed for the WBS in the list format is continued for the tasks.
- 1.2.1.3. Foundation
- 1.2.1.3.1. Excavate
- 1.2.1.3.2. Grade
- 1.2.1.3.3. Install footings
- 1.2.1.3.4. Place forms
- 1.2.1.3.5. Install rebar
- 1.2.1.3.6. Pour concrete
- 1.2.1.3.7. Remove forms
For short projects you may not need to use rolling wave planning. However, for projects longer than six months, identifying all the tasks that need to take place usually isn't feasible. Therefore, identify only those tasks you need to accomplish in a 60–90‐day range, and keep the future work at a higher level.
It is a good practice to ask your team members to identify the tasks needed to complete the work packages. They have the subject matter expertise necessary to identify all the work needed. If you are able to start with a schedule from a similar project, you will still need to ask your team members to help you tailor it to meet the needs of your project.
Sequence Tasks
Once you have identified your tasks, you will need to put them in order. Most work on a project occurs sequentially—one task ends, and then the next one starts. However, there are some situations where tasks start at or around the same time or finish at or around the same time. The three main relationships between tasks are:
- Finish‐to‐start: The preceding task finishes and then the next task starts. The tasks in Figure 7‐1 all have a finish‐to start relationship. A finish‐to‐start relationship is abbreviated as FS. This is the most common relationship.
- Start‐to‐start: This relationship occurs when one task starts, and then the next task starts. In this situation the preceding task only needs to start before the next task starts, it doesn't have to finish before the next task starts. For the grand opening event for the winery, the task of planning the menu will start before planning the wine list. The menu doesn't have to be fully planned out before the wine list is created, but it should at least be started. A start‐to‐start relationship is abbreviated as SS.
- Finish‐to‐finish: The preceding task must finish before the next task can finish. For example, if the operations manager is putting together an operations manual, he can write the first draft of the content and then give it to a professional editor who will edit and format the content. For this series of tasks, some of the work can occur concurrently. However, the editing can't finish until the writing is finished. The formatting can't finish until the editing is finished. This type of finish‐to‐finish relationship is abbreviated as FF.
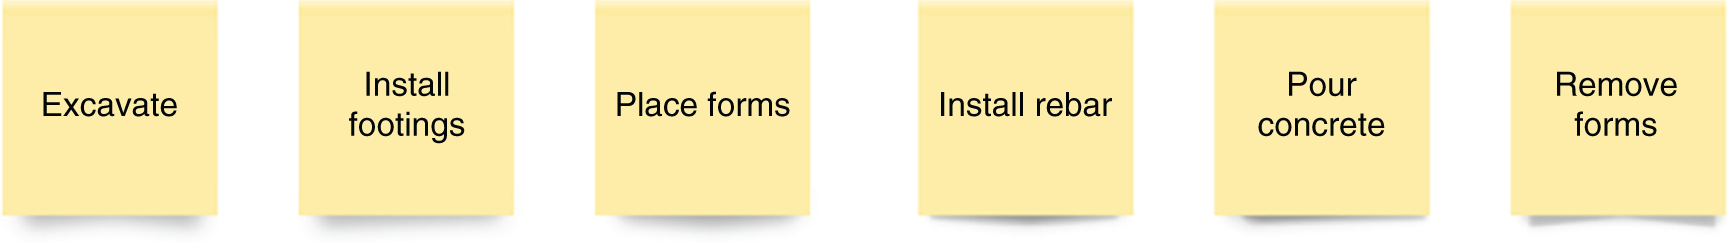
FIGURE 7‐1 Network diagram with sticky notes.
It is a useful practice to use sticky notes to work out the initial sequence of tasks. That way if you make a mistake, find a better way, or forget a task, it is easy to rearrange the sticky notes.
Leads and Lags
Sometimes you don't want to start a task as soon as its predecessor finishes—sometimes you want to wait. In scheduling terminology this is called a lag. For example, using the tasks for the foundation work package, after you pour the concrete (Task 1.2.1.3.6), you will have a lag of 10 days before you remove the forms (Task 1.2.1.6.7). A lag is indicated with a plus sign (+). Thus, the relationship between these two tasks is shown as FS + 10d, where “d” indicates days.
If you want to accelerate the time between two tasks, you use a lead. For example, if you have an FS relationship between gathering requirements and designing, you could apply a lead to accelerate the design. This is represented as FS − 2w, where FS is the finish‐to‐start relationship, the lead is shown as a minus sign, and 2w signifies two weeks.
Table 7‐2 shows some of the abbreviations used in scheduling.
TABLE 7-2 Scheduling Abbreviations
| Abbreviation | What it means |
|---|---|
| FS | finish‐to‐start |
| FF | finish‐to‐finish |
| SS | start‐to‐start |
| SF | start‐to‐finish |
| m | month |
| w | week |
| d | day |
| + | lag |
| − | lead |
Creating a Network Diagram
A network diagram is a visual depiction of your schedule from beginning to end. It shows the tasks as boxes (also called nodes), linked by arrows. Once you are comfortable with the flow, or the diagram starts to get too big, you can switch from sticky notes to entering the information into scheduling software. Figure 7‐2 shows the same information from Figure 7-1, but it is entered into software, and it shows the 10‐day lag.

FIGURE 7‐2 Network diagram in software.
Assign Team Members
You can have a perfect network diagram that shows the flow of work, but nothing happens without team members. At the start of the project, you will think about the roles and skills you need. As you progress, you will substitute names of team members for the roles. Entering the team member roles or names into scheduling software is referred to as resource loading.
For large projects with 50 or more team members, you will need to spend some time thinking about the number of team members you will need for each role. In the next few sections you will learn about several easy tools you can use to help keep track of your team needs.
Resource Breakdown Structure
A resource breakdown structure can show the number of people you need in each role. The resource breakdown structure in Figure 7‐3 shows an example for the renovation projects for the Dionysus Winery.
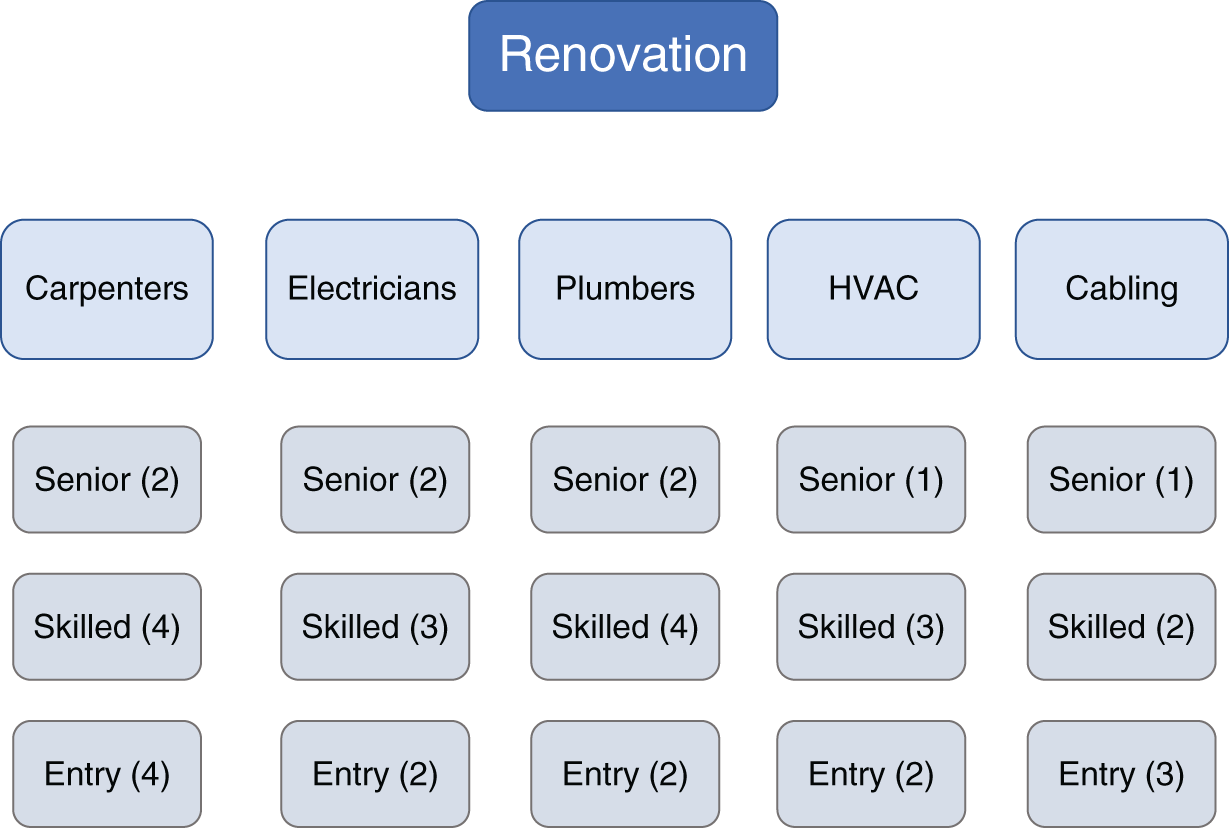
FIGURE 7‐3 Resource breakdown structure.
This breakdown chart is like an org chart or a work breakdown structure, but it focuses on project resources. If you have a lot of physical resources, such as equipment, material, and supplies, you can either integrate those categories or do a separate breakdown structure for physical resources.
Resource Histograms
You can also show resource needs with a resource histogram. Figure 7‐4 shows a resource histogram with the same information as the resource breakdown structure in Figure 7-3.
You can create a resource histogram by creating a table like Table 7‐3 in a spreadsheet.
Then you simply highlight the data and then insert a column chart.
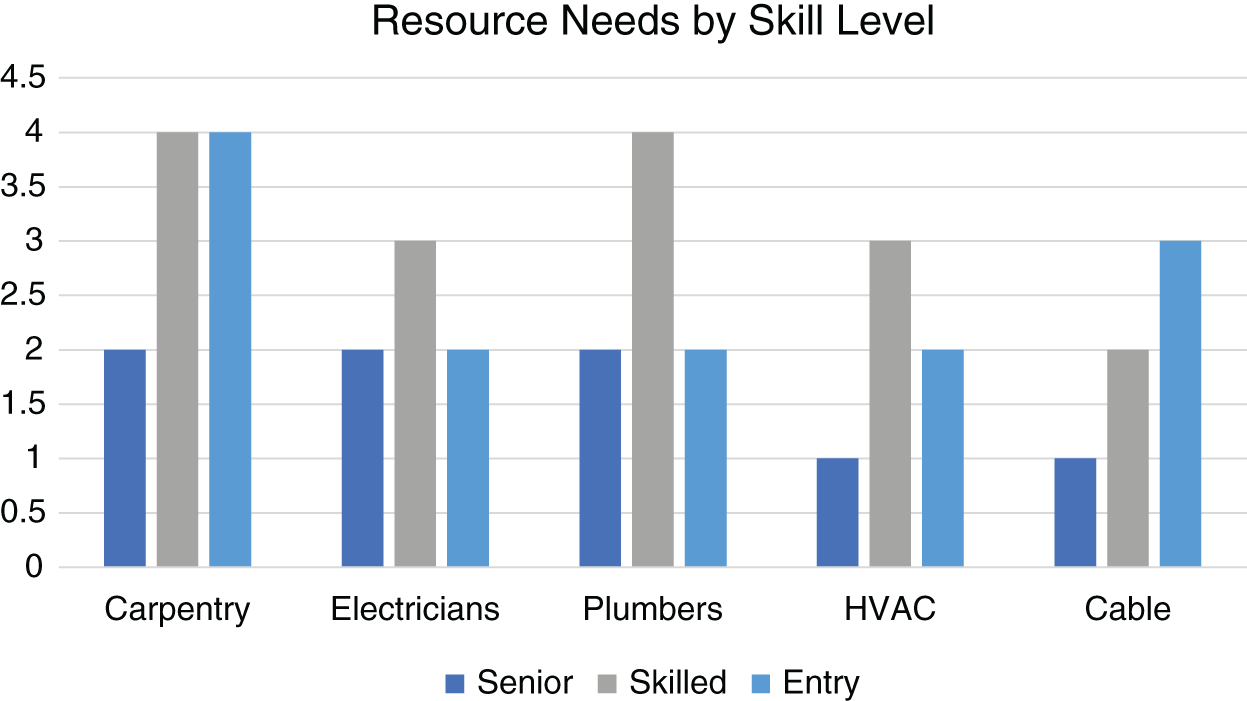
FIGURE 7‐4 Resource histogram with resource needs by skill level.
TABLE 7-3 Resource Chart
| Senior | Skilled | Entry | |
|---|---|---|---|
| Carpentry | 2 | 4 | 4 |
| Electricians | 2 | 3 | 2 |
| Plumbers | 2 | 4 | 2 |
| HVAC | 1 | 3 | 2 |
| Cable | 1 | 2 | 3 |
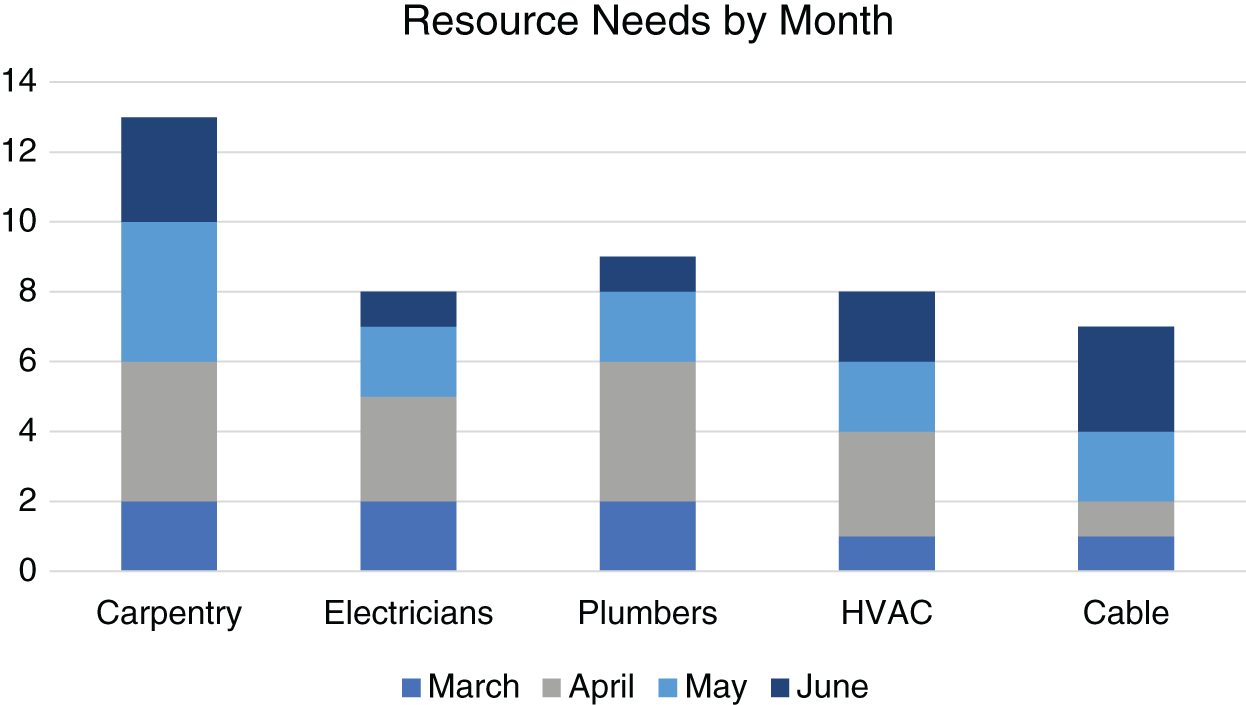
FIGURE 7‐5 Resource histogram with resource needs by month.
Another great use of a resource histogram is to show the number of resources you will need by skill level, by month, or in each location. Figure 7‐5 shows a resource histogram with resource needs by month.
This resource histogram shows a stacked bar chart rather than a column chart. There is no single correct way to chart your resource needs—use whichever method works best for you.
Role Descriptions
Many of the misunderstandings that occur on projects are a result of not having a clear understanding of the roles, competencies, responsibilities, and authority associated with each role. Having a document that clearly identifies this information can help minimize these types of misunderstandings. For example, you might record information like this:
Responsibility Assignment Matrix
A responsibility assignment matrix (RAM) is a matrix chart that shows the type of participation for each role (or team member) and each work package. Like the role descriptions, this chart provides clarity around expectations for each team member and reduces the likelihood of misunderstandings.
A common version of a responsibility assignment matrix is called a RACI chart because it documents who is responsible, accountable, consulted, and informed.
- The responsible person is the person doing the actual work. This may or may not be the same as the accountable person.
- The accountable person is the one answerable for a deliverable.
- Someone who is consulted may be a person who has done this type of work before, a stakeholder with an interest in the outcome, the customer, or even a consultant.
- The person who is informed needs to know the status of the deliverable. They may have a dependent deliverable, or it may be the project manager or another interested stakeholder.
Table 7‐4 shows a portion of a RACI chart using work packages and roles.
TABLE 7-4 Responsibility Assignment Matrix
| General contractor | Architect | Project manager | Cement contractor | Enculture manager | Production manager | |
|---|---|---|---|---|---|---|
| Requirements | I | I | I | R | A/R | |
| Drawings | C | A/R | C | C | C | |
| Excavation | A | R | ||||
| Foundation | A | R |
With a RACI chart it is important to note that each deliverable must have one and only one accountable person since there should only be one person who is answerable for the status and success of a deliverable.
A RACI chart is a very common version of a RAM, but it is certainly not the only one. It can be useful to include an “S” for sign‐off as well. If a sign‐off function was being used in the RAM above, the project manager might sign off on the requirements the production manager submitted and the drawings the architect submitted.
Selecting Team Members
You may not have the luxury of choosing your team members. If you do have input into selecting team members, there are several variables to consider. Even if you don't get to choose who is on your team, keep these variables in mind so you can optimize team performance.
- Skill level and experience: A team member with a lot of experience and a high degree of skill will be able to complete the work in less time, with less rework, and with a higher degree of quality than someone with less experience. However, they often have a higher hourly pay rate.
- Availability: Team members who can dedicate themselves to working on the project full time will be more productive than those who can only work on it part time. The more projects a person is working on at the same time, the less productive they are on any one project.
- Cost: A project that uses in‐house resources may not have to worry about the cost of team members, but if you are using contractors, you will want to consider the hourly or daily rate of team members.
- Attitude: Attitude can affect your project in a few ways. For example, a team member who really wants to work on the project may be a better fit for the team than someone with more experience who isn't excited about your project. Another aspect of attitude has to do with a person's general outlook. A person with a positive outlook is often a better team member than someone who is overly critical, combative, or negative.
- Flexible skill set: In Chapter 3 we talked about team members who are generalizing specialists, also known as T‐shaped people. Team members with a deep understanding of a specific skill and a broad understanding of many complementary skills can be a valuable asset to the team. They can support other team members if they fall behind and present ideas from a holistic perspective rather than from a narrow focus.
- Geography: If you have a project that requires the team to meet in person, geography can be a significant factor in assigning team members. However, if you have a partially or fully virtual team, you may be able to find team members with great skills and better rates than local talent. Keep in mind when establishing a virtual team, spending extra time on communications is critical. You want people to feel connected even though they don't get to see each other. In addition, when you can't read someone's body language, you miss some good communication cues, so establish as many communication channels as necessary to reduce the opportunities for misunderstandings is important.
Estimate Durations
Estimating the duration for the project, deliverables, or tasks takes place throughout the project—it is not a one‐time event. Techniques for estimating duration and effort are described in Chapter 10: “Estimating.” In this section we will differentiate between duration and effort and describe some of the variables that influence duration.
As you find out more information about the project, your estimates will become progressively more detailed and more accurate. At the beginning of the project you only have high‐level estimates, such as milestones in the project charter. Once you start building your schedule, you can get a reasonably good idea of the durations for deliverables. Then using progressive elaboration techniques, you can start to refine estimates even more by calculating not only the duration but the effort involved as well.
To understand the difference between effort and duration, assume you have a 40‐hour workweek and a task that requires 80 hours of effort.
- If you have two team members who are working full time, you can assume that it will take 5 days, or 1 business week, to accomplish the work. The calculation would be 80 hours/2 = 40 hours of duration.
- If you have only 1 resource working at 50%, it will take 20 days, or 1 business month, to get the work done. 80 hours/.5 = 160 hours of duration.
As noted in the previous section on selecting team members, variables such as skill set, experience, and availability can affect the effort required and the duration of tasks.
If you want to get really accurate, factor in the assumption that for every 40 hours spent at work, people are productive only about 34 hours. The rest of the time they are answering emails, participating in staff meetings, or engaged in other non‐project work.
At this point you will have an initial version of the schedule. However, your schedule is not ready for distribution yet. You will need to analyze it and likely find ways to compress it before you can baseline and share the schedule. We'll cover those topics in the next chapter.
SUMMARY
This chapter covers information on how to build a predictive schedule. The schedule management plan describes the scheduling methodology, tools, and how predictive and adaptive aspects of the schedule will be combined into an integrated master schedule.
We also looked at four steps used to build a predictive schedule:
- Identify tasks;
- Sequence tasks;
- Assign team members; and
- Estimate durations.
You start by decomposing work packages into tasks and then sequencing those tasks to create a network diagram. Once team members are assigned, they can help estimate task durations, and effort if necessary.
Key Terms
- authority
- competency
- critical path
- critical path methodology
- duration
- effort
- finish‐to‐finish
- finish‐to‐start
- integrated master schedule
- iteration
- lag
- lead
- network diagram
- RACI chart
- release
- release plan
- resource breakdown structure
- resource histogram
- resource loading
- responsibility
- responsibility assignment matrix (RAM)
- role
- schedule management plan
- start‐to‐start
- story points
- summary task
- task
- task board