
CHAPTER 20
Network Monitoring
The CompTIA Network+ certification exam expects you to know how to
• 3.1 Given a scenario, use appropriate documentation and diagrams to manage the network
• 3.3 Explain common scanning, monitoring and patching processes and summarize their expected outputs
• 5.2 Given a scenario, use the appropriate tool
• 5.3 Given a scenario, troubleshoot common wired connectivity and performance issues
To achieve these goals, you must be able to
• Explain how SNMP works
• Describe network monitoring tools
• Discuss a scenario that uses management and monitoring tools
A modern network doesn’t behave properly without regular or irregular intervention from network technicians. Techs need to install network management tools and then deploy other tools to monitor, troubleshoot, and optimize networks over time. Because IP networks dominate today, we have a standard set of free tools to accomplish these goals.
This chapter looks first at network management tools, then examines the monitoring tools available and in common use. The chapter finishes with scenarios that call for deploying specific tools, analyzing their output, and fixing problems. For that final section, we’ll revisit the Bayland Widgets Corporation and their campus area network (CAN) first discussed back in Chapter 17, “Building a Real-World Network.”
Test Specific
SNMP
A quick Google search for network monitoring tools finds literally hundreds of products out there, ranging from complex and expensive to simple and free (Figure 20-1). One thing most of them have in common is the underlying protocol that enables them to work. The Simple Network Management Protocol (SNMP) is the de facto network management protocol for TCP/IP networks (and it comes dragging in a truckload full of jargon terms to describe the various components).
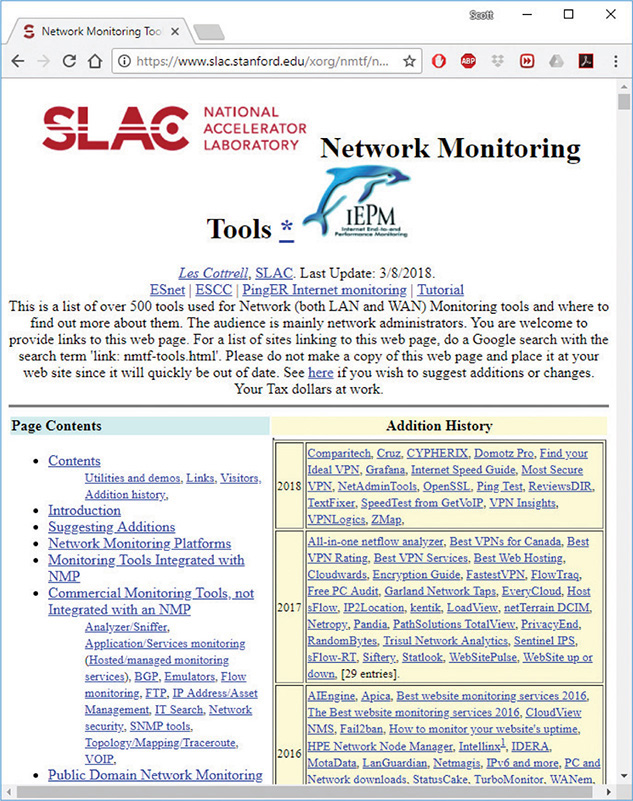
Figure 20-1 Massive list of network monitoring tools maintained by the SLAC National Accelerator Laboratory
An SNMP system—which creates a managed network—consists of at least three components:
• SNMP manager
• Managed devices
• Management information bases
The SNMP manager requests and processes information from the managed devices. The SNMP manager runs specialized software called a network management station (NMS). Managed devices run specialized software called agents. Managed device types include workstations, printers, video cameras, routers, switches, and more. Figure 20-2 illustrates the basic SNMP hardware.
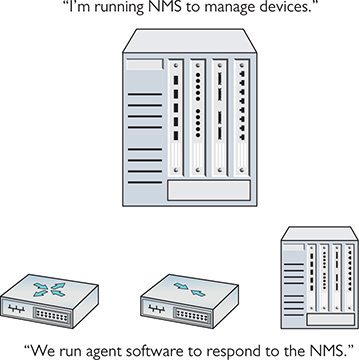
Figure 20-2 SNMP components
The kind of information the SNMP manager can monitor from managed devices varies a lot, primarily because SNMP is an extensible protocol, meaning it can be adapted to accommodate different needs. Developers can create software that queries pretty much any aspect of a managed device, from current CPU load on a workstation to how much paper is left in a printer. SNMP uses management information bases (MIBs) to categorize the data that can be queried (and subsequently analyzed).

EXAM TIP The CompTIA Network+ objectives use the term SNMP monitors, under which you’ll find the term MIB. This is shorthand for the various tools that use SNMP for monitoring network devices, plus the MIBs that inform those monitoring tools about what can be monitored on a specific device. This whole chapter discusses monitoring tools, many of which go hand in hand with SNMP. MIBs are a huge part of SNMP monitoring, though they are not monitoring tools in and of themselves. Got it?
Once set up properly, an SNMP managed network runs regular queries to managed devices and then gathers that information in a format usable by SNMP operators. We need to add a little more jargon to go through the steps of the process.
An SNMP system has up to eight core functions (depending on the version of SNMP), of which four merit discussion here: Get, Response, Set, and Trap. The common term for each of these functions is protocol data unit (PDU).

NOTE An SNMP PDU is not related to the PDU discussed earlier with OSI. It’s the typical tech sector practice of repurposing an excellent term.
When an SNMP manager wants to query an agent, it sends a Get request, such as GetRequest or GetNextRequest. An agent then sends a Response with the requested information. Figure 20-3 illustrates the typical SNMP process.
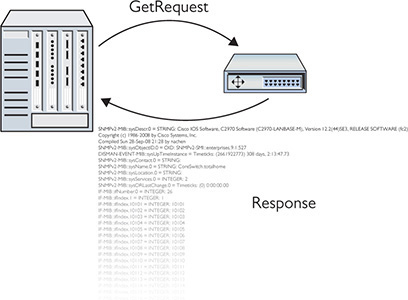
Figure 20-3 Simple SNMP process
An NMS can tell an agent to make changes to the information it queries and sends, called variables, through a Set PDU, specifically SetRequest.
An agent can solicit information from an NMS with the Trap PDU. An agent can send a Trap with or without prior action from the SNMP manager, at least from SNMPv2 to the current SNMPv3.
I’ve just dropped a lot of jargon on you, so here’s a scenario that will make the process and terms a little more understandable. The Bayland Widgets art department has a high-end color laser printer for producing brochures (Figure 20-4). Their CompTIA Network+ certified technicians maintain that laser printer, meaning they replace toner cartridges, change paper, and install the printer maintenance kits. (They’re also CompTIA A+ certified, naturally!)
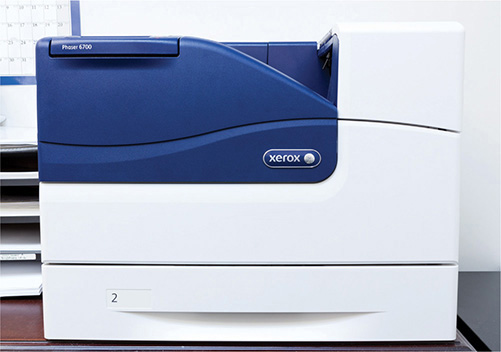
Figure 20-4 The Bayland Widgets art department printer
To manage this printer, nicknamed “Kitty,” the techs use an SNMP network management system. At regular intervals, the NMS sends a GetRequest to the printer agent about the number of pages printed. According to the Response sent from the printer agent to the NMS, the techs can determine if the printer needs maintenance (that is, if it’s at the point in its usage cycle where the printer maintenance kit parts need to be replaced).
At irregular intervals, the printer agent has to tell the techs that the printer is out of toner or out of paper. Although this information could come from the Get/Response interaction, it makes more sense that it come from the printer agent without a query. Kitty needs to yell “Help!” when she’s out of toner. Otherwise the techs have to deal with irate artists, and that’s just never going to be pretty. Kitty yells for help by sending a Trap to the NMS. Figure 20-5 illustrates the interaction.
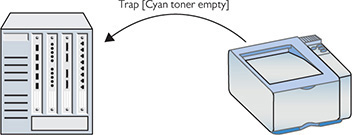
Figure 20-5 Trap in action
SNMP systems can use many additional utilities developed over the years. Some can automate various tasks. The snmpwalk utility, for example, tells the SNMP manager to perform a series of Get commands.
The BWC network techs don’t sit at the SNMP manager, waiting for Kitty the printer to send messages about toner or ink. Instead, the manager software has the event management capability to send alerts: notifications directly sent to the techs when their intervention is required. These notifications can have a variety of forms. When the SNMP system was initially rolled out, one snarky manager suggested using text messages via Short Message Service (SMS) alerts that would cause techs’ smartphones to meow upon receipt. That idea was nixed pretty early in favor of e-mail alerts (without any lolcat pictures attached).
SNMP has (as of this writing) three major versions. SNMP version 1 (SNMPv1) appeared in three requests for proposals (RFPs) all the way back in 1988. SNMPv2 was a relatively minor tweak to version 1. SNMPv3 added additional security with support for encryption and robust authentication, plus it provided features to make administering a large number of devices easier.
SNMP uses User Datagram Protocol (UDP) ports 161 and 162 for nonsecure communication. The NMS receives/listens on port 162. The agent receives/listens on port 161. When security is added via Transport Layer Security (TLS) the standard ports used are 10162 and 10161, respectively.
EXAM TIP SNMP managers listen on UDP ports 162 or 10162 (with TLS). Agents listen on ports 161 or 10161 (with TLS).
Monitoring Tools
The biggest trick to monitoring a network is to start by appreciating that even the smallest network has a dizzying amount of traffic moving through it every second. Even more, this traffic is moving through all kinds of different aspects of the network, from individual interfaces coming from a single NIC in a system to everything moving through a massive router on the edge of your infrastructure.

SIM Check out the Chapter 20 “SNMP Monitoring” Show! and Click! sims at http://totalsem.com/007. The pair offer a great, practical introduction to SNMP tools.
To be able to do the monitoring, the troubleshooting, and the optimizing necessary to keep our networks in top shape, we need the right monitoring tools at the right places looking for the right things. There are hundreds of different monitoring tools available, but for the scope of the CompTIA Network+ exam, we can break them down into four major types: packet sniffers, protocol analyzers, interface monitors, and performance monitors.
Packet Sniffers
A packet sniffer (or just sniffer) is a program—a software tool—that queries a network interface and collects (captures) packets in a file called (surprisingly) a capture file. These programs might sit on a single computer, or perhaps on a router or a dedicated piece of hardware. The typical scenario for their use is one where network access/probing by a bad actor is suspected.
Packet sniffers need to capture all the packets they can, so it’s typical for them to connect to an interface in promiscuous mode or, in the case of a switch, a mirrored port. This ensures they get as much data as possible. They run silently and transparently in the background.
Packet sniffers are essential information-gathering tools, but we also need a tool to enable analysis of the captured packets. For this reason, you don’t really see packet sniffers as a stand-alone product. Instead, they are usually packaged with a protocol analyzer (see next section).
Protocol Analyzers
A protocol analyzer is a program that processes capture files from packet sniffers and analyzes them based on our monitoring needs. (You’ll also hear the tool referred to as packet analyzer, though the exam uses the former term.) A good protocol analyzer can filter and sort a capture file based on almost anything and create an output to help us do monitoring properly. In other words, a protocol analyzer performs packet/traffic analysis. A typical question a protocol analyzer might answer is “What is the IP and MAC address of the device sending out DHCP Offer messages and when is it doing this?”
NOTE Various names are used to describe utilities that analyze packets: packet sniffer, packet analyzer, protocol analyzer, and network analyzer. There’s so much overlap here! That can be attributed to the fact that so many protocol analyzers come with sniffers as well. Bottom line, don’t rely on the name of the monitoring tool to determine all it can do. Read the tech specs.
Protocol Analyzing with Wireshark
There are plenty of protocol analyzers available out there, but you’d be hard pressed to find a network administrator/technician/whatever who isn’t familiar with the powerful and free Wireshark. It was originally written by Gerald Combs, who still maintains the program with the help of hundreds of contributors. Wireshark is the perfect prototype of a protocol analyzer.
The default Wireshark screen has become the standard most other protocol analyzers are based on. You select an interface to begin the capture and let the capture begin (Figure 20-6).
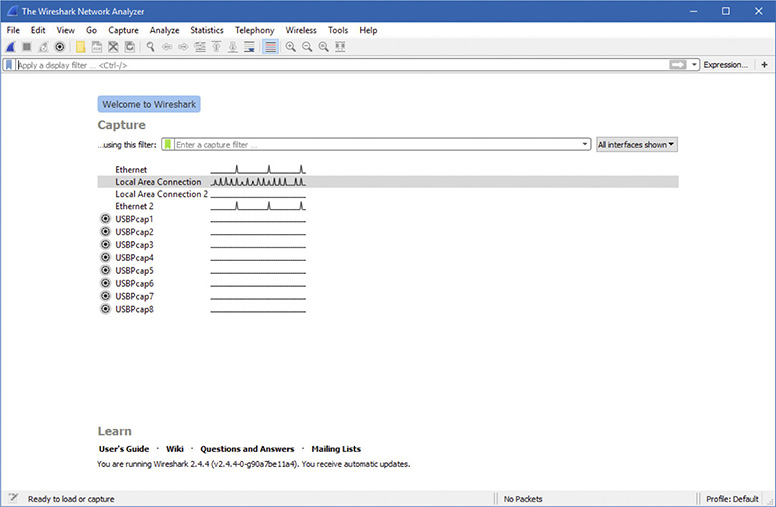
Figure 20-6 Wireshark default window
When you stop the capture, you’ll see something like Figure 20-7. Wireshark’s screen breaks into three parts. The top part is a numbered list of all the packets in the capture file, showing some of the most important information. The second part is a very detailed breakdown of the packet that is currently highlighted in the top pane. The bottom pane is the hex representation and the ASCII representation of whatever part of the second pane is detailed.
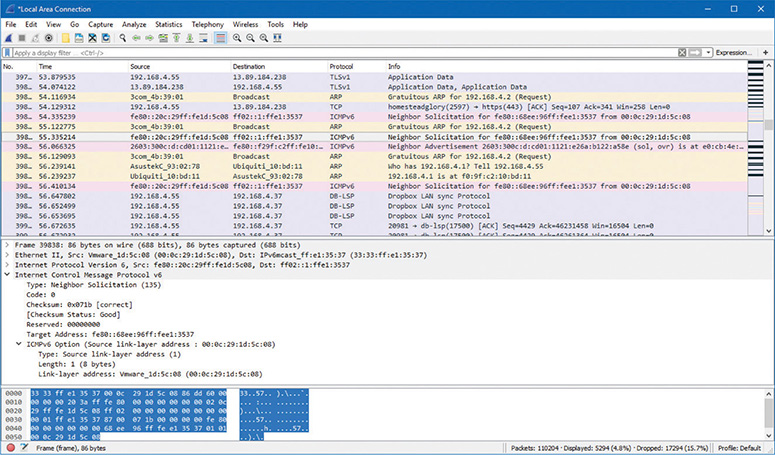
Figure 20-7 Wireshark capturing packets
The downside to a capture is that Wireshark is going to grab everything unless you filter the capture or filter the capture file after the capture. In many cases you’ll find yourself doing both. Figure 20-8 shows a filter added to a capture file to only show DHCP packets.
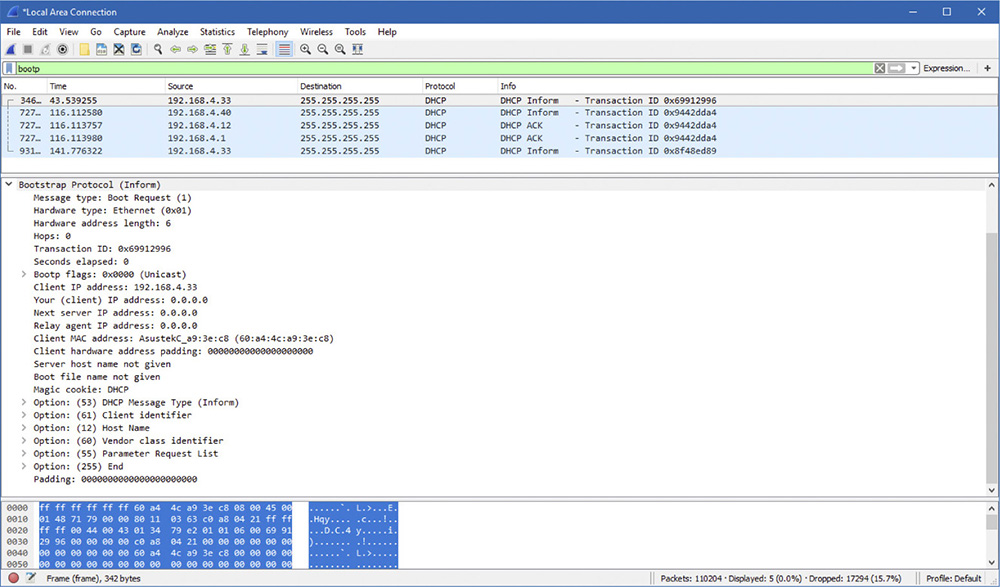
Figure 20-8 Wireshark filter
Note that the filter doesn’t actually say “DHCP.” Wireshark uses the term bootp because it follows the same structure as its predecessor. All the other Wireshark filters use the acronym you’d expect today, such as dns, ssh, http, and so on.
Packet Flow Monitoring with NetFlow
Packet flow monitoring, accomplished with a set of tools related to general packet sniffers and analyzers, tracks traffic flowing between specific source and destination devices. Cisco developed the concept of packet flow monitoring and subsequently included it in routers and switches. The primary tool is called NetFlow.
NetFlow has been around for quite a while and has evolved into a powerful tool that just about every Cisco house uses. NetFlow is similar to SNMP, but different. NetFlow is based on the idea of flows that you define to track the type of traffic you wish to see.
A single flow is a flow of packets from one specific place to another. Each of these flows is then cached in a flow cache. A single entry in a flow cache normally contains information such as destination and source addresses, destination and source ports, the source on the device running that flow, and total number of bytes of that flow.
Analyzing the flow data enables administrators to build a clear picture of the volume and flow of traffic on the network. This in turn enables them to optimize the network (by adding capacity where needed or other options).
NOTE To use NetFlow you must enable NetFlow on that device. If the device doesn’t support NetFlow, you can use stand-alone probes that can monitor maintenance ports on the unsupported device and send the information to the NetFlow collector.
Most of the heavy lifting of NetFlow is handled by the NetFlow collectors. NetFlow collectors store information from one or more devices’ NetFlow caches, placing it into a table that can then be analyzed by NetFlow analysis tools.
There are many different companies selling different tools, and which tool you should choose is often a matter of features and cost. Figure 20-9 shows a screenshot of a popular tool called LiveAction.
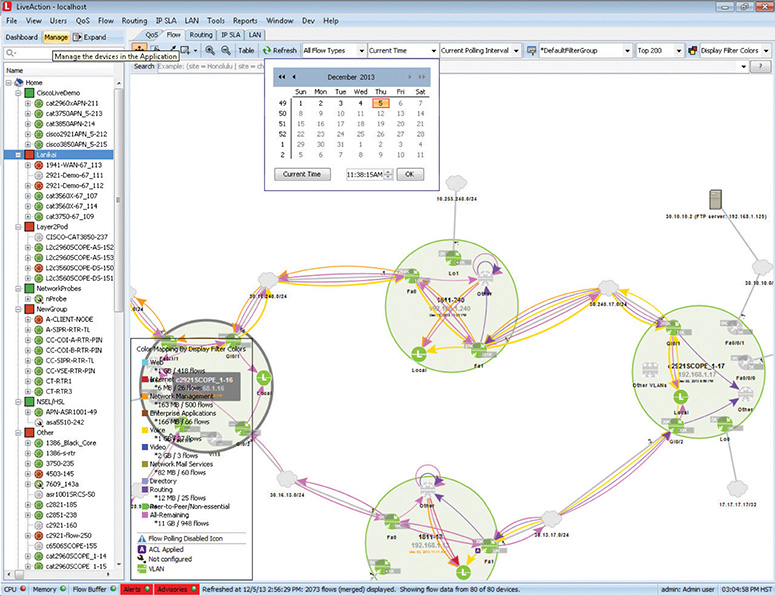
Figure 20-9 LiveAction in action!
Cisco’s NetFlow started the idea of traffic flows that can then be collected and analyzed. Just about every other form of competing flow-monitoring concept (names like sFlow, NetStream, and IPFIX) builds on the idea of the flow.
Interface Monitors
If you want to know how hard your network is working, turn to an interface monitor. Interface monitors track the bandwidth and utilization of one or more interfaces on one or more devices. Think of them as the traffic monitors for your network. A typical question you might ask an interface monitor is “How hard is the Gigabit Ethernet port 17 on our backbone switch working right now, in megabits per second?”
Interface monitors track the quantity and utilization of traffic through a physical port or ports on a single device. Interface monitoring will consist of, among other items, the following metrics (performance and use option numbers):
• Bandwidth/throughput At what speed is the port set to run? What duplex is the port running?
• Utilization How much of the total bandwidth of the port is being used?
• Packet drops A port will drop a packet for one of two reasons: an error or a discard.
• Error rate How many packets per second are errors? A port treats a packet as erroneous if the packet is malformed or unreadable.
• Discards How many frames are discarded per second? A discard is when a port intentionally drops a well-formed frame. A discard is not an error. There are many reasons for a port to discard a frame. If a port is trunking VLANs 1 and 2 and it gets a frame for VLAN 3, the port will discard the packet.
• Interface resets Is the interface being reset at any time? If so, how often is this taking place?
Interface monitors started as manufacturer-specific tools, and although there are plenty of interface monitors that work on just about any platform, the manufacturer-specific ones are still very common.
The Cisco Network Assistant (CNA) software enables you to monitor Cisco routers and switches. Figure 20-10 shows the percent of utilization for a specific port on a Cisco switch. Figure 20-11 shows the packet drops and errors on that same port.
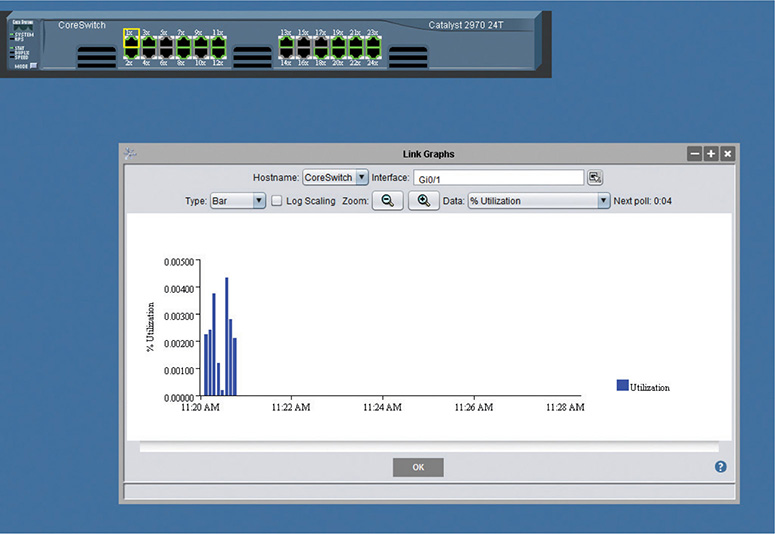
Figure 20-10 Percent of utilization of switch port 1
Contrast Figure 20-11 with Figure 20-12 showing CNA examining switch port 13 for drops and errors. That’s a misbehaving port!
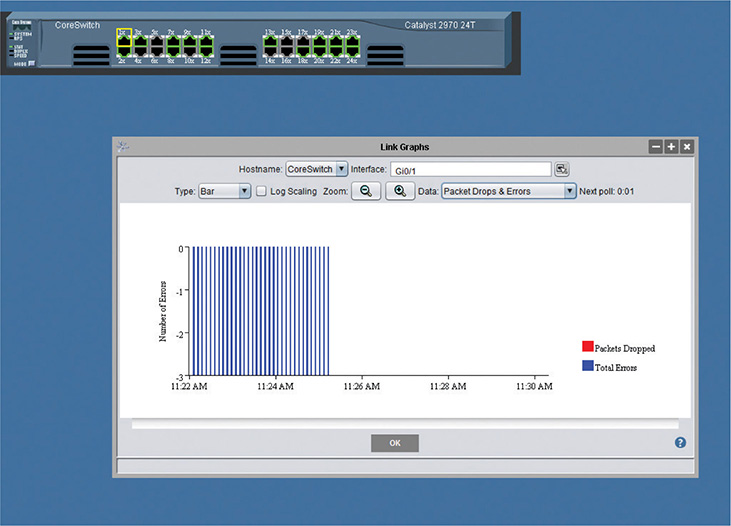
Figure 20-11 Hmm…looks pretty clean
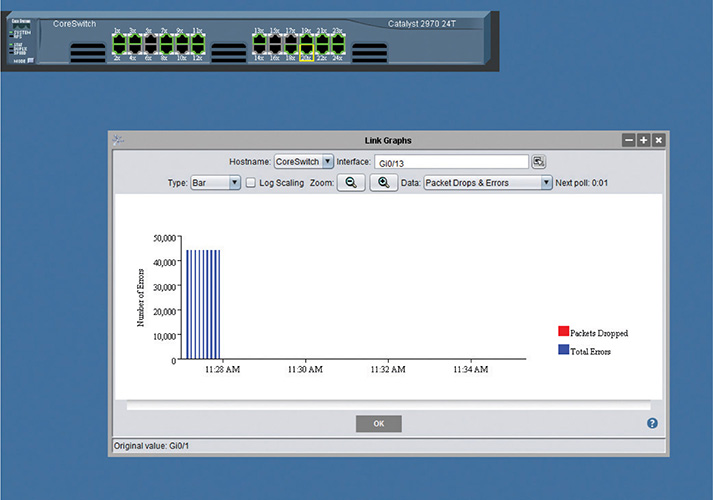
Figure 20-12 Ouch. That’s a lot of errors!
NOTE Limiting the description of CNA to an “interface monitor” completely sells the software short. It can monitor individual ports on a switch, but you can use the program to set up, manage, maintain, and troubleshoot all the functions of the switch. It’s much more powerful a tool than just an interface monitor.
Performance Monitors
A performance monitor tracks the performance of some aspect of a system over time and lets you know when things aren’t normal. Performance monitors are usually tied to a particular operating system or application, as the performance monitoring requires very detailed understanding of the low-level aspects of the system. A typical question you might ask a performance monitor is “How many hits per hour occurred on my Web server over the last two weeks?”
The two most common performance monitoring tools are Windows Performance Monitor (PerfMon) and syslog (found in macOS and Linux). Although they perform the same job, I want to introduce both tools to you because they do that job very differently … and use very different terms to describe the same things. As we next look at certain aspects that are common to any good performance monitor, I’ll use the terminology for both tools.
This section explores the processes and expected outputs for log reviewing and reviewing baselines. We’ll start with definitions of logs and then move into the active processes of reviewing.
NOTE The term performance monitor is not an industry term but instead just a handy way to discuss several utilities with similar functions that you should know. Also, PerfMon is a unique Linux tool for performance monitoring. It just happens to share the same name as Windows Performance Monitor.
Logs
Performance monitors use system log files to track performance over time. Logs store information about the performance of some particular aspect of a system. Different programs refer to the monitored aspect with different terms. Performance Monitor calls them counters; syslog calls them facilities. A log file might record the percentage of utilization over time of a specific Ethernet port, for example, or the average throughput of a network connection.
Baselines
The only way to know when a problem is brewing on your network is to know how things perform when all’s well with the network. Part of any proper performance monitor is the facility to create a baseline: a log of performance indicators such as CPU usage, network utilization, and other values to give you a picture of your network and servers when they are working correctly. A major change in these values can point to problems on a server or the network as a whole.
A typical scenario for baselines is for techs and administrators to create and use appropriate documentation and diagrams for how the network optimally performs. They use this information to manage the network over time. The CompTIA Network+ exam objectives use the phrase network configuration and performance baselines to describe the documentation and diagrams needed in this process.
All operating systems come with some form of baseline tools. Performance Monitor is the common tool used to create a baseline on Windows systems.
Log Management
Any system that generates electronic log files has two issues. First, is security. Log files are important for the information they provide. Second, is maintenance. Log files are going to continue to grow until they fill the mass storage they are stored on. The job of providing proper security and maintenance for log files is called log management.
Logs often contain private or sensitive data and thus must be protected. Access to active logs must be carefully controlled. It’s very common to give read access rights only to specific users, to make sure only the correct users have access to the log files. In many cases it’s not uncommon for the logging application to have only write access to the files—it’s not a good idea to give root access to critical log files.
Generally, log files by default simply grow until they fill the space they are stored on. To prevent this, it’s common to make log files cyclical—when a file grows to a certain size, it begins to cycle. Cycling just means that as a new record appears in the file, the oldest record in the file is deleted. It’s also common for log files to be re-created on a time basis. Depending on the utility, you can set a new log file to be created daily, weekly, hourly—whatever is most convenient for the administrators. These files can then be backed up.
There are many laws today that require retention of log files for a certain period of time. It’s important to check with your legal department to see if any files need to be kept longer than your standard backup time frames.
Putting It All Together
Up to this point in the chapter, we’ve looked at management and monitoring tools as distinct things, easy to label and easy to differentiate. And in a small office/home office network, that kind of simplicity makes sense. If you have a Windows-based network with a single server running Windows Server, then of course you’d use Windows Performance Monitor to baseline and monitor your network over time. The CompTIA Network+ competencies lead to this modular thinking as well. Once you scale up past the one-server network, though, things get a lot more … chaotic isn’t quite the right word … nuanced is better. Let’s take a look.
Scenario: Monitoring and Managing
This scenario revisits the Bayland Widgets CAN and applies the network managing and monitoring tools to see how their techs would use these tools to manage, monitor, maintain, and troubleshoot their network.
Figure 20-13 shows the BWC campus layout with its three main buildings. The main office has servers and various individual offices. The factory houses the robots and control systems that produce the company’s widgets. The warehouse and shipping building does exactly as it’s named.
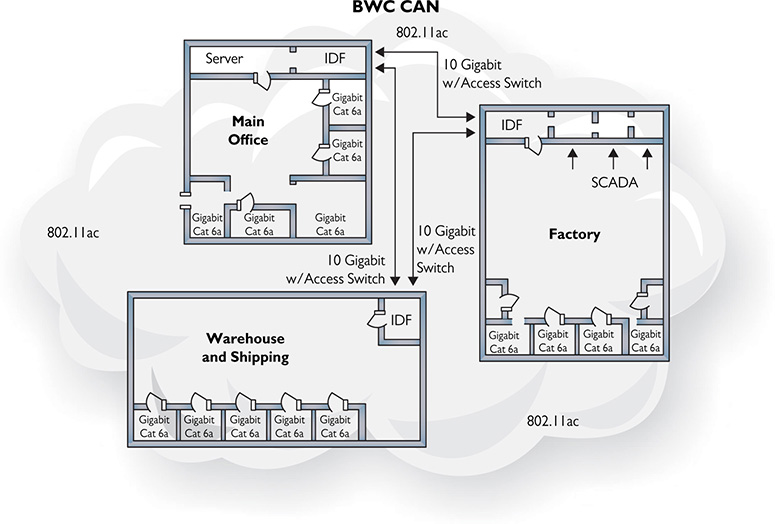
Figure 20-13 Diagram of Bayland Widgets’ campus area network
Internally, each building is wired with Gigabit Ethernet. In addition, the buildings interconnect with 10-Gigabit fiber into access switches. Add onto that a campus-wide Wi-Fi network (802.11ac) and, not pictured, the router that gives them access to the Internet.
Since we’re talking about managing and monitoring the whole network here, let’s list all the types of networked devices:
• Routers (wired and wireless)
• Switches
• Wireless access points
• Servers
• Workstations
• Printers
• Phones
Note that I’ve left out the industrial control systems that run the factory and shipping automation. Plus, I’ve left out the security systems and other essential components of a functional CAN. This list focuses on the core networking devices that a CompTIA Network+ tech would encounter.
Modern networking tools enable skilled network administrators to manage networks as complex at Bayland Widgets’ network fairly easily, after those tools have been set up properly. The tools used must be customized for the network. Plus, the various tools aren’t really interchangeable. Just like you wouldn’t use a hammer when you need to turn a screw, you wouldn’t use a protocol analyzer when you want to check toner levels in a laser printer.
Bayland Widgets could dedicate an area in the main office as a network operations center (NOC), a centralized location for techs and administrators to manage all aspects of the network. From that NOC, they could use various programs on the SNMP-managed network to query devices. A graphing program could create graphs and diagrams that display any set of the data received.
Graphing programs like Cacti would show everything about specific switches, for example, to determine utilization of that switch in many aspects—that is, how well it handles its current work load. Figure 20-14 shows Cacti with four graphs depicting network device CPU utilization, memory usage, traffic (bandwidth usage) on the WAN interface, and traffic to the file server.
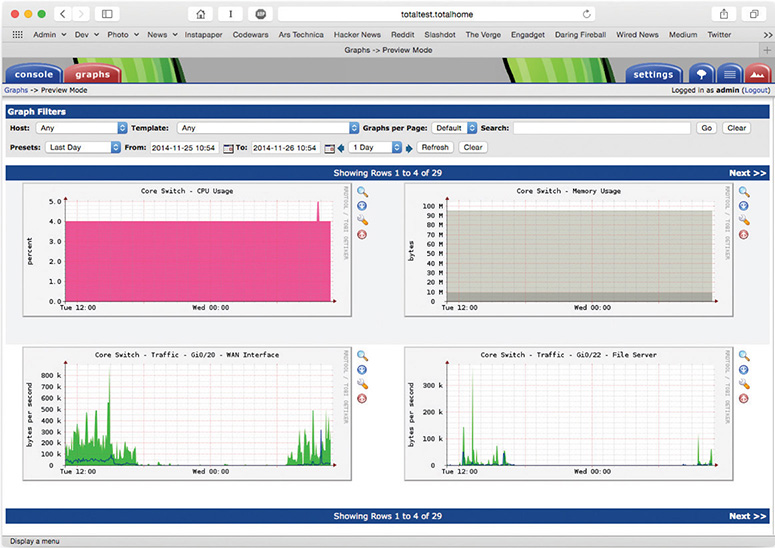
Figure 20-14 Cacti showing switch utilization graphs
With a different query, Cacti can graph available storage on a file server (Figure 20-15), or wireless channel utilization.
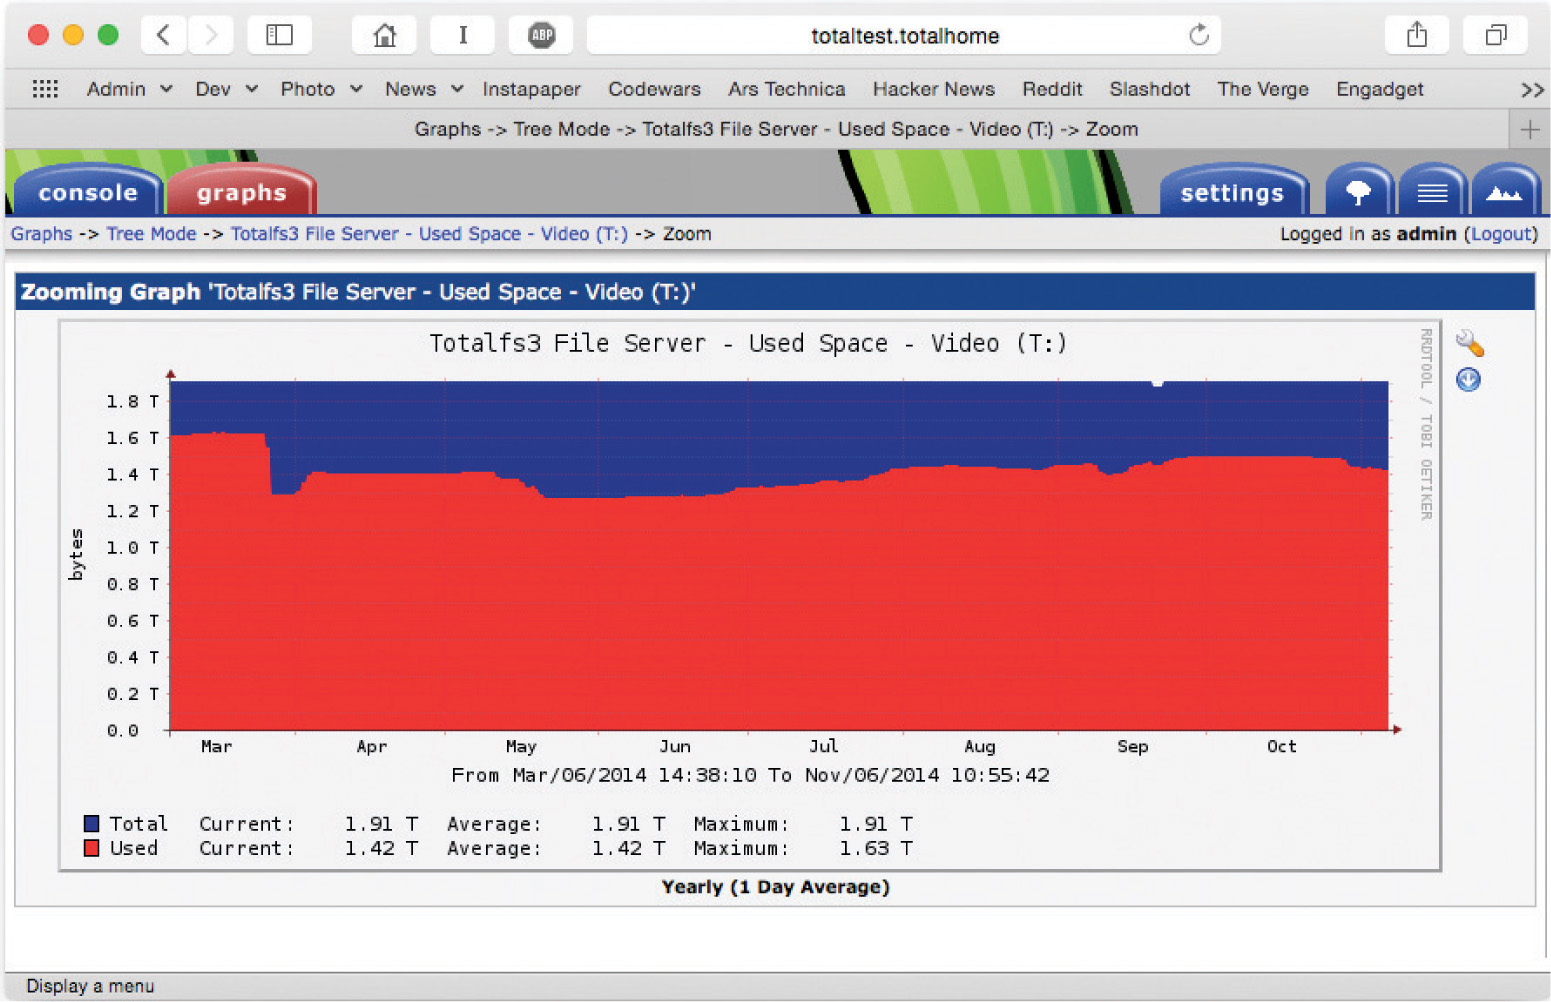
Figure 20-15 Cacti showing file server storage utilization graph
Cycling through the various network monitoring tools enables network administrators to see very quickly if a specific server or other device has problems. They could analyze the campus Wi-Fi network with a Wi-Fi analyzer and spot a problematic WAP. Going a little further up the food chain, BWC could add Nagios Network Analyzer to their network toolboxes and, after proper configuration, have that system proactively send alerts via SMS or e-mail when problem areas were detected. If the link status—signifying how good the connection is between two systems—between the two access servers connecting the main office and the factory goes red, that’s a whole different level of priority than if Kitty the art printer runs low on toner, right?
EXAM TIP Programs like Cacti enable you to see very quickly essential facts about your network hardware. You can see available storage, network device CPU usage, network device memory usage, and more. With wireless-aware tools, you can quickly spot problems with wireless channel usage or channel saturation. These tools are a tech’s friend!
Each type of tool discussed in this chapter enables the network team at BWC to monitor and analyze all aspects of the network. The SNMP system offers very specific information about managed devices, enabling techs to respond to problems.
Performance monitoring software enables the BWC techs to create baselines when the network is functioning correctly. In a scenario where complaints about network performance come in from one portion of the network (Accounting, for example), that same software can be used to compare current network performance with the historical, normal performance. If there’s a discrepancy, the techs can turn to other tools—packet flow analyzers and interface monitors—to figure out if the issue is excess traffic, failing devices, failing interfaces on a device, or an overworked bottleneck (a spot where traffic slows precipitously).
Network analyzers and packet flow analyzers can discover the busiest machines on the network, potentially sources of overall network slowdowns. Top talkers are the computers sending the most data, whereas top listeners are the ones receiving the most. If BWC is worried about a malware problem, finding that the computer assigned to Joe in Accounting is the top talker might track down that spam infestation.
The network techs turn to a packet sniffer/analyzer tool when they need to go deep into the traffic. Here’s an example of when Wireshark might be the tool to start. BWC wants to move the network to IPv6 and turn off all IPv4 traffic. Turning off IPv4 on a test machine would be a good check on how ready the network is for IPv6. We did that the other day in my office, for example, and found that the test machine couldn’t see anything on the network at all. Running Wireshark enabled us to see if the router was sending out IPv6 router advertisements with DNS. When we confirmed that information, the next step was more old-fashioned. Had we misconfigured the test workstation’s IPv6 settings?
Accomplished techs use a variety of managing and monitoring tools to maintain a healthy network. Use each type of tool when that tool is appropriate. Often, you’ll need to use multiple tools during a longer troubleshooting scenario.
SIEM
The Bayland Widgets people could use an approach called security information and event management (SIEM) to monitor and manage their network. SIEM is an industry-standard term, but there are many products of various types that are marketed as SIEM solutions. SIEM is a mashup of two processes: security event management (SEM) and security information management (SIM).
As the name would imply, SIEM is a two-part process that begins with the security event monitoring component. SEM is based on real-time monitoring of security events. The SEM framework calls for monitoring the entire enterprise, often through edge devices at monitor points, then saving the logged events to a location that supports single viewpoint review and analysis of the events. In addition to active event monitoring, another task of SEM is to collect and centralize otherwise disparately located security and event logs.
Once logs are created and saved, the second part of SIEM, security information management, kicks in: here, the log files are reviewed and analyzed by automated and human interpreters.
One place SIEM comes into play is with file integrity monitoring (FIM), checking for changes in all sorts of aspects of files. These include
• Attributes and file size
• Configuration values
• Content
• Credentials
• Hash values
• Privileges and security settings
Any changes discovered could indicate that an attack has occurred or is happening right now. The verification process compares a baseline or known good copy of the file with the current file, checking for differences.
SIEM systems are complex solution suites that are found in large, enterprise environments. Depending on the organization, they may be self-implemented and managed or may be administered under contract by a vendor in the form of a managed security service provider (MSSP).
Chapter Review
Questions
1. Which PDU does an SNMP manager use to query agents?
A. Get
B. Response
C. Set
D. Trap
2. In an SNMP managed network, which software does a managed device run?
A. Agent
B. NMS
C. SNMP manager
D. MIB
3. How does an SNMP managed system categorize data that can be queried?
A. QoS
B. MIBs
C. PDUs
D. UDP
4. An SNMP manager listens on which port when used with TLS?
A. 161
B. 162
C. 10161
D. 10162
5. Jason is concerned about the communication between two workstations and wants to capture and analyze that traffic to see if anything illicit is going on. Which tool would best serve his needs?
A. Interface monitor
B. Packet flow monitor
C. Packet sniffer
D. Performance monitor
6. Where does a packet sniffer put information it collects?
A. Answer file
B. Capture file
C. Pocket file
D. Sniffer file
7. An analysis of a network shows a lot of traffic on one machine on port 161. What kind of machine is it?
A. Managed device
B. SNMP manager
C. PDU
D. MIB
8. What should you create when a network is running correctly?
A. Answer file
B. Capture file
C. MIB
D. Baseline
9. Bart has a choice of tools to view his managed network, but he primarily wants to see graphs of various types of data, such as the overall traffic and the current capacities of the file servers. Which tool offers him the best option?
A. Cacti
B. CNA
C. NetFlow
D. Wireshark
10. What tool enables you to compare current network performance with correctly functioning network performance?
A. Baseline monitor
B. Packet flow monitor
C. Packet sniffer
D. Performance monitor
Answers
1. A. SNMP managers use Get PDUs to query agents.
2. A. Managed devices run agent software.
3. B. SNMP managed systems use management information bases to categorize data to be queried.
4. D. An SNMP manager listens on port 10162 when used with TLS.
5. B. Jason would use packet flow monitoring software to monitor the flow between two devices.
6. B. Packet sniffers put information in capture files.
7. A. Managed devices listen on port 161.
8. D. Create a baseline so you can compare network performance later on.
9. A. Cacti is a great graphing tool.
10. D. A performance monitor enables you to compare current network performance with a baseline.