
C H A P T E R 13
![]()
Debugging, Caching, and Deployment
In this, the final chapter, we'll take a look at a range of topics, including:
- Debugging ASP.NET Web Pages
- Improving performance through caching
- Search Engine Optimization (SEO)
- Publishing your WebMatrix site to the World Wide Web.
By the end of this chapter, and therefore the end of this book, you will have gained all the knowledge necessary to build and deploy dynamic, data-driven web sites using Microsoft WebMatrix.
Let's start the chapter with a discussion about debugging: the art of finding and removing errors.
Debugging ASP.NET Web Pages
Debugging really is an art. It is the combination of a number of different techniques that assist the developer in finding and fixing errors in his or her code.
![]() Note It's even harder to find and fix errors in someone else's code, which is why it is so important for you to keep your code readable and well documented: you may not be the only one who maintains your code in the future.
Note It's even harder to find and fix errors in someone else's code, which is why it is so important for you to keep your code readable and well documented: you may not be the only one who maintains your code in the future.
Whole books have been written about debugging. The art of debugging is a skill that you will hone over time as you gain experience tracking down and fixing bugs. You will learn which techniques work best in certain situations and which tools can be used to identify problems.
The best debugging technique is performed before any code is ever executed. Through a combination of experience and logical thought, you can eliminate most bugs before they ever become a problem.
By using code to deal with a user entering unexpected or unusual values, for example, you can prevent a lot of errors. Specifically, if you are developing code that retrieves a database record about a customer based on the user entering a valid customer ID, you should anticipate what would happen if no matching record is found. Should we let the web server display an error message, such as a NullReferenceException, or should we write code to deal with it in a better way, such as having the program display a helpful message to the user and provide links to useful pages?
As you gain more and more experience writing code in any language, you will become better able to identify and eliminate potential bugs and errors as well as write code to deal with or prevent them. However, no matter how good you are, you will never be able to write bug-free working code the first time, every time.
In this section, we'll look at some of the ways that WebMatrix can help with the process.
Displaying Server Information
Sometimes, in order to track down a bug, it is useful to be able to view information about the environment in which the web site is running. Rather than having to interrogate individual server properties, WebMatrix provides the ServerInfo helper class, which gives a broad overview of what is typically considered the most useful information, including data about the server hardware, operating system, current user, server variables, and HTTP runtime.
The information provided by the ServerInfo class is shown in the browser and is split across four tables. The list below describes the kind of information you can expect to see in each table:
- Server Configuration: Local time at the server, culture, server machine name, operating system, current user name, ASP.NET version, operating system version, etc.
- ASP.NET Server Variables: Physical path of the web application, path of the current page, information about any currently authenticated user, HTTP request method (i.e., GET or POST), server name, etc.
- HTTP Runtime Information: Path of important directories, such as the .NET Framework CLR directory and the ASP.NET installation directory, as well as information about the cache.
- Environment Variables: Information about the server hardware, such as processor information; paths of important system folders, such as Program Files and Windows installation; value of the
pathenvironment variable on the server.
![]() Note Readers with previous experience using PHP will no doubt notice similarities between the output of the WebMatrix
Note Readers with previous experience using PHP will no doubt notice similarities between the output of the WebMatrix ServerInfo helper and the phpinfo() function.
To display the output of the ServerInfo helper, you must call its GetHtml() method. The following code produces the output seen in Figure 13-1:
<!DOCTYPE html>


<html lang="en">

    <head>

        <meta charset="utf-8" />

        <title>ServerInfo Example</title>

    </head>

    <body>

        @ServerInfo.GetHtml()

    </body>

</html>
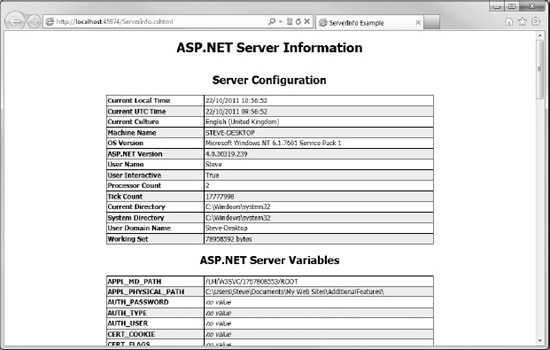
Figure 13-1. The output produced by the ServerInfo.GetHtml() helper method
![]() Caution The ServerInfo helper class displays important and detailed information about the web server, some of which may be useful to people with malicious intent. For that reason, you must ensure that any calls to the ServerInfo helper are removed from your pages before you deploy them to a public-facing site. This same rule applies to any of the diagnostic debugging code discussed in this chapter.
Caution The ServerInfo helper class displays important and detailed information about the web server, some of which may be useful to people with malicious intent. For that reason, you must ensure that any calls to the ServerInfo helper are removed from your pages before you deploy them to a public-facing site. This same rule applies to any of the diagnostic debugging code discussed in this chapter.
Displaying Object Information
WebMatrix includes an ObjectInfo helper class, which displays the type and value of each object passed to it. It can be used to view variables and objects in your code and to display data-type information about the object. If an object contains multiple values, such as an array, or an object is returned as the result of a database query, the helper displays each property and its value.
The best way to demonstrate this is with an example. The following code example sets up various objects and uses the ObjectInfo helper class to display their information by calling the ObjectInfo.Print() method for each. Figure 13-2 shows the output.
@{

    var message = "This example shows the ObjectInfo helper at work.";

    var activityDate = DateTime.Now;

    var cars = new List<String>() { "Ferrari",

                                    "Aston Martin",

                                    "Porsche",

                                    "Lamborghini",

                                    "McLaren" };

}

<!DOCTYPE html>


<html lang="en">

    <head>

        <meta charset="utf-8" />

        <title>ObjectInfo Example</title>

    </head>

    <body>

        <p>

            @message

        </p>

        @ObjectInfo.Print(message)

        @ObjectInfo.Print(activityDate)

        @ObjectInfo.Print(cars)

    </body>

</html>
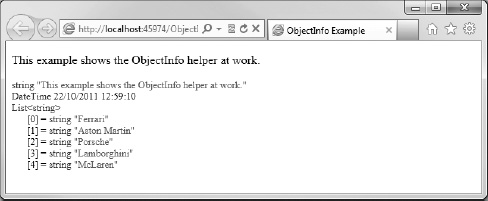
Figure 13-2. The output produced by the ObjectInfo.Print() helper method
Notice that even though we used the var keyword to declare the objects instead of declaring them as explicit types in the first place, the actual type of the object created is displayed by the ObjectInfo helper. This feature alone can be an incredibly useful debugging tool.
Output Expressions
The use of code to output expressions to the browser can be tremendously useful when debugging code. This enables you to see the value of important variables or the results of calculations in real-time at the point of evaluation.
Values can be output from the body of the page using Razor markup, as you would expect. This technique is often particularly useful when you need to check a value at a certain point in the page execution.
![]() Note Much more sophisticated debugging tools are available in the Visual Studio development environment. See the “Debugging with Microsoft Visual Studio” section later in this chapter to learn how to launch a WebMatrix project in Visual Studio.
Note Much more sophisticated debugging tools are available in the Visual Studio development environment. See the “Debugging with Microsoft Visual Studio” section later in this chapter to learn how to launch a WebMatrix project in Visual Studio.
For example, we could output the value of a for loop index to check that we were looping through it the number of times we would expect. This could be used to diagnose a common bug known as an “off-by-one” error. Off-by-one errors occur when an iterative loop iterates one time too many or too few; this can often occur when there is confusion in the code between the actual number of elements in a collection and a zero-based index of elements. For example, the following code and resulting screenshot in Figure 13-3 show an example of an output expression being used to diagnose an “off-by-one” error in which the last element of the array, "McLaren", is never output to the page.
@{

    var cars = new string[] { "Ferrari",

                              "Aston Martin",

                              "Porsche",
                              "Lamborghini",

                              "McLaren" };

}

<!DOCTYPE html>


<html lang="en">

    <head>

        <meta charset="utf-8" />

        <title>Output Expression Example</title>

    </head>

    <body>

        <ul>

            @for (int i = 0; i < cars.GetUpperBound(0); i++)

            {

                <li>

                    @cars[i]


                    @* Output "for loop" indexer for debugging *@

                    @i


                </li>

            }

        </ul>

    </body>

</html>
![]() Caution This is not a good example of how to iterate over an array. In fact, this is a good example of how not to do it. I have included it to show how outputting expressions to the page can help identify bugs, in this case an “off-by-one” error.
Caution This is not a good example of how to iterate over an array. In fact, this is a good example of how not to do it. I have included it to show how outputting expressions to the page can help identify bugs, in this case an “off-by-one” error.
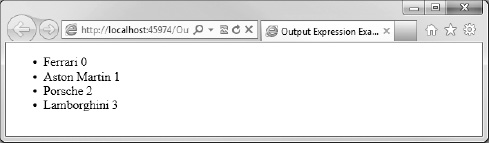
Figure 13-3. Output expressions used to diagnose an “out-by-one” error while iterating over a collection
We can see that by outputting the index of the loop next to the array content, it is much easier to identify the problem.
If you wish to output the value of a variable from within a code block, you can do so using the Response.Write() method. For example, the following code outputs the value stored against the username key of the Session variable:
@{

    Session["username"] = "wendy";

    Response.Write(Session["username"]);

}

<!DOCTYPE html>


<html lang="en">

    <head>

        <meta charset="utf-8" />

        <title>Output Expression Example</title>

    </head>

    <body>

        <h1>Home Page</h1>

        <p>Welcome to the Home Page.</p>

    </body>

</html>
Figure 13-4 shows the output sent to the browser:
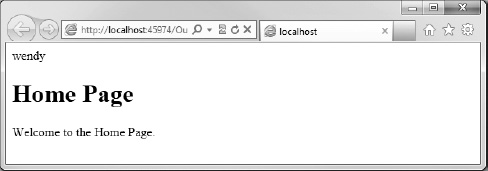
Figure 13-4. Output sent to the browser using the Response.Write() method
![]() Caution Again, for security reasons it is important that you remove all debugging output from a page before it is made publicly available.
Caution Again, for security reasons it is important that you remove all debugging output from a page before it is made publicly available.
Browser Debugging Tools
Most modern web browsers provide tools for debugging web pages, some natively and some via plugins. These tools allow you to see in-depth information about the data sent to the browser. In this section, we'll see how to access the tools available in three of the most popular browsers: Microsoft Internet Explorer, Google Chrome, and Mozilla Firefox.
Internet Explorer Developer Tools
The developer tools within Microsoft's Internet Explorer 8 and Internet Explorer 9 browsers can be accessed simply by pressing F12 or by choosing the Developer Tools item from the Tools menu (see Figure 13-5).
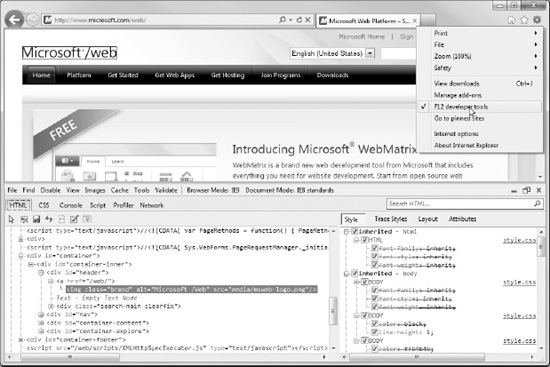
Figure 13-5. Internet Explorer Developer Tools
The Developer Tools panel allows you to explore elements of the page such as HTML, JavaScript, and CSS.
Open Internet Explorer 8 or Internet Explorer 9 and browse to the official ASP.NET web site at http://www.asp.net. Now press the F12 key to open the Developer Tools panel and explore the page content.
The left-hand side of the Developer Tools panel shows the page source, with sets of nested tags being displayed hierarchically. As you move through the source, clicking the plus signs to expand nodes containing nested elements, you can highlight any HTML tags to display the actual CSS rules applied to them. The CSS applied to any highlighted element is displayed on the right-hand side. The check boxes next to each item allow you to temporarily un-apply a style.
![]() Note Information and tutorials regarding Internet Explorer Developer Tools can be found online at
Note Information and tutorials regarding Internet Explorer Developer Tools can be found online at http://msdn.microsoft.com/en-us/ie/aa740478
Google Chrome Developer Tools
Google's Chrome browser also comes with an excellent set of built-in developer tools, and they too can be accessed by pressing F12. These tools (seen here in Figure 13-6) offer functionality similar to that of the Internet Explorer Developer Tools.
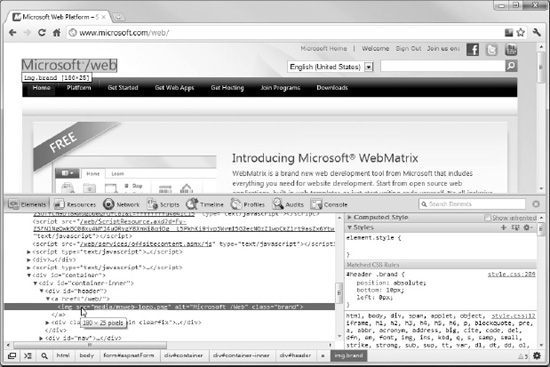
Figure 13-6. Google Chrome Developer Tools
![]() Note More information about the Google Chrome Developer Tools can be found online at
Note More information about the Google Chrome Developer Tools can be found online at http://code.google.com/chrome/devtools/
Mozilla Firefox Firebug
Excellent in-browser debugging tools are provided for the Firefox browser via the Firebug add-on. Firebug does not come as part of the standard Firefox installation but can be downloaded free of charge from www.getfirebug.com or via the Firefox Add-ons Manager. The Add-ons Manager can be accessed by pressing Ctrl+Shift+A while in the browser or through the “Firefox” menu at the top, left-hand corner of the browser window. Once the add-on has been installed, restart the browser and press F12 to open Firebug (see Figure 13-7).
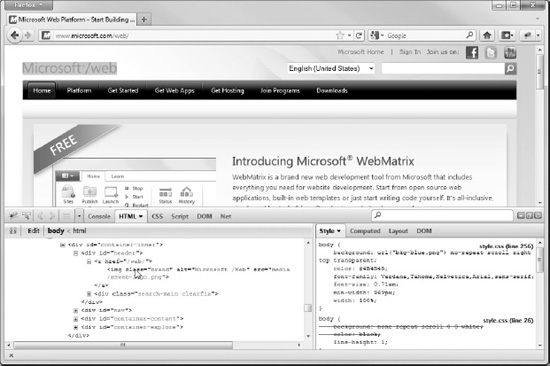
Figure 13-7. The Firebug add-on for Mozilla Firefox
Analyzing HTTP Requests
The WebMatrix IDE has a built-in tool for analyzing requests to your web site by letting you view the status of requests in real time. The tool displays useful information about each request, including the HTTP verb (GET or POST), URL requested, time elapsed, and status. This information can be used to help diagnose bugs that may have resulted from HTTP errors, such as 404 – File Not Found.
To access this tool in WebMatrix, click Site in the workspace area and then click Requests in the Navigation pane.
By using the toggle buttons in the Ribbon Control, the tool can be set to capture all requests or to capture only errors and to ignore or list requests for image files.
Clicking on an item in the list displays more information about the request. Figure 13-8 shows the built-in WebMatrix Requests tool.
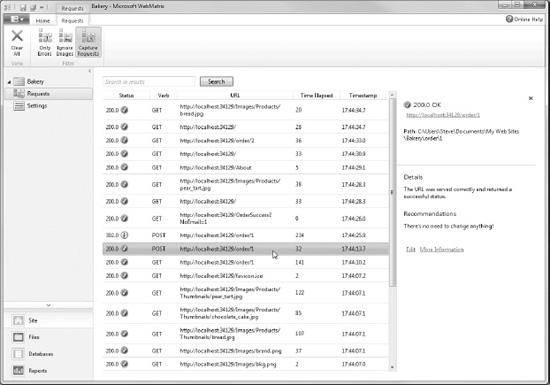
Figure 13-8. The WebMatrix Requests tool
![]() Tip If you would find it useful to see more information about each request than what is shown by the WebMatrix Requests tool, I highly recommend the Fiddler tool. Fiddler can be downloaded completely free of charge from
Tip If you would find it useful to see more information about each request than what is shown by the WebMatrix Requests tool, I highly recommend the Fiddler tool. Fiddler can be downloaded completely free of charge from www.fiddler2.com.
Debugging with Microsoft Visual Studio
Visual Studio has an excellent suite of de-bugging (and general development) tools that are far more comprehensive than those found in the WebMatrix IDE.
If you have a version of Microsoft Visual Studio 2010 installed on your system, including the free Web Developer Express 2010, you can launch it from within the WebMatrix environment. To do this, click Files in the workspace area and then take a look in the Ribbon—the Launch section now has a button to launch Visual Studio (see Figure 13-9). Doing this allows you to take full advantage of the more mature and capable development environment offered by the Visual Studio suite of products.
Figure 13-9. The Launch Visual Studio button found in the Ribbon Control of the Files workspace
![]() Tip If you would like more information about how to use the excellent debugging tools provided with Visual Studio, visit the “Debugging in Visual Studio” section of the MSDN web site at
Tip If you would like more information about how to use the excellent debugging tools provided with Visual Studio, visit the “Debugging in Visual Studio” section of the MSDN web site at http://msdn.microsoft.com/en-us/library/sc65sadd.aspx
Improving Performance Using Caching
Each dynamic page that is requested from a web site requires that the server perform various tasks in order to construct the final output that is then sent to the requesting client's browser. If the construction of the final output requires the completion of a comparatively slow task, such as retrieving data from a database or external web service, the performance of the site can be adversely affected. Although during the development cycle the task may not have appeared to take a particularly long time to complete, if the live site experiences a lot of traffic, the time taken to complete these slow tasks can add up. Heavy traffic such as this can ultimately affect the overall speed at which the server can deal with page requests.
ASP.NET Web Pages provides an output caching mechanism to deal with this situation. If the data on a page does not necessarily need to be re-requested for each visit and is not time-sensitive, instead of fetching it or re-calculating it each time the page is requested, we can store the page in a cache in the web server's memory. This means that when the data is requested by another user, the page can be retrieved straight from the cache rather than being generated from scratch. The data added to the cache can be any type of object, including complex types and collections.
As a rule, the server should cache information that it accesses frequently but that doesn't change often. A good example of a page that would benefit from caching is the home page of the TechieTogs example web site we created in Chapter 11. This page retrieved and displayed a single featured product and the top four most popular products from the database. Because this page is frequently visited, the data on this page is not time-critical, and the database queries involved are comparatively slow tasks, we could store the data in the cache for a period of time with absolutely no adverse effect to the user.
The default expiration time for an item stored in the cache is twenty minutes. However, you can adjust this length of time in code for each item cached, the period ranging from minutes to days.
When you retrieve an item from the cache, you must check that it still exists, even if you are certain that you are requesting it within the cache-expiration period. Entries in the web server's cache may be removed for reasons outside your control, even within the expiration period. For example, if the web server is running low on memory for any reason, it may empty items from the cache in order to reclaim some memory. A server restart will also clear the cache.
ASP.NET Web Pages includes a WebCache helper class to simplify the process of working with the server cache. The helper class exposes three methods, detailed here in Table 13-1:
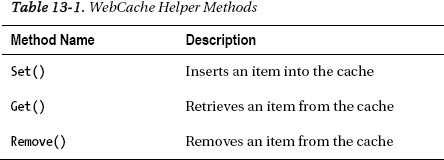
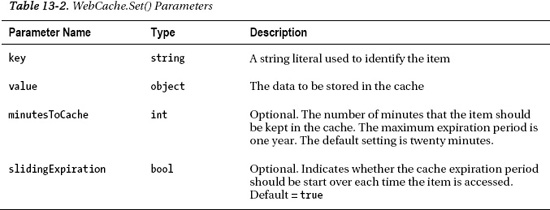
When we add an item to the cache using the Set() method, we need to provide a number of parameters. Table 13-2 explains these in detail:
The Get() and Remove() methods simply accept a string parameter that specifies the key of the cache item to be retrieved or deleted.
To demonstrate the WebCache helper class in action, we'll create a page that caches the current date and time for one minute.
![]() Note The date and time is not a good candidate for caching in the real world. It is both quick to calculate and definitely time sensitive! However, it does provide an excellent demonstration of caching in action.
Note The date and time is not a good candidate for caching in the real world. It is both quick to calculate and definitely time sensitive! However, it does provide an excellent demonstration of caching in action.
Create a page called CachingExample.cshtml, and insert the following code in place of any that may have been created automatically by WebMatrix:
@{

    var dateTime = WebCache.Get("dateTime");

    if (dateTime == null)

    {

        dateTime = DateTime.Now;

        WebCache.Set("dateTime", dateTime, 1, false);

    }

}


<!DOCTYPE html>


<html lang="en">

    <head>

        <meta charset="utf-8" />

        <title>Caching Example</title>

    </head>

    <body>

        <h1>Caching Example</h1>

        <p>

           Current Date and Time: @DateTime.Now

        </p>

        <p>

            Cached Date and Time: @dateTime

        </p>

    </body>

</html>
When the page is requested, the value of the "dateTime" item in the cache is retrieved. If the item is null, the current date and time is set into the cache, with an expiration time of one minute.
In the page body, we display the current date and time and the date and time stored in the cache. On initial load, both values will be the same. However, when the page is refreshed within the one minute expiration limit, the current date and time will change while the cached value remains static. If the page is refreshed once the minute has elapsed, the cached value will be updated.
Figure 13-10 shows the output of the code sample in which the cached time is different from the actual current time:
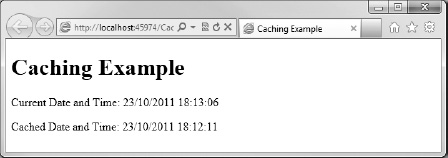
Figure 13-10. The Caching Example demonstrating the use of the WebCache helper class
Search Engine Optimization (SEO) with WebMatrix
Before you deploy your web site to the World Wide Web, you will want to ensure that your site is optimized for search-engine placement. For a newly launched web site, traffic from search engines can mean the difference between success and failure. It is therefore vitally important that the content of your site is formatted in such a way that it can be easily indexed by the automated search-engine “spiders” that “crawl” the World Wide Web, autonomously indexing sites and pages. The process of customizing a web site's content and structure to appeal to these spiders is known as Search Engine Optimization (SEO).
WebMatrix ships with a built-in tool that imitates a search-engine spider—such as that deployed by Google, Yahoo, or Bing—by crawling your web site and noting any SEO issues it encounters. The tool prepares a report detailing any issues with your site as well as helpful pointers that suggest potential remedies.
To see the SEO Reporting Tool in action, create a new site, based on the Empty Web Site template, called SEOExample. Inside the site, create a new page called default.cshtml and insert the following code:
<!DOCTYPE html>


<html lang="en">

    <head>

        <meta charset="utf-8" />

        <title></title>

    </head>

    <body>

        <p><em>This is the home page.</p></em>

        <p>

           <a href="about.cshtml">About Us</a>

        </p>

    </body>

</html>
Once you have created and saved the page, navigate to the Reports workspace by clicking the bottom icon, labeled Reports, in the Workspace Selector. On entering the Reports workspace, you will be presented with a screen similar to that shown in Figure 13-11:
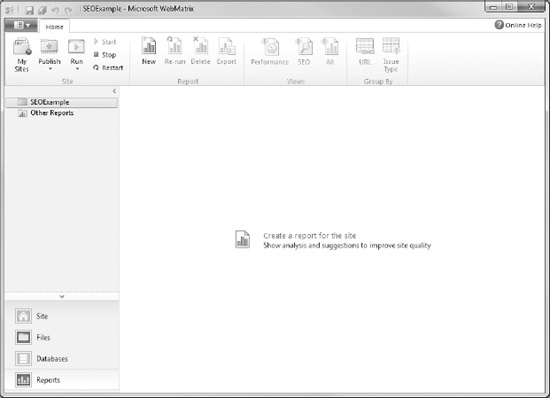
Figure 13-11. The Reports workspace
Click the New button in the Report section of the Ribbon Control to open the New Report dialog. Enter a suitable name for the report and the full URL of the page from which the Reporting Tool spider should start crawling. In our case, we will accept the default URL, which is the default document for the web site because it is hosted locally by IIS Express.
Clicking the arrow to show the Advanced Settings panel will allow you to set a number of preferences, including the maximum number of pages to crawl and the maximum download size (see Figure 13-12). In our case, we only have one page to crawl, so these settings are essentially irrelevant. However, in the future, if you need to run the tool on a large site, these settings will be useful for keeping the size of the report manageable.
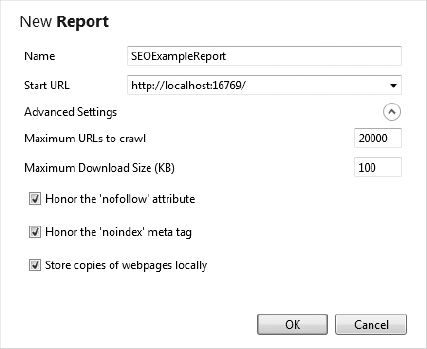
Figure 13-12. The New Report dialog showing the Advanced Settings panel
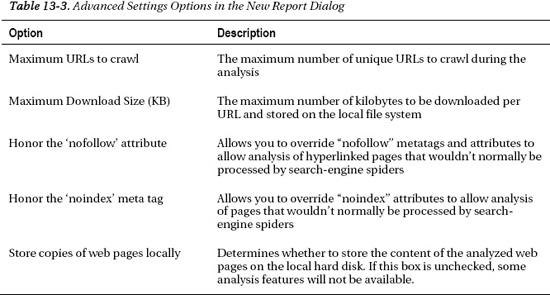
Table 13-3 explains the options available in the Advanced Settings panel of the New Report dialog:
Click OK to run the report, which will produce the output seen in Figure 13-13:
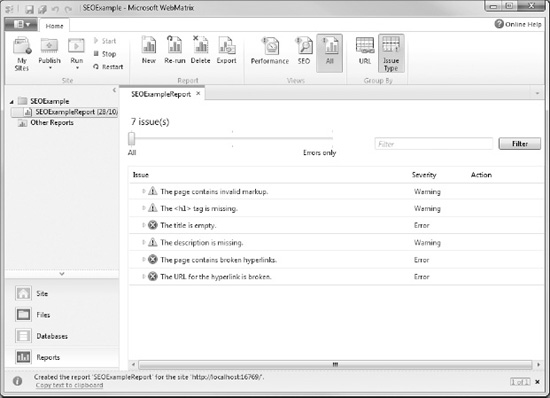
Figure 13-13. The report produced for our test site
Each issue identified by the Reporting Tool is categorized as either an error, a warning, or information. We can see that for our test page, six warnings and errors have been identified. The slider control at the top of the report can be moved to show all issues, only errors and warnings, or errors only.
By clicking on an item in the report, we can see details of where exactly in the site this issue has occurred; in fact, the issue may be present in more than one place. Clicking on a specific violation displays more information, including recommended remedies. Click the “The page contains invalid markup” warning to see the information shown in Figure 13-14:
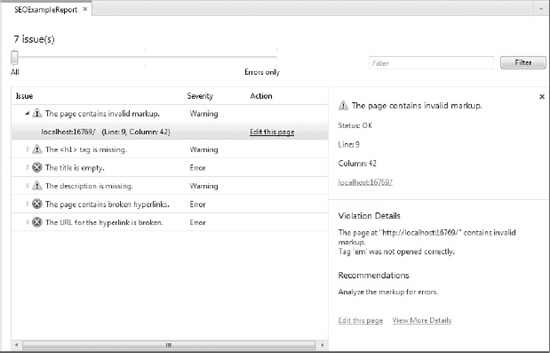
Figure 13-14. Information that is more specific can be viewed by selecting individual violations.
This specific warning tells us that there was a problem with our <em> tag, so click the “Edit this page” link at the bottom, right-hand side and fix the markup, as highlighted below:
<!DOCTYPE html>


<html lang="en">

    <head>

        <meta charset="utf-8" />

        <title></title>

    </head>

    <body>

        <p><em>This is the home page.</em></p>

        <p>

           <a href="about.cshtml">About Us</a>

        </p>

    </body>

</html>
Now we can save the default.cshtml file, go back to the Reports workspace, and click the Re-run icon in the Ribbon Control to determine if the warning has disappeared.
Looking in the Navigation pane, you will see that WebMatrix generated an entirely separate report when you clicked Re-run. It is useful to be able to go back and see the effect that code changes have on your site, particularly for performance, but after a while you will want to remove some of the older reports. To do this, simply right-click the report you wish to remove in the Navigation pane, and choose Delete from the context menu. A dialog box will be shown asking you to confirm the deletion.
When addressing your SEO issues, it may be easier to fix the violations on a page-by-page basis. To make this easier, the report can be grouped by URL rather than by issue type. This can be done by clicking the URL button in the Group By section of the Ribbon Control. Clicking a specific URL will list all the associated violations (see Figure 13-15):
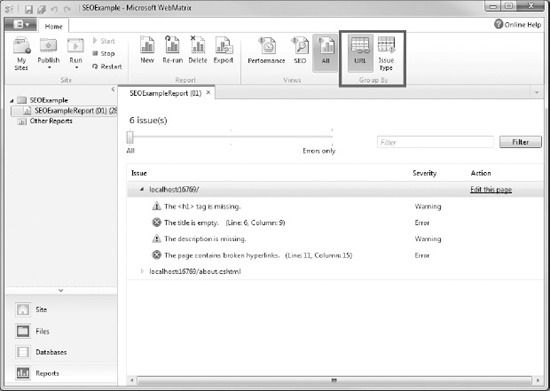
Figure 13-15. Grouping SEO violations by URL
The Performance Report
When the spider crawls your site to produce the SEO Report, it also notes the amount of time taken for each page to be served. This information can be seen by clicking the Performance button in the Views section of the Ribbon Control (see Figure 13-16):
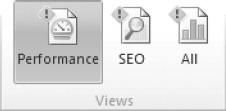
Figure 13-16. Accessing the Performance Report
Given that we have run this report on the local IIS Express web server, the actual timings are only an indication; real-world page-load times will depend on various other factors, including bandwidth, server performance, database performance, traffic, etc. However, the timings will help us to identify potential performance issues in pages before they go live.
Figure 13-17 shows the Performance Report for your test site:
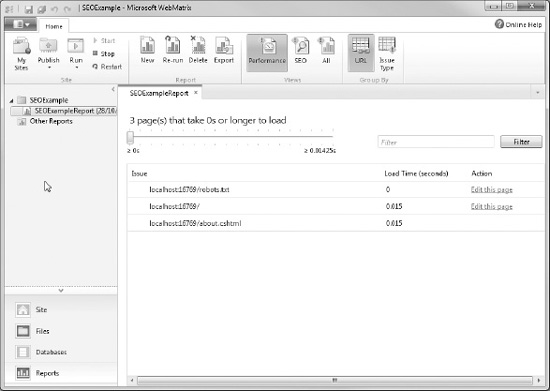
Figure 13-17. The WebMatrix Performance Report
The slider at the top of the report allows us to filter the report to show only pages that take more than a specified time period to load. This is useful when analyzing a large site, for example, and you want to only see pages that take over five seconds to load.
Analyzing Other Web Sites
If you want to run an SEO Report on a site other than the one you currently have open, choose New from the Report section of the Ribbon Control and enter the URL of the site you wish to spider. Bear in mind that if you are planning to analyze a large commercial site, you should specify a sensible value for the “Maximum URLs to crawl” setting in the Advanced Settings panel.
Once the report is complete, you will be able to view the SEO issues, but obviously you will not be able to edit the violating pages.
![]() Tip Microsoft offers a great tool called the “IIS Search Engine Optimization (SEO) Toolkit” as a free download. This tool is similar in functionality to the WebMatrix Reports workspace but has greatly enhanced capabilities. It is more complicated to use but provides a much greater level of detail and sophistication if that is what you require. To download the tool, visit
Tip Microsoft offers a great tool called the “IIS Search Engine Optimization (SEO) Toolkit” as a free download. This tool is similar in functionality to the WebMatrix Reports workspace but has greatly enhanced capabilities. It is more complicated to use but provides a much greater level of detail and sophistication if that is what you require. To download the tool, visit http://www.iis.net/download/SEOToolkit
Deploying Your Web Site
Once you are satisfied that your site is ready for the World Wide Web, WebMatrix can help you deploy your site to a production web server.
Finding a Hosting Provider
WebMatrix has a built-in facility to help you find a suitable web host for your site. If you already have an account with a web-hosting provider, you may want to skip to the next section, “Publish Settings.”
To get started with finding suitable web hosting for your project, click the “Need web hosting for your site?” button found in the Content Pane of the Site workspace (see Figure 13-18).
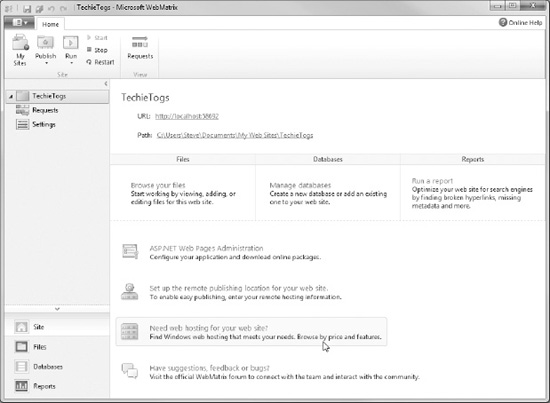
Figure 13-18. WebMatrix can help you find a suitable hosting provider for your site.
Clicking the button will take you to the “Find Web Hosting...” page of the Microsoft web site, as shown here in Figure 13-19:
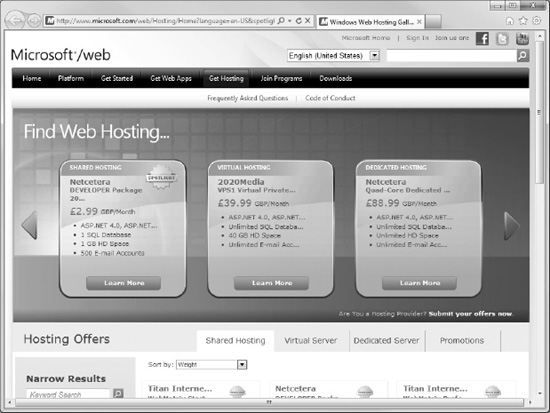
Figure 13-19. The “Find Web Hosting...”page of the Microsoft web site
WebMatrix passes some basic information about your site to this page to help narrow down the list of hosting packages, thereby only showing those that are suitable for hosting your application. You can filter this list further using the tools on the page (see Figure 13-20).
Take care when changing these settings, particularly the Scripting Language setting, to ensure that you do not end up purchasing an unsuitable hosting package. The settings for storage (GB), number of SQL databases, number of email accounts, and bandwidth per month can be set using the sliders. There are a number of factors to consider when setting these criteria:
- Storage: The initial size of your web site can be found by viewing the folder properties of your site in Windows Explorer on your development machine. However, this is only a starting point. If your site has the potential to grow over time—for example if it has the facility for users to upload documents—you should bear this in mind. If you are using an SQL Server Compact Edition database, the disk space required to hold this database (up to 4GB) will also be included when calculating storage capacity.
- Number of SQL Databases: If you are planning to use an SQL Server Compact Edition database for your site, there is no need to choose a host with additional database capabilities, as SQL Server Compact Edition is file-based and requires no additional software to be installed on the server. However, if you are planning to use a different edition of SQL Server, you will need a host that can provide these facilities. WebMatrix can automatically produce SQL scripts to create tables and can insert data to replicate this schema on your development computer. You will need to run these scripts on the database provided by your hosting provider, usually through the host's control panel.
- Bandwidth per month: To calculate roughly how much bandwidth your site requires, you can use the following formula:
Monthly bandwidth =
Average page size x (Average monthly visitors x Average page views per visit)
Remember to add a substantial contingency amount (about 50 percent) for sudden peaks in traffic as a result of popular links to your site or successful marketing campaigns. If your site provides downloadable content for users, your bandwidth calculations should also take this into account. Average monthly usage statistics can be easily obtained through a web-based analysis tool such as Google Analytics or StatCounter.
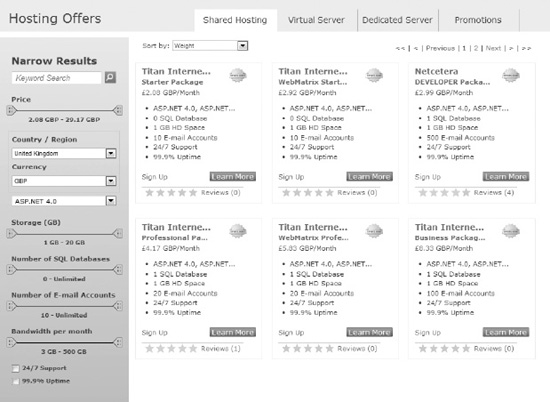
Figure 3-20. Choosing a web-hosting provider
To find more information about a particular hosting package, click one of the green Learn More buttons. Once you have found a package that meets your criteria, click the Sign Up link on the relevant company's web site.
Publish Settings
Once you have chosen and purchased a suitable hosting plan, your chosen provider will typically send you an email containing the details of your account and connection information. This connection information will be provided either as a list of settings or as a file with a .PublishSettings extension.
WebMatrix can publish your site using either of these methods; once the initial setup is complete, they both work in exactly the same way. In the next two sections, we'll look at each of these methods.
Open the Site workspace and click the “Set up remote publishing location for your web site” button found in the Content Pane (see Figure 13-21).

Figure 13-21. Click the button in the Site workspace to open the Publish Settings dialog
Clicking this button opens the Publish Settings dialog seen in Figure 13-22:
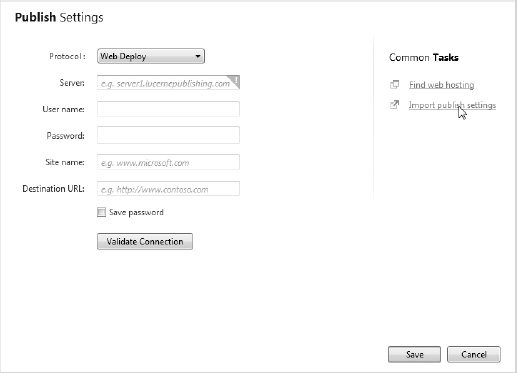
Figure 13-22. The Publish Settings dialog
Using a .PublishSettings File
A .PublishSettings file is an XML-based file that contains connection and publishing information specific to your web-hosting account. If your web host has provided you with a .PublishSettings file, it can be used to configure site deployment using WebMatrix.
Click the “Import publish settings” link, located under Common Tasks on the right-hand side of the Publish Settings dialog; this will allow you to browse for your .PublishSettings file. Once you have located the file, click Open to allow WebMatrix to retrieve the necessary settings from the file. The Publish Settings dialog will be populated for you using the information stored in the .PublishSettings file, including connection strings for any non-SQL Server Compact Edition databases you may be using.
Once you are happy with the settings, click the Validate Connection button to have WebMatrix test the settings (see Figure 13-23), and if they are successful, click Save.
Figure 13-23. Click the Validate Connection button to have WebMatrix test the specified settings.
Manual Configuration
If you have not received a .PublishSettings file from your web hosting provider, you can configure the Publish Settings dialog manually using the host settings, usually sent as part of your account confirmation email or available through the host's control panel.
If you selected your web-hosting package via the WebMatrix IDE, you can enter the host settings directly into the Publish Settings dialog, as seen in Figure 13-22, leaving the Protocol drop-down set to “Web Deploy.” If you did not choose your hosting package through WebMatrix and your web host does not support Web Deploy, you should follow the instructions in the section titled “Configuring Publish Settings using FTP.”
The following list explains the settings required by the Publish Settings dialog for Web Deploy projects:
- Server: This is often referred to by web hosts as the “Server Name” or “Service URL”.
- User name and Password: These are usually chosen by you when you sign up for the hosting account, although alternatives may be provided by the hosting company for publishing purposes.
- Site Name: This is typically referred to as the “Site” or as “Site/Application” in the list of settings provided by hosting companies.
- Destination URL: This is the URL that will be used to browse to your site (i.e., the site's web address).
Once you have entered all the necessary settings, click the Validate Connection button (see Figure 13-23) to verify that WebMatrix can successfully connect to your hosting account, and then click Save.
Configuring Publish Settings using FTP
If your web host does not support Web Deploy, WebMatrix can be configured to publish using the File Transfer Protocol (FTP). Choosing FTPfrom the Protocol drop-down in the Publish Settings dialog will present you with a slightly different set of options, explained below:
- Server: Web-hosting companies often call this the “Server Name” or “Service URL.”
- Site Name: This is often referred to in the list of settings provided by hosting companies as the “Site Root” or “Default Directory.” This setting is optional.
- User name and Password: Typically, these are chosen by you when you sign up for the hosting account. However, alternatives for publishing may be set by the hosting provider.
- Destination URL: This is the URL that will be used to browse to your site (i.e., the site's web address).
Again, once you have entered all of the necessary information, click the Validate Connection button, seen in Figure 13-23, to have WebMatrix test the settings, and then click Save.
Configuring External Database Connections
If your web site uses a database other than the built-in SQL Server Compact Edition, your site will have one or more database connection strings stored in the web.config file, which specifies the details of each database connection.
During development, these settings will be different to those required to point the site at the live database on the public-facing site. By clicking the Connection String textbox next to each database listed at the bottom of the Publish Settings dialog, you can specify the live-database connection settings (see Figure 13-24).
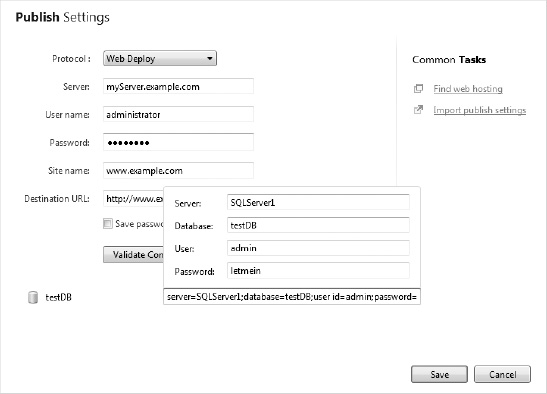
Figure 13-24. Configuring database connections in the Publish Settings dialog
These settings tell WebMatrix to build a connection string so that it knows how to connect to the live data. This overwrites the web.config settings only on the live server.
Publishing Your Web Site
With your Publish Settings correctly configured, you are now in a position to upload your site to the World Wide Web. You can do this at any time by clicking the Publish button on the left-hand side of the Ribbon Control.
The first time you click the Publish button, a Publish Compatibility dialog will appear, shown here in Figure 13-25. This dialog gives you the opportunity to have WebMatrix test your publish settings and make adjustments to .NET settings on the server if necessary. Click Yes to proceed with the test.
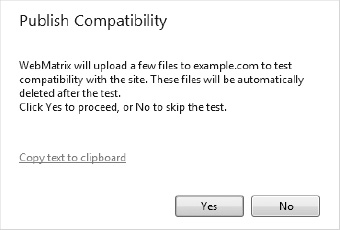
Figure 13-25. The Publish Compatibility dialog
Once the test is complete, the Publish Preview dialog will be displayed. Figure 13-26 shows the Publish Preview dialog shown for the first upload of the TechieTogs site we developed in chapters 9, 10, and 11.
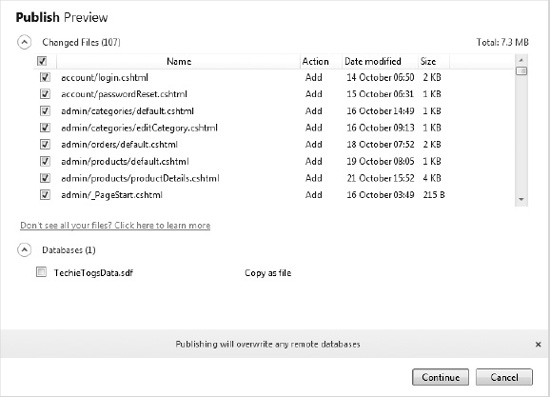
Figure 13-26. The Publish Preview dialog
The Publish Preview dialog shows all the files that have changed since the last upload to the site. The dialog gives you the opportunity to check the list of changed files to be published and to remove them from the list as necessary; this is done by un-ticking the check box next to the file name.
If this is the first time you have uploaded the site, then all files will be shown and ticked. On subsequent uploads, only changed files will appear in this dialog.
Databases will never be ticked by default, so if you wish WebMatrix to upload your SQL Server Compact Edition database, you should be sure to check the box next to the database file.
Once you have selected all the necessary files for upload, click Continue to publish your site. The notification bar across the bottom of the WebMatrix IDE will inform you of its progress (see Figure 13-27).
Figure 13-27. Site-publishing progress shown in the WebMatrix IDE notification bar
The initial publishing of a site can take several minutes, particularly if databases are to be uploaded. Once the process is complete, a success message, such as the one seen in Figure 13-28, will be displayed in the notification bar:
Figure 13-28. The message seen in the notification bar once publishing is complete
Now that the initial upload is complete, you can view the site in a web browser at your chosen URL. You can continue to safely develop the site on your local PC and only need to upload changed files to the web server as necessary. This makes the whole publishing process much quicker and enables you to keep the development site completely separate from the live production site.
Summary
In this chapter we have covered a lot of the features of WebMatrix that go beyond ASP.NET Web Page development. We have seen how WebMatrix can be used to help debug pages and fix errors and how further debugging tools can be accessed in modern web browsers and through Visual Studio.
We have also seen how the performance of a web site can be improved by caching data in the memory of the web server for faster retrieval. Search Engine Optimization (SEO) was also discussed, and we learned how WebMatrix can “crawl” your web site by mimicking a search engine spider, identifying issues that may affect how your pages are indexed and placed by search engines.
Finally, we saw how WebMatrix can help us choose a hosting provider and publish our completed sites to the World Wide Web.
This brings us to the end of the book! So, thanks for reading; I really hope you enjoyed learning, and I wish you every success with all your future WebMatrix projects.