Chapter 13
![]()
Deadlock Analysis
When a deadlock occurs between two or more transactions, SQL Server allows one transaction to complete and terminates the other transaction. SQL Server then returns an error to the corresponding application, notifying the user that he has been chosen as a deadlock victim. This leaves the application with only two options: resubmit the transaction or apologize to the end user. To successfully complete a transaction and avoid the apologies, it is important to understand what might cause a deadlock and the ways to handle a deadlock.
In this chapter, I cover the following topics:
- Deadlock fundamentals
- Error handling to catch a deadlock
- Ways to analyze the cause of a deadlock
- Techniques to resolve a deadlock
Deadlock Fundamentals
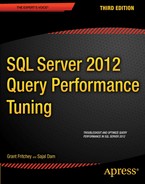
A deadlock is a special blocking scenario in which two processes get blocked by each other. Each process, while holding its own resources, attempts to access a resource that is locked by the other process. This will lead to a blocking scenario known as a deadly embrace, as illustrated in Figure 13-1.
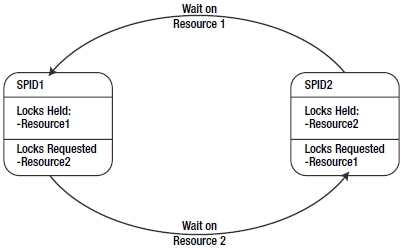
Figure 13-1. A deadlock scenario
Deadlocks also frequently occur when two processes attempt to escalate their locking mechanisms on the same resource. In this case, each of the two processes has a shared lock on a resource, such as an RID, and each attempts to promote the lock from shared to exclusive; however, neither can do so until the other releases its shared lock. This too leads to one of the processes being chosen as a deadlock victim.
Finally, it is possible for a single process to get a deadlock during parallel operations. During parallel operations, it's possible for a thread to be holding a lock on one resource, A, while waiting for another resource, B; at the same time, another thread can have a lock on B while waiting for A. This is as much a deadlock situation as when multiple processes are involved.
Deadlocks are an especially nasty type of blocking because a deadlock cannot resolve on its own, even if given an unlimited period of time. A deadlock requires an external process to break the circular blocking.
SQL Server has a deadlock detection routine, called a lock monitor, that regularly checks for the presence of deadlocks in SQL Server. Once a deadlock condition is detected, SQL Server selects one of the sessions participating in the deadlock as a victim to break the circular blocking. The victim is usually the process with the lowest estimated cost since this implies that process will be the easiest one for SQL Server to roll back. This operation involves withdrawing all the resources held by the victim session. SQL Server does so by rolling back the uncommitted transaction of the session picked as a victim.
Choosing the Deadlock Victim
SQL Server determines the session to be a deadlock victim by evaluating the cost of undoing the transaction of the participating sessions, and it selects the one with the least cost. You can exercise some control over the session to be chosen as a victim by setting the deadlock priority of its connection to LOW:
SET DEADLOCK_PRIORITY LOW;
This steers SQL Server toward choosing this particular session as a victim in the event of a deadlock. You can reset the deadlock priority of the connection to its normal value by executing the following SET statement:
SET DEADLOCK_PRIORITY NORMAL;
The SET statement allows you to mark a session as a HIGH deadlock priority, too. This won't prevent deadlocks on a given session, but it will reduce the likelihood of a given session being picked as the victim. You can even set the priority level to a number value from –10 for the lowest priority to 10 for the highest.
In the event of a tie, one of the processes is chosen as a victim and rolled back as if it had the least cost. Some processes are invulnerable to being picked as a deadlock victim. These processes are marked as such and will never be chosen as a deadlock victim. The most common example that I've seen occurs when processes are already involved in a rollback.
Using Error Handling to Catch a Deadlock
When SQL Server chooses a session as a victim, it raises an error with the error number. You can use the
TRY/CATCH construct within T-SQL to handle the error. SQL Server ensures the consistency of the database by automatically rolling back the transaction of the victim session. The rollback ensures that the session is back to the same state it was in before the start of its transaction. On determining a deadlock situation in the error handler, it is possible to attempt to restart the transaction within T-SQL a number of times before returning the error to the application.
Take the following T-SQL statement as an example of one method for handling a deadlock error
(--trap_sample in the download):
DECLARE @retry AS TINYINT = 1,
@retrymax AS TINYINT = 2,
@retrycount AS TINYINT = 0 ;
WHILE @retry = 1
AND @retrycount <= @retrymax
BEGIN
SET @retry = 0 ;
BEGIN TRY
UPDATE HumanResources.Employee
SET LoginID = '54321'
WHERE BusinessEntityID = 100 ;
END TRY
BEGIN CATCH
IF (ERROR_NUMBER() = 1205)
BEGIN
SET @retrycount = @retrycount + 1 ;
SET @retry = 1 ;
END
END CATCH
END
The TRY/CATCH methodology allows you to capture errors. You can then check the error number using the ERRORNUMBER() function to determine whether you have a deadlock. Once a deadlock is established, it's possible to try restarting the transaction a set number of times—two, in this case. Using error trapping will help your application deal with intermittent or occasional deadlocks, but the best approach is to analyze the cause of the deadlock and resolve it, if possible.
Deadlock Analysis
You can sometimes prevent a deadlock from happening by analyzing the causes. You need the following information to do this:
- The sessions participating in the deadlock
- The resources involved in the deadlock
- The queries executed by the sessions
Collecting Deadlock Information
You have four ways to collect the deadlock information:
- Use a specific extended event.
- Set trace flag 1222.
- Set trace flag 1204.
- Use a SQL trace.
Trace flags are used to customize certain SQL Server behavior such as, in this case, generating the deadlock information.
Extended events provide several ways to gather information. This is probably the best method you can apply to your server for collecting deadlock information. You can use these options:
- Lock_deadlock: Displays basic information about a deadlock occurrence
- Lock_deadlock_chain: Captures information from each participant in a deadlock
- Xml_deadlock_report: Displays an XML deadlock graph with the cause of the deadlock
The deadlock graph generates XML output. After the extended event has captured the deadlock events, you can view them within SSMS either through the event viewer or by opening the XML file if you output your event results there. While similar information is displayed in all three events, for basic deadlock information, the easiest to understand is the xml_deadlock_report. When monitoring for deadlocks, I would recommend also capturing the lock_deadlock_chain, so that you have more detailed information about the individual sessions involved in the deadlock if you need it.
You can open the deadlock graph in Management Studio. You can search the XML, but the deadlock graph generated from the XML works almost like an execution plan for deadlocks, as shown in Figure 13-2.

Figure 13-2. A deadlock graph as displayed in the Profiler
I'll show you how to use this in the “Analyzing the Deadlock” section later in this chapter.
The two trace flags that generate deadlock information can be used together to generate two sets of information. Usually people will prefer to run one or the other because they write a lot of information into the error log of SQL Server. Trace flag 1222 provides the most detailed information on the deadlock. The trace flags write the information gathered into the log file on the server where the deadlock event occurred.
Trace flag 1204 provides detailed deadlock information that helps you analyze the cause of a deadlock. It sorts the information by each of the nodes involved in the deadlock. Trace flag 1222 also provides detailed deadlock information, but it breaks the information down differently. Trace flag 1222 sorts the information by resource and processes, and it provides even more information. Details on both sets of data will be shown in the “Analyzing the Deadlock” section.
The DBCC TRACEON statement is used to turn on (or enable) the trace flags. A trace flag remains enabled until it is disabled using the DBCC TRACEOFF statement. If the server is restarted, this trace flag will be cleared. You can determine the status of a trace flag using the DBCC TRACESTATUS statement. Setting both of the deadlock trace flags looks like this:
DBCC TRACEON (1222, -1) ;
DBCC TRACEON (1204, -1) ;
To ensure that the trace flags are always set, it is possible to make them part of the SQL Server startup in the SQL Server Configuration Manager by following these steps:
1. Open the Properties dialog box of the instance of SQL Server.
2. Switch to the Startup Parameters tab of the Properties dialog box, as shown in Figure 13-3.
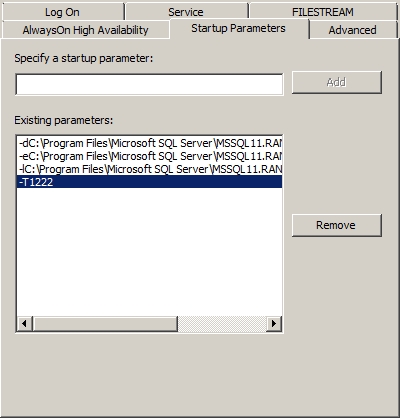
Figure 13-3. A SQL Server instance's Properties dialog box showing the Startup Parameters
3. Type ;T-1222 in the “Specify a startup parameter” text box, and click Add to add trace flag 1222.
4. Click the OK button to close all the dialog boxes.
These trace flag settings will be in effect after you restart your SQL Server instance.
Analyzing the Deadlock
To analyze the cause of a deadlock, let's consider a straightforward little example. First, make sure you've turned on the deadlock trace flag 1222 and created an extended events session that uses the xml_deadlock_report event. In one connection, execute this script (--deadlock1 in the download):
BEGIN TRAN
UPDATE Purchasing.PurchaseOrderHeader
SET Freight = Freight * 0.9 -- 10% discount on shipping
WHERE PurchaseOrderID = 1255 ;
In a second connection, execute this script (--deadlock2 in the download):
UPDATE Purchasing.PurchaseOrderDetail
SET OrderQty = 4
WHERE ProductID = 448
AND PurchaseOrderID = 1255 ;
Each of these scripts opens a transaction and manipulates data, but neither commits or rolls back the transaction. Switch back to the first transaction and run this query:
BEGIN TRANSACTION
UPDATE Purchasing.PurchaseOrderDetail
SET OrderQty = 2
WHERE ProductID = 448
AND PurchaseOrderID = 1255 ;
Unfortunately, after possibly a few seconds, the first connection faces a deadlock:
Msg 1205, Level 13, State 51, Line 1
Transaction (Process ID 52) was deadlocked on lock resources with another process and has been chosen as the deadlock victim. Rerun the transaction.
Any idea what's wrong here?
Let's analyze the deadlock by first examining the deadlock graph collected through the trace event. There is a separate tab in the Event explorer window. Opening that will show you the deadlock graph (see Figure 13-4).
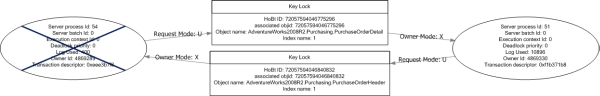
Figure 13-4. A deadlock graph displayed in the Profiler tool
From the deadlock graph displayed in Figure 13-5, it's fairly clear that two processes were involved: session 51 and session 54. Session 54, the one with the big blue X crossing it out, was chosen as the deadlock victim. Two different keys were in question. The top key was owned by session 51, as demonstrated by the arrow pointing to the session object, named Owner Mode, and marked with an X for exclusive. Session 54 was attempting to request the same key for an update. The other key was owned by session 54 with session 51 requesting an update. You can see the exact HoBt ID, object ID, object name, and index name for the objects in question for the deadlock. For a classic, simple deadlock like this, you have most of the information you need. The last piece would be the queries running from each process. These would need to be captured using a different extended event.
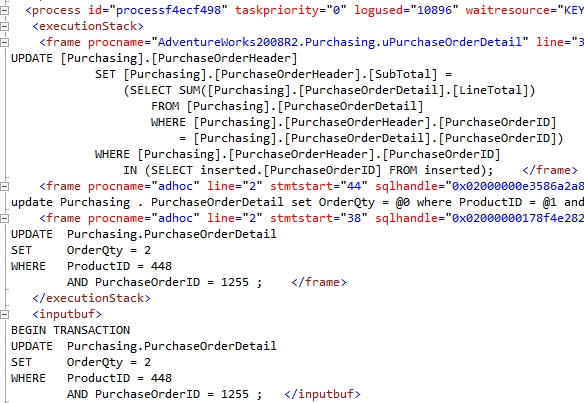
Figure 13-5. The XML information that defines the deadlock graph
This visual representation of the deadlock can do the job. However, you may need to drill down into the underlying XML to really understand exactly where deadlocks occurred, what processes caused them, and which objects were involved. If you open that XML up directly, you can find a lot more information available than the simple set displayed for you in the graphical deadlock graph. Take a look at Figure 13-5.
If you look through this, you can see some of the information on display in the deadlock graph, but you also see a whole lot more. For example, part of this deadlock actually involves code that we did not write or execute as part of the example. There's a trigger on the table called uPurchaseOrderDetail. You can also see the code I used to generate the deadlock. All this information can help you to identify exactly which pieces of code lead to the deadlock. You also get information such as the sqlhandle, which you can then use in combination with DMOs to pull statements and execution plans out of cache. Because the plan is created before the query is run, it will be available for you even for the queries that were chosen as the deadlock victim.
It's worth taking some time to explore this XML in a little more detail. Table 13-1 shows elements from the extended event and the information it represents.
Table 13-1. XML Deadlock Graph Data
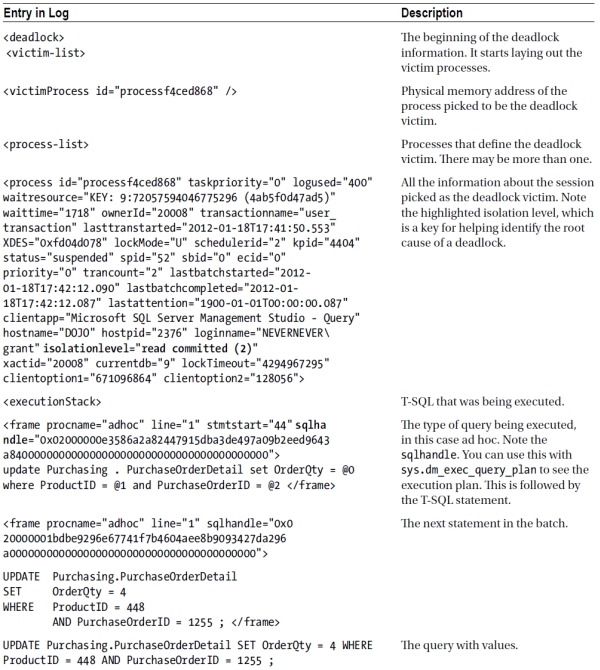
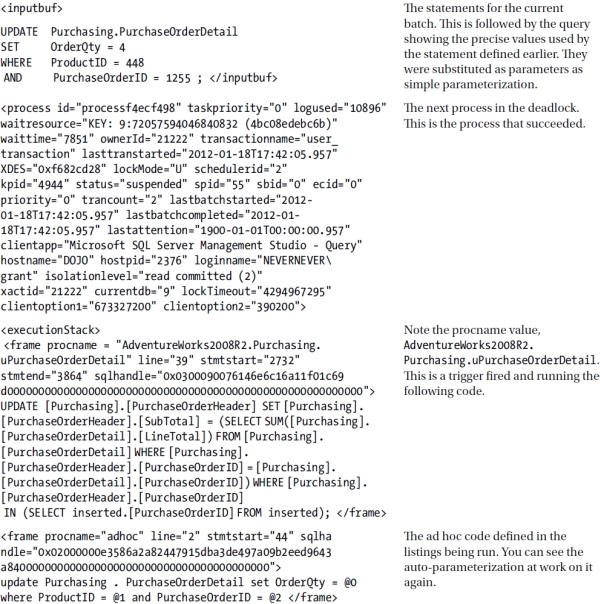
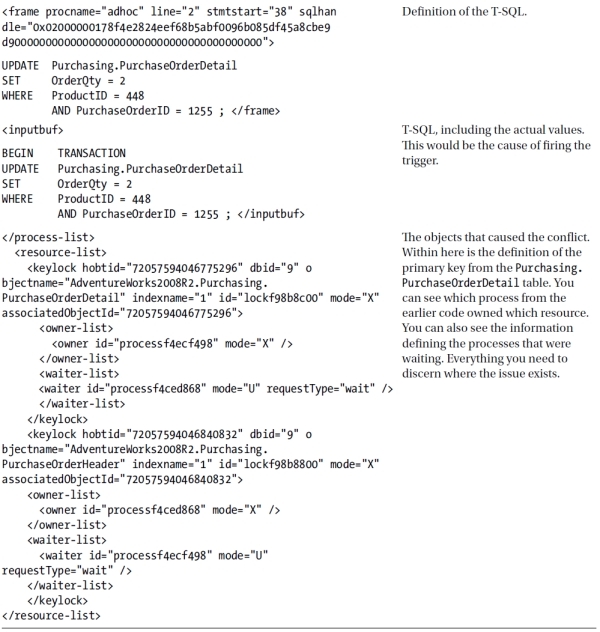
This information is a bit more difficult to read through than the clean set of data provided by the graphical deadlock graph. However, it is a very similar set of information, just more detailed. You can see, highlighted in bold near the bottom, the definition of one of the keys associated with the deadlock. You can also see, just before it, that the text of the execution plans is available through extended event XML output, unlike the deadlock graph. In this case, you are much more likely to have everything you need to isolate the cause of the deadlock.
The information gathered by trace flag 1222 is almost identical to the XML data in every regard. The main difference is the formatting and location. The output from 1222 is located in the SQL Server error log, and it's in text format instead of nice, clean XML. The information collected by trace flag 1204 is completely different from either of the other two sets of data and doesn't provide nearly as much detail. Trace flag 1204 is also much more difficult to interpret. For all these reasons, I suggest you stick to using extended events if you can—or trace flag 1222 if you can't—to capture deadlock data. You also have the default system_health session that captures a number of events by default, including deadlocks. It's a great resource if you are unprepared for capturing this information. Just remember that it keeps only 4, 5mb files online. As these fill, the data in the oldest file is lost. Depending on the number of transactions in your system, and the number of deadlocks or other events that could fill these files, you may only have very recent data available.
This example demonstrated a classic circular reference. Although not immediately obvious, the deadlock was caused by a trigger on the Purchasing.PurchaseOrderDetail table. When Quantity is updated on the Purchasing.PurchaseOrderDetail table, it attempts to update the Purchasing.PurchaseOrderHeader table. When the first two queries are run, each within an open transaction, it's just a blocking situation. The second query is waiting on the first to clear, so that it can also update the Purchasing.PurchaseOrderHeader table. But when the third query (i.e., the second within the first transaction) is introduced, a circular reference is created. The only way to resolve it is to kill one of the processes.
Before proceeding, be sure to roll back any open transactions.
Here's the obvious question at this stage: can you avoid this deadlock? If the answer is “yes,” then how?
The methods for avoiding a deadlock scenario depend upon the nature of the deadlock. The following are some of the techniques you can use to avoid a deadlock:
- Access resources in the same physical order.
- Decrease the locking.
- Minimize lock contention.
Accessing Resources in the Same Physical Order
One of the most commonly adopted techniques for avoiding a deadlock is to ensure that every transaction accesses the resources in the same physical order. For instance, suppose that two transactions need to access two resources. If each transaction accesses the resources in the same physical order, then the first transaction will successfully acquire locks on the resources without being blocked by the second transaction. The second transaction will be blocked by the first while trying to acquire a lock on the first resource. This will cause a typical blocking scenario without leading to a circular blocking.
If the resources are not accessed in the same physical order (as demonstrated in the earlier deadlock analysis example), this can cause a circular blocking between the two transactions:
- Transaction 1:
- Access Resource 1
- Access Resource 2
- Transaction 2:
- Access Resource 2
- Access Resource 1
In the current deadlock scenario, the following resources are involved in the deadlock:
- Resource 1, hobtid=72057594046578688: This is the index row within index
PK_ PurchaseOrderDetail_PurchaseOrderId_PurchaseOrderDetailId on the Purchasing.PurchaseOrderDetail table. - Resource 2, hobtid=72057594046644224: This is the row within clustered index
PK_ PurchaseOrderHeader_PurchaseOrderId on the Purchasing.PurchaseOrderHeader table.
Both sessions attempt to access the resource; unfortunately, the order in which they access the key is different.
It's very common with some of the generated code out of tools like nHibernate and Entity Framework to see objects being referenced in a different order in different queries. You'll have to work with your development team to see that type of issue eliminated within the generated code.
Decreasing the Number of Resources Accessed
A deadlock involves at least two resources. A session holds the first resource and then requests the second resource. The other session holds the second resource and requests the first resource. If you can prevent the sessions (or at least one of them) from accessing one of the resources involved in the deadlock, then you can prevent the deadlock. You can achieve this by redesigning the application, which is a solution highly resisted by developers late in the project. However, you can consider using the following features of SQL Server without changing the application design:
- Convert a nonclustered index to a clustered index.
- Use a covering index for a SELECT statement.
Convert a Nonclustered Index to a Clustered Index
As you know, the leaf pages of a nonclustered index are separate from the data pages of the heap or the clustered index. Therefore, a nonclustered index takes two locks: one for the base (either the cluster or the heap) and one for the nonclustered index. However, in the case of a clustered index, the leaf pages of the index and the data pages of the table are the same; it requires one lock, and that one lock protects both the clustered index and the table because the leaf pages and the data pages are the same. This decreases the number of resources to be accessed by the same query, compared to a nonclustered index.
Use a Covering Index for a SELECT Statement
You can also use a covering index to decrease the number of resources accessed by a SELECT statement. Since a SELECT statement can get everything from the covering index itself, it doesn't need to access the base table. Otherwise, the SELECT statement needs to access both the index and the base table to retrieve all the required column values. Using a covering index stops the SELECT statement from accessing the base table, leaving the base table free to be locked by another session.
You can also resolve a deadlock by avoiding the lock request on one of the contended resources. You can do this when the resource is accessed only for reading data. Modifying a resource will always acquire an exclusive (X) lock on the resource to maintain the consistency of the resource; therefore, in a deadlock situation, identify the resource accesses that are read-only and try to avoid their corresponding lock requests by using the dirty read feature, if possible. You can use the following techniques to avoid the lock request on a contended resource:
- Implement row versioning.
- Decrease the isolation level.
- Use locking hints.
Implement Row Versioning
Instead of attempting to prevent access to resources using a more stringent locking scheme, you could implement row versioning through the READ_COMMITTED_SNAPSHOT isolation level or through the SNAPSHOT isolation level. The row versioning isolation levels are used to reduce blocking, as outlined in Chapter 12. Because they reduce blocking, which is the root cause of deadlocks, they can also help with deadlocks. By introducing READ_COMMITTED_SNAPSHOT with the following T-SQL, you can have a version of the rows available in tempdb, thus potentially eliminating the contention caused by the lock escalation in the preceding deadlock scenario:
ALTER DATABASE AdventureWorks2008R2
SET READ_COMMITTED_SNAPSHOT ON;
This will allow any necessary reads without causing lock contention since the reads are on a different version of the data. There is overhead associated with row versioning, especially in tempdb and when marshaling data from multiple resources instead of just the table or indexes used in the query. But that trade-off of increased tempdb overhead vs. the benefit of reduced deadlocking and increased concurrency may be worth the cost.
Decrease the Isolation Level
Sometimes the (S) lock requested by a SELECT statement contributes to the formation of circular blocking. You can avoid this type of circular blocking by reducing the isolation level of the transaction containing the SELECT statement to READ UNCOMMITTED. This will allow the SELECTstatement to read the data without requesting an (S) lock and thereby avoid the circular blocking. However, reading uncommitted data carries with it a serious issue by returning bad data to the client. You need to be in very dire straits to consider this as a method of eliminating your deadlocks.
Also check to see if the connections are setting themselves to be SERIALIZABLE. Sometimes online connection string generators will include this option, and developers will use it completely by accident.
Use Locking Hints
I absolutely do not recommend this approach. However, you can potentially resolve the deadlock presented in the preceding technique using the following locking hints:
- NOLOCK
- READUNCOMMITTED
Like the READ UNCOMMITTED isolation level, the NOLOCK or READUNCOMMITTED locking hint will avoid the (S) locks requested by a given session, thereby preventing the formation of circular blocking.
The effect of the locking hint is at a query level and is limited to the table (and its indexes) on which it is applied. The NOLOCK and READUNCOMMITTED locking hints are allowed only in SELECT statements and the data selection part of the INSERT, DELETE, and UPDATE statements.
The resolution techniques of minimizing lock contention introduce the side effect of a dirty read, which may not be acceptable in every transaction. A dirty read can involve missing rows or extra rows due to page splits and rearranging pages. Therefore, use these resolution techniques only in situations in which a very low quality of data is acceptable.
Summary
As you learned in this chapter, a deadlock is the result of conflicting blocking between processes and is reported to an application with the error number 1205. You can analyze the cause of a deadlock by collecting the deadlock information using various resources, but the extended event Xml_deadlock_report is probably the best.
You can use a number of techniques to avoid a deadlock; which technique is applicable depends upon the type of queries executed by the participating sessions, the locks held and requested on the involved resources, and the business rules governing the degree of isolation required. Generally, you can resolve a deadlock by reconfiguring the indexes and the transaction isolation levels. However, at times you may need to redesign the application or automatically reexecute the transaction on a deadlock.
In the next chapter, I cover the performance aspects of cursors and how to optimize the cost overhead of using cursors.