Chapter 15
![]()
Knowing how to identify performance issues and how to fix them is a great skill to have. The problem, though, is that you need to be able to demonstrate that the improvements you make are real improvements. While you can, and should, capture the performance metrics before and after you tune a query or add an index, the best way to be sure that you’re looking at real improvement is to put the changes youmake to work. Testing means more than simply running a query a few times and then putting it into your production system with your fingers crossed. You need to have a systematic way to validate performance improvements using the full panoply of queries that are run against your system in a realistic manner. SQL Server 2012 provides such a mechanism through its new Distributed Replay tool.
Distributed Replay works with information generated from the SQL Profiler and the trace events created by it.Trace events capture information in a somewhat similar fashion to extended events, buttrace events are an older (and somewhat less capable) mechanism for capturing events within the system. Prior to the release of SQL Server 2012, you could use SQL Server’s Profiler tool to replaycaptured events using a server-side trace. This worked, but the process was extremely limited. For example, the tool could only be run on a single machine, and it dealt with the playback mechanism—a single-threaded process that ran in a serial fashion, rather than what happens in reality. Microsofthas added exactly the capability to run from multiple machines in a parallel fashion to SQL Server 2012. Until Microsoft makes a mechanism to use Distributed Replay through extended event output, you’ll still be using the trace events for some of your performance testing.
This chapter covers the following topics:
- Concepts of database testing
- How to create a server-side trace
- Using Distributed Replay for database testing
Database Performance Testing
The general approach to database performance and load testing is pretty simple. You need to capture the calls against a production system under normal load, and then be able to play that load over and over again against a test system. This enables you to directly measure the changes in performance caused by changes to your code or structures. Unfortunately, accomplishing this in the real world is not so simple.
To start with, you can’t simply capture the recording of queries. Instead, you must first ensure that you can restore your production database to a moment in time on a test system. Specifically, you need to be able to restore to exactly the point at which you start recording the transactions on the system because, if you restore to any other point, you might have different data or even different structures. This will cause the playback mechanism to generate errors instead of useful information.
Once you establish the ability to restore to the appropriate time, you will need to configure your query capture mechanism—a server-side trace generated by Profiler,in this case.The playback mechanism will define exactly which events you’ll need to capture. You’ll want to set up your capture process so that it impacts your system as little as possible.
Next, you’ll have to deal with the large amounts of data captured by the trace. Depending on how big your system is, you may have a very large number of transactions over a short period of time. All that data has to be stored and managed, and there will be a great many files.
You can set up this process on a single machine; however,to really see the benefits, you’ll want to set up multiple machines to support the playback capabilities of the Distributed Replay tool. This means you’ll need to have these machines available to you as part of your testing process.
When you have all these various parts in place, you can begin testing. Of course, this leads to a new question:what exactly are you doing with your database testing?
As explained in Chapter 1, performance tuning your system is an iterative process that you may have to go through on multiple occasions to get your performance to where you need it to be and keep it there. Because of this, one of the most important things you can do for testing is to create a process that you can run over and over again.
The primary reason you need to create a repeatable testing process is because you can’t always be sure that the methods outlined in the preceding chapters of this book will work well in every situation. This doubt means you need to be able to validate that the changes you have made resulted in a positive improvement in performance. If not, you need to be able to remove any changes you’ve made, make a new set of changes, and then repeat the tests, repeating this process iteratively. You may find that you’ll need to repeat the entire tuning cycle until you’ve met your goals for this round.
Because of the iterative nature of this process, you absolutely need to concentrate on automating it as much as possible. This is where the Distributed Replay tool comes into the picture.
Distributed Replay
The Distributed Replay tool is made up of three different pieces of architecture:
- Distributed Replay Controller: This service manages the processes of the Distributed Replay system.
- Distributed Replay Administrator: This is an interface to allow you to control the Distributed Replay Controller and the Distributed Replace process.
- Distributed Replay Client: This is an interface that runs on one or more machines (up to 16) to make all the calls to your database server.
You can install all three components onto one machine; however, the ideal approach is to have the Controller on one machine, and then have one or moreclient machines that are completely separated from the Controller, so that each of these machines is handling different processing.
There is no interface for the Distributed Replay utility. Instead, you’ll use XML configuration files to take control of the different parts of the Distributed Replay architecture. Begin byinstalling the Distributed Replay Controller service onto a machine.For the purposes of illustration, I have all the components running on a single instance. Your first task is to capture a set of trace events using a predefined trace. You can use the distributed playback for various tasks, such as basic query playback, server-side cursors, or prepared server statements.
Since we’re primarily focused with query tuning, we’ll focus on the queries and prepared server statements
(also known as parameterized queries). This defines a particular set of events that must be captured;I’ll coverhow to do that in the next section.
Once the information is captured in a trace file, you will have to run that file through the pre-process event using the Distributed Replay Controller. This modifies the basic trace data into a different format that can be used to distribute to the various Replay Client machines. You can then fire off a replay process. The reformatted data is sent to the clients, which in turn will create queries to run against the target server. You can capture another trace output from the client machines to see exactly which calls they made, as well as the I/O and CPU of those calls. Presumably you’ll also set up standard monitoring on the target server in order to see how the load you are generating impacts that server.
When you go to run the system against your server, you can choose one of two types of playback:Synchronization mode or Stress mode. In Synchronization mode, you will get an exact copy of the original playback, although you can affect the amount of idle time on the system. This is good for precise performance tuning because it helps you understand how the system is working, especially if you’re making changes to structures, indexes, or TSQL code. Stress mode doesn’t run in any particular order, except within a single connection,where queries will be streamed in the correct order. In this case, the calls are made as fast as the client machines can make them—in any order—as fast as the server can receive them. In short, it performs a stress test. This is very useful for testing database designs or hardware installations.
Capturing Data with the Server Side Trace
Using trace events to capture data is very similar to capturing query executions with Extended Events. To support the Distributed Replay process,you’ll need to capture some very specific events and specific columns for those events. If you want to build your own trace events, you need to go after the events listed in Table 15-1.
Table 15-1. Events to Capture
|
Events |
Columns |
| Prepare SQL | Event Class |
| Exec Prepared SQL | EventSequence |
| SQL:BatchStarting | TextData |
| SQL:BatchCompleted | Application Name |
| RPC:Starting | LoginName |
| RPC:Completed | DatabaseName |
| RPC Output Parameter | Database ID |
| Audit Login | HostName |
| Audit Logout | Binary Data |
| Existing Connection | SPID |
| Start Time | |
| EndTime | |
| IsSystem |
You have two options for setting up these events. First, you can use TSQL. Second, you can use an external tool called Profiler. While Profiler can connect directly to your SQL Server instance, I strongly recommend against using this tool to capture data. Profiler is best used as a way to supply a template for performing the capture.You should use TSQL to generate the actual server-side trace.
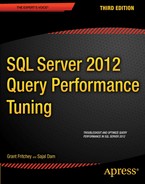
On a test or development machine, open Profiler and select TSQL_Replay from the Template list, as shown in Figure 15-1.
Since you need a file for Distributed Replay, you’ll want to save the output of the trace to file. It’s the best way to set up a server-side trace anyway, so this works out. You’ll want to output to a location that has sufficient space. Depending on the number of transactions you have to support with your system, trace files can be extremely large. Also, it’s a good idea to put a limit on the size of the files and allow them to rollover, creating new files as needed. You’ll have more files to deal with, but the operating system can actually deal with a larger number of smaller files for writes better than it can deal with a single large file. I’ve found this to be true because of two things. First, with a smaller file size, you get a quicker rollover, which means the previous file is available for processing if you need to load it into a table or copy it to another server. Second, it seems that it generally takes longer for writes to occur with simple log files as the size of such files gets very large. I would also suggest defining a stop time for the trace process; again, this helps ensure that you don’t fill the drive you’ve designated for storing the trace data.
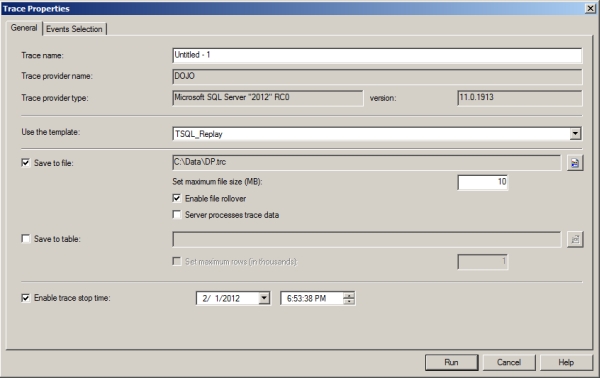
Since this is a template, the events and columns have already been selected for you. You can validate
the events and columns to ensure you are getting exactly what you need by clicking the Events Selection tab. Figure 15-2 shows some of the events and columns, all of which arepredefined for you.k
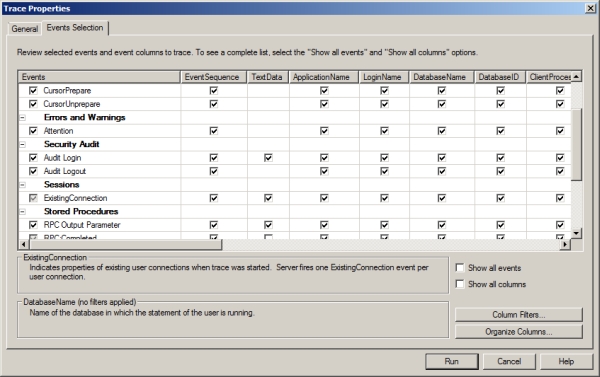
Figure 15-2. The TSQL_Replay template events and columns
This template is generic, so it includes the full list of events, including all the cursor events. You can edit it by clicking boxes to deselect events; however, I do not recommend removing anything other than the cursor events, if you’re going to remove any.
I started this template connected to a test server instead of to a production machine because, once you’ve set it up appropriately, you have to start the trace by clicking Run. I wouldn’t do that on a production system. On a test system, however, you can watch the screen to ensure you’re getting the events you think you should. It will display the events, as well as capture them to a file. When you’re satisfied that it’s correct, you can pause the trace. Next, click the File menu, and then selectExport>Script Trace Definition. Finally, select For SQL Server 2005 – SQL 11(see Figure 15-3).
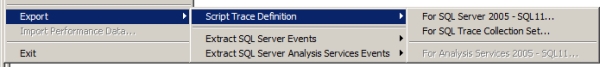
Figure 15-3. The menu selection to output the trace definition
This template will allow you to save the trace you just created as a TSQL file. Once you have the TSQL, you can configure it to run on any server that you like. The file path will have to be replaced, and you can reset the stop time through parameters within the script. The following script shows the very beginning of the TSQL process used to set upthe server-side trace events:
/****************************************************/
/* Created by: SQL Server 2012 RC0 Profiler */
/* Date: 03/07/2012 10:18:37 PM */
/****************************************************/
-- Create a Queue
declare@rcint
declare@TraceIDint
declare@maxfilesizebigint
set@maxfilesize= 5
-- Please replace the text InsertFileNameHere, with an appropriate
-- filename prefixed by a path, e.g., c:MyFolderMyTrace.
-- The .trc extension
-- will be appended to the filename aut
omatically.
-- If you are writing from
-- remote server to local drive, please use UNC path
-- and make sure server has
-- write access to your network share
exec @rc = sp_trace_create @TraceID output,
0,
N’InsertFileNameHere’,
@maxfilesize,
NULL
if (@rc != 0)gotoerror
You can edit the path where it says InsertFileNameHere and provide different values for @DateTime. At this point, your script can be run on any server.
The amount of information you collect really depends on what kind of test you want to run. For a standard performance test, it’s probably a good idea to collect at least one hour’s worth of information; however, you wouldn’t want to capture more than two to three hours of data in most circumstances. Capturing more than that would entail managing a lot more data, and it would mean that you were planning on running your tests for a very long time.
Before you capture the data, you do need to think about where you’re going to run your tests. Let’s assume that you’re not worried about disk space and that you don’t need to protect legally audited data (if you have those issues, you’ll need to address them separately). If your database is not in Full Recovery mode, then you can’t use the log backups to restore it to a point in time. If this is the case, I strongly recommend running a database backup as part of starting the trace data collection. The reason for this is that you need the database to be in exactly the same condition it’s in when you start recording transactions. If it’s not, you may get a larger number of errors, which could seriously change the way your performance tests run. If your database remains in the same state that it was at or near the beginning of your trace, then you should have very few, if any, errors.
With a copy of the database ready to go and a set of trace data, you’re ready to run the Distributed Replay.
Distributed Replay for Database Testing
Assuming you used the replay template to capture your trace information, you should be ready to start processing the files. As noted earlier, the first step is to convert the trace file into a different format, one that can be split up among multiple client machines for playback. But there is more to it than simply running the executable against your file. You also need to make some decisions about how you want the distributed replay to run; you make those decisions when you pre-process the trace file.
The decisions are fairly straightforward. First, you need to decide if you’re going to replay system processes along with the user processes. Unless you’re dealing with the potential of specific system issues, I’d suggest setting this value to No. This is also the default value. Second, you need to decide how you want to deal with idle time. You can use the actual values for how often calls were made to the database; or, you can put in a value, measured in seconds, to limit the wait time to no more than that value. It really depends on what type of playback you’re going to run. Assuming you use Synchronization mode playback, the modebest suited for straight performance measurement, it’s a good idea to eliminate idle time by setting the value to something low, such as three to five seconds.
If you choose to use the default values, you don’t need to modify the configuration file. But if you’ve chosen to include the system calls or to change the idle time, then you’ll need to change the configuration file, DReplay.Exe.Preprocess.config. It’s a simple XML configuration file;the one I’m using looks like this:
<?xml version=”1.0” encoding=”utf-8”?>
<Options>
<PreprocessModifiers>
<IncSystemSession>No</IncSystemSession>
<MaxIdleTime>2</MaxIdleTime>
</PreprocessModifiers>
</Options>
I’ve made only one change, adjustingMaxIdelTime to limit any down period during the playback.
Before you run the pre-processing, make sure that you have installed the DRController and that the DReplay service is running on your system. If so, you’ll just need to call DReplay.exe to execute the pre-processing:
dreplay preprocess –i c:datadr.trc –d c:DRProcess
In the preceding code,you can see thatdreplay runs the preprocess event. The input file was supplied by the –i parameter, anda folder to hold the output was supplied through the –d parameter. The trace files will be processed, and the output will go to the folder specified. The output will look something like Figure 15-4.
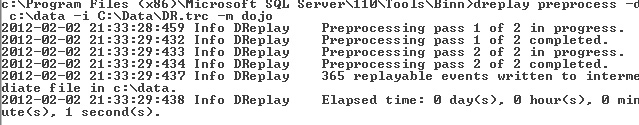
Figure 15-4. Output from the pre-processing steps of Distributed Replay
With the pre-processing complete, you’re ready to move ahead with running the distributed replay process. Before you do so, however, you need to make sure you have one or more client systems ready to go.
Configuring the Client
The client machines will have to be configured to work with the Distributed Replay controller. Begin by installingyour clients to the different machines. For illustration purposes only, I’m running everything on a single machine; however, the setup is no different if you use multiple machines. You need to configure the client to work with a controller, and a client can only work with one controller at a time. You also have to have space on the system for two items. First, you need a location for working files that are overwritten at each replay. Second, you need room for trace file output from the client if you want to collect execution data from that client. You also get to decide on the logging level of the client process. All of this is set in another XML configuration file, DReplayClient.config. Here is my configuration:
<Options>
<Controller>DOJO</Controller>
<WorkingDirectory>C:DRClientWork</WorkingDirectory>
<ResultDirectory>C:DRClientOutput</ResultDirectory>
<LoggingLevel>CRITICAL</LoggingLevel>
</Options>
The directories and logging level are clear. I also had to point the client to the server where the Distributed Replay service is running. No other settings are required for multiple clients to work; you just need to be sure that they’re going to the right controller system.
+1
Running the Distributed Tests
So far you have configured everything and captured the data. Next, you need to go back to the command line to run things from the Dreplay.exe. Most of the control is accomplished through the configuration files, so there is very little input required in the executable. You invoke the tests using the following command:
Dreplay replay –d c:data –w DOJO
You need to feed in the location of the output from the preprocessing, which means you need to list the client machines that are taking part in a comma delimited list. The output from the execution would look something like Figure 15-5.
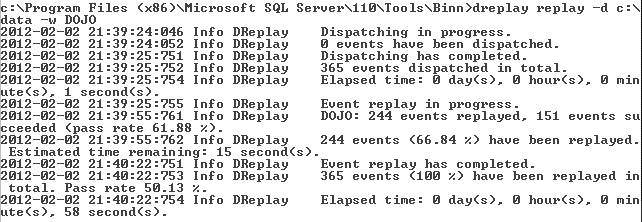
Figure 15-5. The output from running DReplay.exe
As 1you can see, 365 events were captured, but only 244 events were replayed. Of those, only 151 events actually succeeded. In this case, you might need to establish what information might exist about why some of the events failed. To do so, simply reconfigure the tests and run them again. The whole idea behind having a repeatable testing process is that you can run it over and over. The preceding example represents a light load run against my local copy of AdventureWorks2008R2, captured over about five minutes. However, I configured the limits on idle time, so the replay completes in only 58 seconds.
From here, you can reconfigure the tests, reset the database, and run the tests over and over again, as needed. Note that changing the configuration files will require you to restart the associated services to ensure that the changes are implemented with the next set of tests.
When running these tests, it’s a very good idea to use the types of performance data collection we talked about in Chapters 2 and 3. This helps you ensure that you can see exactly how well—or how badly—your tests are performing.
Conclusion
With the inclusion of the Distributed Replay utilities, SQL Server now gives you the ability to perform load and function testing against your databases. You accomplish this by capturing your code in a simple manner with a server-side trace. If you plan to take advantage of this feature, however, be sure to validate that the changes you make to queries based on the principles put forward in this book actually work and will help improve the performance of your system. You should also make sure you reset the database to avoid errors as much as possible.