
![]()
This chapter contains a variety of topics we haven’t had the opportunity to discuss elsewhere. Although small, they are extremely important for high-performance applications. There is no unifying thread to guide you through this chapter but the desire to obtain top-notch performance in simple tight loops and complex applications alike.
We begin the chapter with JIT compiler optimizations, which are vital for good performance of CPU-bound applications. Next, we discuss startup performance, which can be critical for client applications that exercise the user’s patience. Finally, we discuss processor-specific optimizations, including data- and instruction-level parallelism, and several smaller topics.
Earlier in this book we have seen the importance of some optimizations performed by the JIT compiler. Specifically, in Chapter 3 we have discussed inlining in some detail when investigating the method dispatch sequences for virtual and non-virtual methods. In this section we summarize the primary optimizations performed by the JIT compiler, and how to make sure your code does not thwart the JIT compiler’s ability to carry out these optimizations. JIT optimizations mostly affect the performance of CPU-bound applications, but are relevant, to some extent, to other types of programs as well.
To inspect these optimizations you must attach the debugger to a running process—the JIT compiler will not perform optimizations when it detects the presence of a debugger. Specifically, when you attach to the process you must make sure that the methods you want to inspect have already been called and compiled.
If for some reason you would like to disable JIT optimizations—for example, to make debugging easier in face of inlining and tail calls (discussed later)—you don’t have to modify the code or use a Debug build. Instead, you can create an .ini file that has the same name as your application executable (for example, MyApp.ini) and put the following three lines in it. When placed next to your executable on the next launch, it will inhibit the JIT compiler from performing any optimizations.
[.NET Framework Debugging Control]
GenerateTrackingInfo = 1
AllowOptimize = 0
Standard Optimizations
There are some standard optimizations performed by every optimizing compiler, even simple ones. For example, the JIT is able to reduce the following C# code to only a couple of x86 machine code instructions:
//Original C# code:
static int Add(int i, int j) {
  return i + j;
}
static void Main() {
  int i = 4;
  int j = 3*i + 11;
  Console.WriteLine(Add(i, j));
}
; Optimized x86 assembly code
call 682789a0       ; System.Console.get_Out()
mov ecx,eax
mov edx,1Bh       ; Add(i,j) was folded into its result, 27 (0x1B)
mov eax,dword ptr [ecx]       ; the rest is standard invocation sequence for the
mov eax,dword ptr [eax + 38h]       ; TextWriter.WriteLine virtual method
call dword ptr [eax + 14h]
![]() Note It is not the C# compiler that performs this optimization. If you inspect the generated IL code, the local variables are there, as is the call to the Add method. The JIT compiler is responsible for all optimizations.
Note It is not the C# compiler that performs this optimization. If you inspect the generated IL code, the local variables are there, as is the call to the Add method. The JIT compiler is responsible for all optimizations.
This optimization is called constant folding, and there are many similar simple optimizations, such as common subexpression reduction (in a statement like a + (b * a) – (a * b * c), the value a * b need only be calculated once). The JIT compiler performs these standard optimizations, but often fares considerably worse compared to optimizing compilers such as the Microsoft Visual C++ compiler. The reason is that the JIT compiler has a very constrained execution environment, and must be able to compile methods quickly to prevent significant delays when they are first called.
This optimization often reduces code size and almost always decreases execution time by replacing method call sites with the callee’s body. As we have seen in Chapter 3, virtual methods are not inlined by the JIT compiler (even if a sealed method is called on a derived type); interface methods undergo partial inlining with speculative execution; only static and non-virtual methods can always be inlined. For performance critical code, such as simple properties and methods on very commonly accessed infrastructure classes, make sure to avoid virtual methods and interface implementations.
The exact criteria used by the JIT compiler to determine which methods to inline are not publicly available. Some heuristics can be discovered by experimentation:
- Methods with complex call graphs (e.g. loops) are not inlined.
- Methods with exception handling are not inlined.
- Recursive methods are not inlined.
- Methods that have non-primitive value type parameters, local variables, or return values are not inlined.
- Methods with bodies larger than 32 bytes of IL are not inlined. (The MethodImplOptions.AggressiveInlining value of the [MethodImpl] attribute overrules this limitation.)
In recent versions of the CLR, some artificial limitations on inlining were removed. For example, as of .NET 3.5 SP1, the 32-bit JIT compiler is able to inline methods that accept some non-primitive value type parameters, like Chapter 3’s Point2D. The changes made in that release replace operations on value types by equivalent operations on primitive types under certain conditions (Point2D is transformed to two ints), and allow better optimization of struct-related code in general, such as copy propagation, redundant assignment elimination, and others. For example, consider the following trivial code:
private static void MethodThatTakesAPoint(Point2D pt) {
  pt.Y = pt.X ^ pt.Y;
  Console.WriteLine(pt.Y);
}
Point2D pt;
pt.X = 3;
pt.Y = 5;
MethodThatTakesAPoint(pt);
Using the CLR 4.5 JIT compiler, this entire section of code is compiled to the moral equivalent of Console.WriteLine(6), which is the result of 3 ^ 5. The JIT compiler is able to use inlining and constant propagation on the custom value type. When using the CLR 2.0 JIT compiler, an actual call to the method is emitted at the call site, and inside the method there is no visible optimization:
; calling code
mov eax,3
lea edx,[eax + 2]
push edx
push eax
call dword ptr ds:[1F3350h] (Program.MethodThatTakesAPoint(Point2D), mdToken: 06000003)

; method code
push ebp
mov ebp,esp
mov eax,dword ptr [ebp + 8]
xor dword ptr [ebp + 0Ch],eax
call mscorlib_ni + 0x22d400 (715ed400) (System.Console.get_Out(), mdToken: 06000773)
mov ecx,eax
mov edx,dword ptr [ebp + 0Ch]
mov eax,dword ptr [ecx]
call dword ptr [eax + 0BCh]
pop ebp
ret 8
Although there is no way to force inlining if the JIT compiler is not willing to perform it, there is a way to turn off inlining. The MethodImplOptions.NoInlining value of the [MethodImpl] attribute disables inlining of the specific method on which it is placed—incidentally, this is quite useful for micro-benchmarking, discussed in Chapter 2.
When accessing array elements, the CLR must make sure that the index used to access the array is within the bounds of the array. If this check was not made, memory safety would be compromised; you could initialize a byte[] object and index it with negative and positive indices to read/write any location in memory. Although absolutely necessary, this range check has a performance cost of a few instructions. Below is the code emitted by the JIT compiler for a standard array access:
//Original C# code:
uint[] array = new uint[100];
array[4] = 0xBADC0FFE;
; Emitted x86 assembly instructions
mov ecx,offset 67fa33aa             ; type of array element
mov edx,64h             ; array size
call 0036215c             ; creates a new array (CORINFO_HELP_NEWARR_1_VC)
cmp dword ptr [eax + 4],4             ; eax + 4 contains the array length, 4 is the index
jbe NOT_IN_RANGE             ; if the length is less than or equal the index, jump away
mov dword ptr [eax + 18h],0BADC0FFEh             ; the offset was calculated at JIT time (0x18 = 8 + 4*4)
; Rest of the program's code, jumping over the NOT_IN_RANGE label
NOT_IN_RANGE:
call clr!JIT_RngChkFail             ; throws an exception
There is a specific case in which the JIT compiler can eliminate the range-check for accessing array elements—an indexed for loop that visits every array element. Without this optimization, accessing arrays would always be slower than in unmanaged code, which is an unacceptable performance hit for scientific applications and memory-bound work. For the following loop, the JIT compiler will eliminate the range check:
//Original C# code:
for (int k = 0; k < array.Length; ++k) {
    array[k] = (uint)k;
}
; Emitted x86 assembly instructions (optimized)
xor edx,edx             ; edx = k = 0
mov eax,dword ptr [esi + 4]             ; esi = array, eax = array.Length
test eax,eax             ; if the array is empty,
jle END_LOOP             ; skip the loop
NEXT_ITERATION:
mov dword ptr [esi + edx*4 +8],edx             ; array[k] = k
inc edx             ; ++k
cmp eax,edx             ; as long as array.Length > k,
jg NEXT_ITERATION             ; jump to the next iteration
END_LOOP:
There is only a single check during the loop, and it’s the check that makes sure the loop terminates. However, the array access inside the loop is not checked—the highlighted line writes to the k-th element in the array without making sure (again) that k is within the array bounds.
Unfortunately, it is also fairly easy to impede this optimization. Some changes to the loop, which appear quite innocent, may have the adverse effect of forcing a range check when accessing the array:
//The range-check elimination occurs
for (int k = 0; k < array.Length - 1; ++k) {
    array[k] = (uint)k;
}
//The range-check elimination occurs
for (int k = 7; k < array.Length; ++k) {
    array[k] = (uint)k;
}
//The range-check elimination occurs
//The JIT removes the -1 from the bounds check and starts from the second element
for (int k = 0; k < array.Length - 1; ++k) {
    array[k + 1] = (uint)k;
}
//The range-check elimination does not occur
for (int k = 0; k < array.Length / 2; ++k) {
    array[k * 2] = (uint)k;
}
//The range-check elimination does not occur
staticArray = array; //"staticArray" is a static field of the enclosing class
for (int k = 0; k < staticArray.Length; ++k) {
    staticArray[k] = (uint)k;
}
To summarize, range-check elimination is a fragile optimization, and you would do well to make sure that performance-critical sections of your code enjoy this optimization, even if it means that you have to inspect the assembly code generated for your program. For more details on range-check elimination and additional corner cases, see the article “Array Bounds Check Elimination in the CLR” by Dave Detlefs on http://blogs.msdn.com/b/clrcodegeneration/archive/2009/08/13/array-bounds-check-elimination-in-the-clr.aspx.
Tail Call
Tail calling is an optimization that reuses the stack frame of an existing method to call another method. This optimization is very useful for many types of recursive algorithms. In fact, some recursive methods can be as efficient as iteration-based ones if tail call optimization is employed pervasively. Consider the following recursive method, which calculates the greatest common divisor of two integers:
public static int GCD(int a, int b) {
  if (b == 0) return a;
  return GCD(b, a % b);
}
Clearly, the recursive invocation of GCD(b, a % b) is not subject to inlining—it is a recursive invocation, after all. However, because the caller and callee’s stack frames are fully compatible, and because the caller does not do anything after the recursive invocation, a possible optimization would be to rewrite this method as follows:
public static int GCD(int a, int b) {
START:
  if (b == 0) return a;
  int temp = a % b;
  a = b;
  b = temp;
  goto START;
}
This rewrite does away with all method invocations—effectively, the recursive algorithm has been turned into an iterative one. Although you could perform this rewrite by hand every time you encountered the possibility, the JIT compiler will do it automatically under some circumstances. Below are two versions of the GCD method—the first compiled with the CLR 4.5 32-bit JIT compiler and the second with the CLR 4.5 64-bit JIT compiler:
; 32-bit version, parameters are in ECX and EDX
push ebp
mov ebp,esp
push esi
mov eax,ecx             ; EAX = a
mov ecx,edx             ; ECX = b
test ecx,ecx             ; if b == 0, returning a
jne PROCEED
pop esi
pop ebp
ret
PROCEED:
cdq
idiv eax,ecx             ; EAX = a / b, EDX = a % b
mov esi,edx
test esi,esi             ; if a % b == 0, returning b (inlined base of recursion)
jne PROCEED2
mov eax,ecx
jmp EXIT
PROCEED2:
mov eax,ecx
cdq
idiv eax,esi
mov ecx,esi             ; recursive call on the next line
call dword ptr ds:[3237A0h] (Program.GCD(Int32, Int32), mdToken: 06000004)
EXIT:
pop esi
pop ebp
ret             ; reuses return value (in EAX) from recursive return
; 64-bit version, parameters in ECX and EDX
sub rsp,28h             ; construct stack frame – happens only once!
START:
mov r8d,edx
test r8d,r8d             ; if b == 0, return a
jne PROCEED
mov eax,ecx
jmp EXIT
PROCEED:
cmp ecx,80000000h
jne PROCEED2:
cmp r8d,0FFFFFFFFh
je OVERFLOW             ; miscellaneous overflow checks for arithmetic
xchg ax,ax             ; two-byte NOP (0x66 0x90) for alignment purposes
PROCEED2:
mov eax,ecx
cdq
idiv eax,r8d             ; EAX = a / b, EDX = a % b
mov ecx,r8d             ; reinitialize parameters
mov r8d,edx             ; . . .
jmp START             ; and jump back to the beginning (no function call)
xchg ax,ax             ; two-byte NOP (0x66 0x90) for alignment purposes
EXIT:
add rsp,28h
ret
OVERFLOW:
call clr!JIT_Overflow
nop
It becomes evident that the 64-bit JIT compiler uses the tail call optimization to get rid of the recursive method invocation, whereas the 32-bit JIT compiler does not. A detailed treatment of the conditions that the two JIT compilers use for determining whether tail call can be employed is beyond the scope of this book—below are some of the heuristics:
- The 64-bit JIT compiler is quite relaxed in terms of tail calling, and will often perform a tail call even if the language compiler (e.g. the C# compiler) did not suggest it by using the tail. IL prefix.
- Calls followed by additional code (other than returning from the method) are not subject to tail calling. (Slightly relaxed in CLR 4.0.)
- Calls to a method that returns a different type than the caller.
- Calls to a method that has too many parameters, unaligned parameters, or parameter/return types that are large value types. (Relaxed considerably in CLR 4.0.)
- The 32-bit JIT compiler is less inclined to perform this optimization, and will emit tail calls only if instructed to do so by the tail. IL prefix.
![]() Note A curious aspect of tail calling implications is the case of an infinite recursion. If you have a bug with the recursion’s base case that would cause an infinite recursion, but the JIT compiler was able to turn the recursive method call into a tail call, the usual StackOverflowException outcome that is the result of infinite recursion turns into an infinite loop!
Note A curious aspect of tail calling implications is the case of an infinite recursion. If you have a bug with the recursion’s base case that would cause an infinite recursion, but the JIT compiler was able to turn the recursive method call into a tail call, the usual StackOverflowException outcome that is the result of infinite recursion turns into an infinite loop!
More details on the tail. IL prefix used to suggest tail calling to reluctant JIT compilers and on the criteria used by the JIT compiler to perform tail calling are available online:
- The tail. IL prefix, which the C# compiler does not emit, but is used frequently by functional language compilers (including F#) is described on the MSDN, as part of the System.Reflection.Emit class page: http://msdn.microsoft.com/en-us/library/system.reflection.emit.opcodes.tailcall.aspx.
- The list of conditions for performing a tail call in the JIT compiler (prior to CLR 4.0) is detailed in David Broman’s article, “Tail call JIT conditions”, at http://blogs.msdn.com/b/davbr/archive/2007/06/20/tail-call-jit-conditions.aspx.
- The tail calling optimization changes in the CLR 4.0 JIT compiler are described in depth in the article “Tail Call Improvements in .NET Framework 4”, at http://blogs.msdn.com/b/clrcodegeneration/archive/2009/05/11/tail-call-improvements-in-net-framework-4.aspx.
For client applications, quick startup is a great first impression to make on the user or a potential client evaluating the product or taking a demo. However, the more complex the application, the harder it is to maintain acceptable startup times. It’s important to differentiate between cold startup, when the application is launched for the first time after the system has just finished booting, and warm startup, when the application is launched (not for the first time) after the system has been used for some time. Always-on system services or background agents need fast cold startup times, so as to prevent the system startup sequence and user logon from taking too long. Typical client applications such as email clients and Web browsers might get away with slightly longer cold startup times, but users will expect them to launch rapidly when the system has been used for a while. Most users will want short startup times in both cases.
There are several factors that go into long startup times. Some of them are relevant only for cold startup; others are relevant for both types of startup.
- I/O operations—to launch the application, Windows and the CLR must load from the disk the application’s assemblies as well as .NET Framework assemblies, CLR DLLs, and Windows DLLs. This factor is relevant mostly for cold startup.
- JIT compilation—every method called for the first time during application startup must be compiled by the JIT compiler. Because code compiled by the JIT is not preserved when the application terminates, this factor is relevant for both cold and warm startup.
- GUI initialization—depending on your GUI framework (Metro, WPF, Windows Forms, etc.), there are GUI-specific initialization steps that must take place for the user interface to be displayed. This factor is relevant for both types of startup.
- Loading application-specific data—your application might require some information from files, databases, or Web services to display its initial screen. This factor is relevant for both types of startup, unless your application employs some caching scheme for this data.
We have several measurement tools at our disposal to diagnose long startup times and their likely causes (see Chapter 2). Sysinternals Process Monitor can point to I/O operations performed by the application’s process, regardless of whether Windows, the CLR, or the application code initiated them. PerfMonitor and the .NET CLR JIT performance counter category can help diagnose excessive JIT compilation during application startup. Finally, “standard” profilers (in sampling or instrumentation modes) can determine how your application is spending its time during startup.
Additionally, there is a simple experiment you can perform that will tell you whether I/O is the primary cause of slow startup times: time your application’s cold startup and warm startup scenarios (you should use a clean hardware environment for these tests, and make sure there are no unnecessary services or other initialization taking place in the cold startup test). If the warm startup is significantly faster than the cold startup, I/O is the chief culprit.
Improving your application-specific data loading is up to you; every guideline we can issue would be too general to use in practice (other than providing a splash screen to stretch your users’ patience…). However, we can offer several remedies for poor startup performance that originates from I/O operations and JIT compilation. Optimizing your application’s startup time can cut it down in half or more, in some cases.
Pre-JIT Compilation with NGen (Native Image Generator)
Although the JIT compiler is very convenient and compiles methods only when they are called, there is still a performance cost that your application pays whenever the JIT runs. The .NET Framework offers an optimization tool, called Native Image Generator (NGen.exe), which can compile your assemblies to machine code (native images) before runtime. If every assembly your application requires is pre-compiled in this manner, there will be no need to load the JIT compiler and to use it during application startup. Although the generated native image is likely to be larger than the original assembly, in most cases the amount of disk I/O on cold startup actually decreases, because the JIT compiler itself (clrjit.dll) and metadata for referenced assemblies aren’t read from disk.
Pre-compilation has another advantageous effect—native images can be shared between processes, unlike code that the JIT compiler emits at runtime. If several processes on the same machine use a native image for some assembly, physical memory consumption is lower than in the JIT-compiled case. This is especially important in shared-system scenarios, when multiple users connect through Terminal Services sessions to a single server, and run the same application.
To pre-compile your application, all you need to do is point the NGen.exe tool, which resides in the .NET Framework’s directory, to your application’s main assembly (typically an .exe file). NGen will proceed to locate all the static dependencies your main assembly has and pre-compile them all to native images. The resulting native images are stored in a cache that you do not have to manage—it is stored next to the GAC, in the C:WindowsAssemblyNativeImages_* folders by default.
![]() Tip Because the CLR and NGen manage the native image cache automatically, you should never copy the native images from one machine to another. The only supported way to pre-compile managed assemblies on a specific system is to run the NGen tool on that system. The ideal time to do this would be during the application’s installation (NGen even supports a “defer” command, which will queue pre-compilation to a background service). This is what the. NET Framework installer does for frequently used .NET assemblies.
Tip Because the CLR and NGen manage the native image cache automatically, you should never copy the native images from one machine to another. The only supported way to pre-compile managed assemblies on a specific system is to run the NGen tool on that system. The ideal time to do this would be during the application’s installation (NGen even supports a “defer” command, which will queue pre-compilation to a background service). This is what the. NET Framework installer does for frequently used .NET assemblies.
Below is a complete example of using NGen to pre-compile a simple application that consists of two assemblies—the main .exe file, and an auxiliary .dll referenced by it. NGen successfully detects the dependency and pre-compiles both assemblies to native images:
> c:windowsmicrosoft.netframeworkv4.0.30319
gen install Ch10.exe
Microsoft (R) CLR Native Image Generator - Version 4.0.30319.17379
Copyright (c) Microsoft Corporation. All rights reserved.

Installing assembly D:CodeCh10.exe
1> Compiling assembly D:CodeCh10.exe (CLR v4.0.30319) . . .
2> Compiling assembly HelperLibrary, . . . (CLR v4.0.30319) . . .
At runtime, the CLR uses the native images and does not require clrjit.dll to be loaded at all (in the lm command’s output below, clrjit.dll is not listed). Type method tables (see Chapter 3), also stored in the native images, point to the pre-compiled versions inside the native image boundaries.
0:007 > lm

start end module name
01350000 01358000 Ch10 (deferred)
2f460000 2f466000 Ch10_ni (deferred)
30b10000 30b16000 HelperLibrary_ni (deferred)
67fa0000 68eef000 mscorlib_ni (deferred)
6b240000 6b8bf000 clr (deferred)
6f250000 6f322000 MSVCR110_CLR0400 (deferred)
72190000 7220a000 mscoreei (deferred)
72210000 7225a000 MSCOREE (deferred)
74cb0000 74cbc000 CRYPTBASE (deferred)
74cc0000 74d20000 SspiCli (deferred)
74d20000 74d39000 sechost (deferred)
74d40000 74d86000 KERNELBASE (deferred)
74e50000 74f50000 USER32 (deferred)
74fb0000 7507c000 MSCTF (deferred)
75080000 7512c000 msvcrt (deferred)
75150000 751ed000 USP10 (deferred)
753e0000 75480000 ADVAPI32 (deferred)
75480000 75570000 RPCRT4 (deferred)
75570000 756cc000 ole32 (deferred)
75730000 75787000 SHLWAPI (deferred)
75790000 757f0000 IMM32 (deferred)
76800000 7680a000 LPK (deferred)
76810000 76920000 KERNEL32 (deferred)
76920000 769b0000 GDI32 (deferred)
775e0000 77760000 ntdll (pdb symbols)

0:007 > !dumpmt -md 2f4642dc
EEClass: 2f4614c8
Module: 2f461000
Name: Ch10.Program
mdToken: 02000002
File: D:CodeCh10.exe
BaseSize: 0xc
ComponentSize: 0x0
Slots in VTable: 6
Number of IFaces in IFaceMap: 0
--------------------------------------
MethodDesc Table
    Entry MethodDe JIT Name
68275450 68013524 PreJIT System.Object.ToString()
682606b0 6801352c PreJIT System.Object.Equals(System.Object)
68260270 6801354c PreJIT System.Object.GetHashCode()
68260230 68013560 PreJIT System.Object.Finalize()
2f464268 2f46151c PreJIT Ch10.Program..ctor()
2f462048 2f461508 PreJIT Ch10.Program.Main(System.String[])

0:007 > !dumpmt -md 30b141c0
EEClass: 30b114c4
Module: 30b11000
Name: HelperLibrary.UtilityClass
mdToken: 02000002
File: D:CodeHelperLibrary.dll
BaseSize: 0xc
ComponentSize: 0x0
Slots in VTable: 6
Number of IFaces in IFaceMap: 0
--------------------------------------
MethodDesc Table
    Entry MethodDe JIT Name
68275450 68013524 PreJIT System.Object.ToString()
682606b0 6801352c PreJIT System.Object.Equals(System.Object)
68260270 6801354c PreJIT System.Object.GetHashCode()
68260230 68013560 PreJIT System.Object.Finalize()
30b14158 30b11518 PreJIT HelperLibrary.UtilityClass..ctor()
30b12048 30b11504 PreJIT HelperLibrary.UtilityClass.SayHello()
Another useful option is the “update” command, which forces NGen to recalculate the dependencies for all native images in the cache and pre-compile again any modified assemblies. You would use this after installing an update on the target system, or during development.
![]() Note Theoretically, NGen could use a completely different—and larger—set of optimizations than what the JIT compiler uses at runtime. After all, NGen is not as time-bound as the JIT compiler. However, at the time of writing, NGen has no optimizations up its sleeve other than those the JIT compiler employs.
Note Theoretically, NGen could use a completely different—and larger—set of optimizations than what the JIT compiler uses at runtime. After all, NGen is not as time-bound as the JIT compiler. However, at the time of writing, NGen has no optimizations up its sleeve other than those the JIT compiler employs.
When using CLR 4.5 on Windows 8, NGen does not passively wait for your instructions to pre-compile application assemblies. Instead, the CLR generates assembly usage logs that are processed by NGen’s background maintenance task. This task decides, periodically, which assemblies would benefit from pre-compilation, and runs NGen to create native images for them. You can still use NGen’s “display” command to review the native image cache (or inspect its files from a command line prompt), but much of the burden of deciding which assemblies would benefit from pre-compilation is now at the CLR’s discretion.
Multi-Core Background JIT Compilation
Starting in CLR 4.5, you can instruct the JIT compiler to generate a profile of methods executed during application startup, and use that profile on subsequent application launches (including cold startup scenarios) to compile these methods in the background. In other words, while your application’s main thread is initializing, the JIT compiler executes on background threads such that methods are likely to be already compiled by the time they are needed. The profile information is updated on each run, so it will remain fresh and up to date even if the application is launched for hundreds of times with different configurations.
![]() Note This feature is enabled by default in ASP.NET and Silverlight 5 applications.
Note This feature is enabled by default in ASP.NET and Silverlight 5 applications.
To opt into using multi-core background JIT compilation, you call two methods on the System.Runtime.ProfileOptimization class. The first method tells the profiler where the profiling information can be stored, and the second method tells the profiler which startup scenario is being executed. The purpose of the second method is to distinguish between considerably different scenarios, such that the optimization is tailored for the specific scenario. For example, an archiving utility may be invoked with a “display files in archive” parameter, which requires one set of methods, and a “create compressed archive from directory” parameter, which requires a completely different set of methods:
public static void Main(string[] args) {
  System.Runtime.ProfileOptimization.SetProfileRoot(
    Path.GetDirectoryName(Assembly.GetExecutingAssembly().Location));
  if (args[0] == "display") {
    System.Runtime.ProfileOptimization.StartProfile("DisplayArchive.prof");
  } else if (args[0] == "compress") {
    System.Runtime.ProfileOptimization.StartProfile("CompressDirectory.prof");
  }
  //. . .More startup scenarios
  //The rest of the application's code goes here, after determining the startup scenario
}
A common approach to minimizing I/O transfer costs is by compressing the original data. After all, it would make little sense to download a 15GB uncompressed Windows installation if it can fit—in compressed form—on a single DVD. The same idea can be used with managed applications stored on disk. Compressing the application and decompressing it only after loading it into memory can significantly decrease cold startup costs by reducing the number of I/O operations performed on startup. Compression is a double-edged sword, because of CPU time required to decompress the application’s code and data in memory, but it can be worthwhile to pay the price in CPU time when reducing cold startup costs is critical, such as with a kiosk application that has to launch as quickly as possible after the system is turned on.
There are several commercial and open source compression utilities for applications (usually called packers). If you use a packer, make sure it can compress .NET applications—some packers will only work well with unmanaged binaries. One example of a tool that compresses .NET applications is MPress, which is freely available online at http://www.matcode.com/mpress.htm. Another example is the Rugland Packer for .NET Executables (RPX), an open source utility published at http://rpx.codeplex.com/. Below is some sample output from RPX when run on a very small application:
> Rpx.exe Shlook.TestServer.exe Shlook.Common.dll Shlook.Server.dll
Rugland Packer for (.Net) eXecutables 1.3.4399.43191
![]()
Unpacked size :..............27.00 KB
 Packed size :..............13.89 KB
 Compression :..............48.55%
 ─────────────────────────────────────────
 Application target is the console
 ─────────────────────────────────────────
 Uncompressed size :..............27.00 KB
 Startup overhead :...............5.11 KB
 Final size :..............19.00 KB
 ─────────────────────────────────────────
 Total compression :..............29.63%
Managed Profile-Guided Optimization (MPGO)
Managed profile guided optimization (MPGO) is a tool introduced in Visual Studio 11 and CLR 4.5 that optimizes the on-disk layout of native images produced by NGen. MPGO generates profile information from a specified period of the application’s execution and embeds it in the assembly. Subsequently, NGen uses this information to optimize the layout of the generated native image.
MPGO optimizes native image’s layout in two primary ways. First, MPGO makes sure that code and data which are used frequently (hot data) are placed together on disk. As a result, there will be fewer page faults and disk reads for hot data, because more hot data fits on a single page. Second, MPGO places potentially writable data together on disk. When a data page that is shared with other processes is modified, Windows creates a private copy of the page for the modifying process to use (this is known as copy-on-write). As a result of MPGO’s optimization, fewer shared pages are modified, resulting in less copies and lower memory utilization.
To run MPGO on your application, you need to provide the list of assemblies to instrument, an output directory in which to place the optimized binaries, and a timeout after which profiling should stop. MPGO instruments the application, runs it, analyzes the results, and creates optimized native images for the assemblies you specified:
> mpgo.exe -scenario Ch10.exe -assemblylist Ch10.exe HelperLibrary.dll -OutDir . –NoClean

Successfully instrumented assembly D:CodeCh10.exe
Successfully instrumented assembly D:CodeHelperLibrary.dll

 < output from the application removed >

Successfully removed instrumented assembly D:CodeCh10.exe
Successfully removed instrumented assembly D:CodeHelperLibrary.dll
Reading IBC data file: D:CodeCh10.ibc
The module D:CodeCh10-1.exe, did not contain an IBC resource
Writing profile data in module D:CodeCh10-1.exe
Data from one or more input files has been upgraded to a newer version.
Successfully merged profile data into new file D:CodeCh10-1.exe
Reading IBC data file: D:CodeHelperLibrary.ibc
The module D:CodeHelperLibrary-1.dll, did not contain an IBC resource
Writing profile data in module D:CodeHelperLibrary-1.dll
Data from one or more input files has been upgraded to a newer version.
Successfully merged profile data into new file D:CodeHelperLibrary-1.dll
![]() Note When the optimization completes, you need to run NGen again on the optimized assemblies to create final native images that benefit from MPGO. Running NGen on assemblies is covered earlier in this chapter.
Note When the optimization completes, you need to run NGen again on the optimized assemblies to create final native images that benefit from MPGO. Running NGen on assemblies is covered earlier in this chapter.
At the time of writing, there were no plans to introduce MPGO into the Visual Studio 2012 user interface. The command line tool is the only way to add these performance gains to your application. Because it relies on NGen, this is another optimization that is best performed after installation time on the target machine.
Miscellaneous Tips for Startup Performance
There are several additional tips we didn’t mention earlier that might be able to shave a few more seconds off your application’s startup time.
Strong Named Assemblies Belong in the GAC
If your assemblies have strong names, make sure to place them in the global assembly cache (GAC). Otherwise, loading the assembly requires touching almost every page to verify its digital signature. Verification of strong names when the assembly is not placed in the GAC will also diminish any performance gains from NGen.
Make Sure Your Native Images Do Not Require Rebasing
When using NGen, make sure that your native images do not have base address collisions, which require rebasing. Rebasing is an expensive operation that involves modifying code addresses at runtime, and creates copies of otherwise shared code pages. To view the native image’s base address, use the dumpbin.exe utility with the /headers flag, as follows:
> dumpbin.exe /headers Ch10.ni.exe
Microsoft (R) COFF/PE Dumper Version 11.00.50214.1
Copyright (C) Microsoft Corporation. All rights reserved.

Dump of file Ch10.ni.exe

PE signature found

File Type: DLL

FILE HEADER VALUES
           14C machine (x86)
           4 number of sections
       4F842B2C time date stamp Tue Apr 10 15:44:28 2012
           0 file pointer to symbol table
           0 number of symbols
           E0 size of optional header
           2102 characteristics
           Executable
           32 bit word machine
           DLL

OPTIONAL HEADER VALUES
           10B magic # (PE32)
           11.00 linker version
           0 size of code
           0 size of initialized data
           0 size of uninitialized data
           0 entry point
           0 base of code
           0 base of data
       30000000 image base (30000000 to 30005FFF)
           1000 section alignment
           200 file alignment
           5.00 operating system version
           0.00 image version
           5.00 subsystem version
           0 Win32 version
           6000 size of image
 < more output omitted for brevity>
To change the native image’s base address, change the base address in the project properties in Visual Studio. The base address can be located on the Build tab, after opening the Advanced dialog (see Figure 10-1).
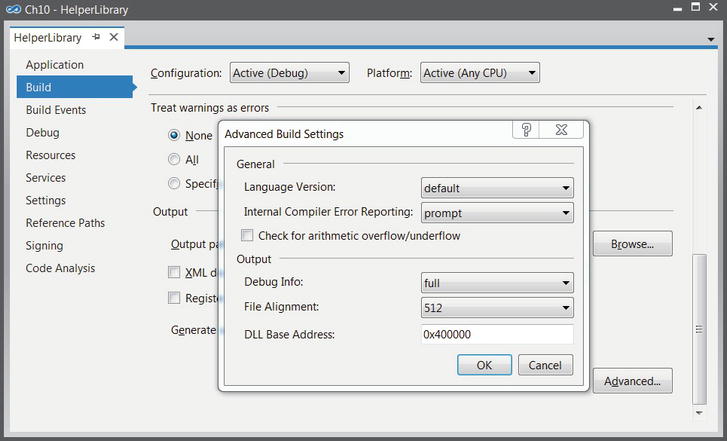
Figure 10-1 . Visual Studio Advanced Build Settings dialog, which allows modifying the base address for the native image that NGen generates
As of .NET 3.5 SP1, NGen opts-in to use Address Space Layout Randomization (ASLR) when the application is running on Windows Vista or a newer platform. When using ASLR, base load addresses for images are randomized across runs for security reasons. Under this configuration, rebasing assemblies to avoid base address collisions is not important on Windows Vista and newer platforms.
Reduce the Total Number of Assemblies
Reduce the number of assemblies loaded by your application. Each assembly load incurs a constant cost, regardless of its size, and inter-assembly references and method calls may be more costly at runtime. Large applications that load hundreds of assemblies are not uncommon, and their startup times can be reduced by several seconds if assemblies are merged to only a few binaries.
Processor-Specific Optimization
Theoretically, .NET developers should never be concerned with optimizations tailored to a specific processor or instruction set. After all, the purpose of IL and JIT compilation is to allow managed applications to run on any hardware that has the .NET Framework installed, and to remain indifferent to operating system bitness, processor features, and instruction sets. However, squeezing the last bits of performance from managed applications may require reasoning at the assembly language level, as we have seen throughout this book. At other times, understanding processor-specific features is a first step for even more significant performance gains.
In this short section we will review some examples of optimization tailored to specific processor features, optimization that might work well on one machine and break on another. We focus mostly on Intel processors, especially the Nehalem, Sandy Bridge and Ivy Bridge families, but most of the guidance will also be relevant to AMD processors. Because these optimizations are perilous and sometimes unrepeatable, you should not use these examples as definitive guidance, but only as motivation for reaping more performance from your applications.
Single Instruction Multiple Data (SIMD)
Data-level parallelism, also known as Single Instruction Multiple Data (SIMD), is a feature of modern processors that enables the execution of a single instruction on a large set of data (larger than the machine word). The de-facto standard for SIMD instruction sets is SSE (Streaming SIMD Extensions), used by Intel processors since Pentium III. This instruction set adds new 128-bit registers (with the XMM prefix) as well as instructions that can operate on them. Recent Intel processors introduced Advanced Vector Extensions (AVX), which is an extension of SSE that offers 256-bit registers and even more SIMD instructions. Some examples of SSE instructions include:
- Integer and floating-point arithmetic
- Comparisons, shuffling, data type conversion (integer to floating-point)
- Bitwise operations
- Minimum, maximum, conditional copies, CRC32, population count (introduced in SSE4 and later)
You might be wondering whether instructions operating on these “new” registers are slower than their standard counterparts. If that were the case, any performance gains would be deceiving. Fortunately, that is not the case. On Intel i7 processors, a floating-point addition (FADD) instruction on 32-bit registers has throughput of one instruction per cycle and latency of 3 cycles. The equivalent ADDPS instruction on 128-bit registers also has throughput of one instruction per cycle and latency of 3 cycles.
LATE NCY AND THROUGHPUT
Latency and throughput are common terms in general performance measurements, but especially so when discussing the “speed” of processor instructions:
- An instruction’s latency is the time (usually measured in clock cycles) it takes to execute one instance of the instruction from start to finish.
- An instruction’s throughput is the number of instructions of the same type that can be executed in a unit of time (usually measured in clock cycles).
If we say that FADD has latency of 3 cycles, it means that a single FADD operation will take 3 cycles to complete. If we say that FADD has throughput of one instruction per cycle, it means that by issuing multiple instances of FADD concurrently the processor is able to sustain an execution rate of one instruction per cycle, which will like require three of these instructions to execute concurrently.
Very often, an instruction’s throughput is significantly better than its latency because processors can issue and execute multiple instructions in parallel (we will return to this subject later).
Using these instructions in high-performance loops can provide up to 8× performance gains compared to naïve sequential programs that operate on a single floating-point or integer value at a time. For example, consider the following (admittedly trivial) code:
//Assume that A, B, C are equal-size float arrays
for (int i = 0; i < A.length; ++i) {
  C[i] = A[i] + B[i];
}
The standard code emitted by the JIT in this scenario is the following:
; ESI has A, EDI has B, ECX has C, EDX is the iteration variable
xor edx,edx
cmp dword ptr [esi + 4],0
jle END_LOOP
NEXT_ITERATION:
fld dword ptr [esi + edx*4 + 8]             ; load A[i], no range check
cmp edx,dword ptr [edi + 4]             ; range check before accessing B[i]
jae OUT_OF_RANGE
fadd dword ptr [edi + edx*4 + 8]             ; add B[i]
cmp edx,dword ptr [ecx + 4]             ; range check before accessing C[i]
jae OUT_OF_RANGE
fstp dword ptr [ecx + edx*4 + 8]             ; store into C[i]
inc edx
cmp dword ptr [esi + 4],edx             ; are we done yet?
jg NEXT_ITERATION
END_LOOP:
Each loop iteration performs a single FADD instruction that adds two 32-bit floating-point numbers. However, by using 128-bit SSE instructions, four iterations of the loop can be issued at a time, as follows (the code below performs no range checks and assumes that the number of iterations is equally divisible by 4):
xor edx, edx
NEXT_ITERATION:
movups xmm1, xmmword ptr [edi + edx*4 + 8]             ; copy 16 bytes from B to xmm1
movups xmm0, xmmword ptr [esi + edx*4 + 8]             ; copy 16 bytes from A to xmm0
addps xmm1, xmm0             ; add xmm0 to xmm1 and store the result in xmm1
movups xmmword ptr [ecx + edx*4 + 8], xmm1             ; copy 16 bytes from xmm1 to C
add edx, 4             ; increase loop index by 4
cmp edx, dword ptr [esi + 4]
jg NEXT_ITERATION
On an AVX processor, we could move even more data around in each iteration (with the 256-bit YMM* registers), for an even bigger performance improvement:
xor edx, edx
NEXT_ITERATION:
vmovups ymm1, ymmword ptr [edi + edx*4 + 8]             ; copy 32 bytes from B to ymm1
vmovups ymm0, ymmword ptr [esi + edx*4 + 8]             ; copy 32 bytes from A to ymm0
vaddps ymm1, ymm1, ymm0                                 ; add ymm0 to ymm1 and store the result in ymm1
vmovups ymmword ptr [ecx + edx*4 + 8], ymm1             ; copy 32 bytes from ymm1 to C
add edx, 8             ; increase loop index by 8
cmp edx, dword ptr [esi + 4]
jg NEXT_ITERATION
![]() Note The SIMD instructions used in these examples are only the tip of the iceberg. Modern applications and games use SIMD instructions to perform complex operations, including scalar product, shuffling data around in registers and memory, checksum calculation, and many others. Intel’s AVX portal is a good way to learn thoroughly what AVX can offer: http://software.intel.com/en-us/avx/
Note The SIMD instructions used in these examples are only the tip of the iceberg. Modern applications and games use SIMD instructions to perform complex operations, including scalar product, shuffling data around in registers and memory, checksum calculation, and many others. Intel’s AVX portal is a good way to learn thoroughly what AVX can offer: http://software.intel.com/en-us/avx/
The JIT compiler uses only a small number of SSE instructions, even though they are available on practically every processor manufactured in the last 10 years. Specifically, the JIT compiler uses the SSE MOVQ instruction to copy medium-sized structures through the XMM* registers (for large structures, REP MOVS is used instead), and uses SSE2 instructions for floating point to integer conversion and other corner cases. The JIT compiler does not auto-vectorize loops by unifying iterations, as we did manually in the preceding code listings, whereas modern C++ compilers (including Visual Studio 2012) do.
Unfortunately, C# doesn’t offer any keywords for embedding inline assembly code into your managed programs. Although you could factor out performance-sensitive parts to a C++ module and use .NET interoperability to access it, this is often clumsy. There are two other approaches for embedding SIMD code without resorting to a separate module.
A brute-force way to run arbitrary machine code from a managed application (albeit with a light interoperability layer) is to dynamically emit the machine code and then call it. The Marshal.GetDelegateForFunctionPointer method is key, as it returns a managed delegate pointing to an unmanaged memory location, which may contain arbitrary code. The following code allocates virtual memory with the EXECUTE_READWRITE page protection, which enables us to copy code bytes into memory and then execute them. The result, on an Intel i7-860 CPU, is a more than 2× improvement in execution time!
[UnmanagedFunctionPointer(CallingConvention.StdCall)]
delegate void VectorAddDelegate(float[] C, float[] B, float[] A, int length);

[DllImport("kernel32.dll", SetLastError = true)]
static extern IntPtr VirtualAlloc(
  IntPtr lpAddress, UIntPtr dwSize, IntPtr flAllocationType, IntPtr flProtect);

//This array of bytes has been produced from the SSE assembly version – it is a complete
//function that accepts four parameters (three vectors and length) and adds the vectors
byte[] sseAssemblyBytes = { 0x8b, 0x5c, 0x24, 0x10, 0x8b, 0x74, 0x24, 0x0c, 0x8b, 0x7c, 0x24,
    0x08, 0x8b, 0x4c, 0x24, 0x04, 0x31, 0xd2, 0x0f, 0x10, 0x0c, 0x97,
    0x0f, 0x10, 0x04, 0x96, 0x0f, 0x58, 0xc8, 0x0f, 0x11, 0x0c, 0x91,
    0x83, 0xc2, 0x04, 0x39, 0xda, 0x7f, 0xea, 0xc2, 0x10, 0x00 };
IntPtr codeBuffer = VirtualAlloc(
    IntPtr.Zero,
    new UIntPtr((uint)sseAssemblyBytes.Length),
    0x1000 | 0x2000, //MEM_COMMIT | MEM_RESERVE
    0x40 //EXECUTE_READWRITE
);
Marshal.Copy(sseAssemblyBytes, 0, codeBuffer, sseAssemblyBytes.Length);
VectorAddDelegate addVectors = (VectorAddDelegate)
  Marshal.GetDelegateForFunctionPointer(codeBuffer, typeof(VectorAddDelegate));
//We can now use 'addVectors' to add vectors!
A completely different approach, which unfortunately isn’t available on the Microsoft CLR, is extending the JIT compiler to emit SIMD instructions. This is the approach taken by Mono.Simd. Managed code developers who use the Mono .NET runtime can reference the Mono.Simd assembly and use JIT compiler support that converts operations on types such as Vector16b or Vector4f to the appropriate SSE instructions. For more information about Mono.Simd, see the official documentation at http://docs.go-mono.com/index.aspx?link=N:Mono.Simd.
Unlike data-level parallelism, which relies on specific instructions to operate on larger chunks of data at a time, instruction-level parallelism (ILP) is a mechanism that executes several instructions simultaneously on the same processor. Modern processors have a deep pipeline with several types of execution units, such as a unit for accessing memory, a unit for performing arithmetic operations, and a unit for decoding CPU instructions. Pipelines enable the execution of multiple instructions to overlap as long as they are not competing for the same parts of the pipeline and as long as there are no data dependencies between them. Data dependencies arise when an instruction requires the result of another instruction that executes before it; for example, when an instruction reads from a memory location to which the previous instruction has written.
![]() Note Instruction-level parallelism is not related to parallel programming, which we discussed in Chapter 6. When using parallel programming APIs the application runs multiple threads on multiple processors. Instruction-level parallelism enables a single thread, on a single processor, to execute multiple instructions at once. Unlike parallel programming, ILP is more difficult to control and depends heavily on program optimization.
Note Instruction-level parallelism is not related to parallel programming, which we discussed in Chapter 6. When using parallel programming APIs the application runs multiple threads on multiple processors. Instruction-level parallelism enables a single thread, on a single processor, to execute multiple instructions at once. Unlike parallel programming, ILP is more difficult to control and depends heavily on program optimization.
In addition to pipelining, processors employ so-called superscalar execution, which uses multiple redundant units on the same processor to perform multiple operations of the same type at once. Furthermore, to minimize the impact of data dependencies on parallel instruction execution, processors will execute instructions out of their original order as long as it does not violate any data dependencies. By adding speculative execution (primarily by attempting to guess which side of a branch is going to be taken, but by other means as well), the processor is very likely to be able to execute additional instructions even if the next instruction in the original program order cannot be executed because of a data dependency.
Optimizing compilers are renowned for organizing the instruction sequence to maximize instruction level parallelism. The JIT compiler does not do a particularly good job, but the out-of-order execution capabilities of modern processors may offset it. However, poorly-specified programs can affect performance considerably by introducing unnecessary data dependencies—especially into loops—thus limiting instruction-level parallelism.
Consider the following three loops:
for (int k = 1; k < 100; ++k) {
    first[k] = a * second[k] + third[k];
}
for (int k = 1; k < 100; ++k) {
    first[k] = a * second[k] + first[k - 1];
}
for (int k = 1; k < 100; ++k) {
    first[k] = a * first[k - 1] + third[k];
}
We executed these loops on one of our test machines with arrays of 100 integers, for a million iterations every time. The first loop ran for ∼ 190ms, the second for ∼ 210ms, and the third for ∼ 270ms. This is a substantial performance difference that stems from instruction-level parallelism. The first loop’s iterations don’t have any data dependencies—multiple iterations can be issued on the processor in any order and execute concurrently in the processor’s pipeline. The second loop’s iterations introduce a data dependency—to assign first[k], the code depends on first[k-1]. However, at least the multiplication (which must complete before the addition takes place) can be issued without data dependencies. In the third loop, the situation is as bad as it gets: even the multiplication can’t be issued without waiting for the data dependency from the previous iteration.
Another example is finding the maximum value in an array of integers. In a trivial implementation, each iteration depends on the currently established maximum from the previous iteration. Curiously, we can apply here the same idea encountered in Chapter 6—aggregation and then summation over local results. Specifically, finding the maximum of the entire array is equivalent to finding the maxima over the even and odd elements, and then performing one additional operation to find the global maximum. Both approaches are shown below:
//Naïve algorithm that carries a dependency from each loop iteration to the next
int max = arr[0];
for (int k = 1; k < 100; ++k) {
  max = Math.Max(max, arr[k]);
}

//ILP-optimized algorithm, which breaks down some of the dependencies such that within the
//loop iteration, the two lines can proceed concurrently inside the processor
int max0 = arr[0];
int max1 = arr[1];
for (int k = 3; k < 100; k + = 2) {
  max0 = Math.Max(max0, arr[k-1]);
  max1 = Math.Max(max1, arr[k]);
}
int max = Math.Max(max0, max1);
Unfortunately, the CLR JIT compiler undermines this particular optimization by emitting less-than-optimal machine code for the second loop. In the first loop, the important values fit in registers—max and k are stored in registers. In the second loop, the JIT compiler isn’t able to fit all the values in registers; if max1 or max0 are placed in memory instead, the loop’s performance degrades considerably. The corresponding C++ implementation provides the expected performance gains—the first unrolling operation improves execution time by a factor of two, and unrolling again (using four local maxima) shaves off another 25%.
Instruction-level parallelism can be combined with data-level parallelism. Both examples considered here (the multiply-and-add loop and the maximum calculation) can benefit from using SIMD instructions for additional speedups. In the case of maxima, the PMAXSD SSE4 instruction operates on two sets of four packed 32-bit integers and finds the respective maxima of each pair of integers in the two sets. The following code (using the Visual C++ intrinsics from <smmintrin.h>) runs 3× faster than the previously best version and 7× faster than the naïve original:
__m128i max0 = *(__m128i*)arr;
for (int k = 4; k < 100; k + = 4) {
  max0 = _mm_max_epi32(max0, *(__m128i*)(arr + k)); //Emits PMAXSD
}
int part0 = _mm_extract_epi32(max0, 0);
int part1 = _mm_extract_epi32(max0, 1);
int part2 = _mm_extract_epi32(max0, 2);
int part3 = _mm_extract_epi32(max0, 3);
int finalmax = max(part0, max(part1, max(part2, part3)));
When you minimize data dependencies to gain from instruction-level parallelism, the data-level parallelization (sometimes called vectorization) often turns up instantaneously for even bigger performance wins.
MANAGED VS. UNMANAGED CODE
A common concern voiced by .NET opponents is that the managed aspects of the CLR introduce a performance cost and render unviable the development of high-performance algorithms using C#, the .NET Framework, and the CLR. Throughout this book, and even in this chapter, we’ve seen several performance pitfalls that you must be aware of if you want to squeeze every bit of performance from your managed applications. Unfortunately, there will always be cases where unmanaged code (written in C++, C, or even hand-crafted assembly) will have better performance than its managed counterpart.
We do not intend to analyze and categorize every example off the Web where a C++ algorithm was demonstrated to be somewhat more efficient than its C# version. Still, there are some common themes that arise more often than others:
- Strictly CPU-bound numeric algorithms tend to run faster in C++, even after applying specific optimizations in C#. The reasons tend to fluctuate between array bounds checks (which the JIT compiler optimizes away only in some cases, and only for single-dimensional arrays), SIMD instructions employed by C++ compilers, and other optimizations at which C++ compilers excel such as sophisticated inlining and smart register allocation.
- Certain memory management patterns are detrimental to the GC’s performance (as we have seen in Chapter 4). At times, C++ code can get memory management “right” by using pooling or reusing unmanaged memory obtained from other sources, where .NET code would struggle.
- C++ code enjoys more direct access to Win32 APIs, and does not require interoperability support, such as parameter marshaling and thread state transitions (discussed in Chapter 8). High-performance applications that exhibit a chatty interface with the operating system may run slower in .NET due to this interoperability layer.
David Piepgrass’s excellent CodeProject article, “Head-to-head benchmark: C++ vs. NET” (available at http://www.codeproject.com/Articles/212856/Head-to-head-benchmark-Csharp-vs-NET), busts some of the misconceptions around managed code performance. For example, Piepgrass demonstrates that .NET collections are much faster in some cases than their C++ STL equivalents; the same applies to reading file data line-by-line using ifstream vs. StreamReader. On the other hand, some of his benchmarks emphasize the deficiencies that still exist in the 64-bit JIT compiler, and the lack of SIMD intrinsics on the CLR (which we discussed earlier) is another contributing factor to C++’s advantage.
Exceptions
Exceptions are not an expensive mechanism if used correctly and sparingly. There are simple guidelines that you can follow to steer clear of the risks involved with throwing too many exceptions and incurring a significant performance cost:
- Use exceptions for exceptional conditions: if you expect an exception to happen frequently, consider programming defensively instead of throwing an exception. There are exceptions to this rule (pun intended), but in high-performance scenarios, a condition that occurs 10% of the time should not be handled by throwing an exception.
- Check for exceptional conditions before invoking a method that can throw an exception. Examples of this approach are the Stream.CanRead property and the TryParse family of static methods on value types (e.g. int.TryParse).
- Do not throw exceptions as a control flow mechanism: don’t throw an exception to exit a loop, to stop reading from a file, or to return information from a method.
The biggest performance costs associated with throwing and handling exceptions can be categorized into several buckets:
- Constructing an exception requires a stack walk (to fill in the stack trace), which gets more expensive the deeper the stack is.
- Throwing and handling an exception requires interacting with unmanaged code—the Windows Structured Exception Handling (SEH) infrastructure—and running through a chain of SEH handlers on the stack.
- Exceptions divert control flow and data flow from hot regions, causing page faults and cache misses as cold data and code are accessed.
To understand whether exceptions are causing a performance problem, you can use the .NET CLR Exceptions performance counter category (for more on performance counters, see Chapter 2). Specifically, the # of Exceps Thrown / sec counter can help pinpoint potential performance problems if thousands of exceptions are thrown per second.
Reflection
Reflection has a bad reputation for being a performance hog in many complex applications. Some of this reputation is justified: there are extremely expensive operations that you can perform using Reflection, such as invoking a function by its name using Type.InvokeMember or creating an object instance using a late-bound parameter list using Activator.CreateInstance. The main costs when invoking methods or setting field values through Reflection stem from the work that has to happen in the background—instead of strongly-typed code that can be compiled by the JIT to machine instructions, code that uses Reflection is effectively interpreted at runtime through a series of costly method calls.
For example, invoking a method using Type.InvokeMember requires determining which method to invoke using metadata and overload resolution, making sure the specified arguments match the method’s parameters, performing type coercions if necessary, verifying any security concerns, and finally executing the method call. Because Reflection is heavily based on object parameters and return values, boxing and unboxing may add an additional extra cost.
![]() Note For more performance tips surrounding .NET Reflection APIs from an internal perspective, consider Joel Pobar’s MSDN Magazine article, “Dodge Common Performance Pitfalls to Craft Speedy Applications”, available online at http://msdn.microsoft.com/en-us/magazine/cc163759.aspx.
Note For more performance tips surrounding .NET Reflection APIs from an internal perspective, consider Joel Pobar’s MSDN Magazine article, “Dodge Common Performance Pitfalls to Craft Speedy Applications”, available online at http://msdn.microsoft.com/en-us/magazine/cc163759.aspx.
Often enough, Reflection can be eliminated from performance-critical scenarios by using some form of code generation—instead of reflecting over unknown types and invoking methods/properties dynamically, you can generate code (for each type) that will do so in a strongly-typed fashion.
Code Generation
Code generation is often used by serialization frameworks, Object/Relational Mappers (ORMs), dynamic proxies, and other performance-sensitive code that needs to work with dynamic, unknown types. There are several ways to dynamically generate code in the .NET Framework, and there are many third-party code generation frameworks, such as LLBLGen and T4 templates.
- Lightweight Code Generation (LCG), a.k.a. DynamicMethod. This API can be used to generate a method without creating a type and assembly to contain it. For small chunks of code, this is the most efficient code generation mechanism. Emitting code in an LCG method requires the ILGenerator class, which works directly with IL instructions.
- The System.Reflection.Emit namespace contains APIs that can be used to generate assemblies, types, and methods—on the IL level.
- Expression trees (in the System.Linq.Expression namespace) can be used to create lightweight expressions from a serialized representation.
- The CSharpCodeProvider class can be used to directly compile C# source code (provided as a string or read from a file) to an assembly.
Suppose that you are implementing a serialization framework that writes out an XML representation of arbitrary objects. Using Reflection to obtain non-null public field values and write them out recursively is fairly expensive, but makes for a simple implementation:
//Rudimentary XML serializer – does not support collections, cyclic references, etc.
public static string XmlSerialize(object obj) {
  StringBuilder builder = new StringBuilder();
  Type type = obj.GetType();
  builder.AppendFormat(" < {0} Type = '{1}'" > ", type.Name, type.AssemblyQualifiedName);
  if (type.IsPrimitive || type == typeof(string)) {
    builder.Append(obj.ToString());
  } else {
    foreach (FieldInfo field in type.GetFields()) {
    object value = field.GetValue(obj);
    if (value ! = null) {
    builder.AppendFormat(" < {0} > {1}</{0} > ", field.Name, XmlSerialize(value));
    }
    }
  }
  builder.AppendFormat("</{0} > ", type.Name);
  return builder.ToString();
}
Instead, we could generate strongly-typed code to serialize a specific type and invoke that code. Using CSharpCodeProvider, the gist of the implementation looks as follows:
public static string XmlSerialize<T>(T obj){
  Func<T,string> serializer = XmlSerializationCache<T>.Serializer;
  if (serializer == null){
    serializer = XmlSerializationCache<T>.GenerateSerializer();
  }
  return serializer(obj);
}

private static class XmlSerializationCache < T > {
  public static Func < T,string > Serializer;
  public static Func < T,string > GenerateSerializer() {
    StringBuilder code = new StringBuilder();
    code.AppendLine("using System;");
    code.AppendLine("using System.Text;");
    code.AppendLine("public static class SerializationHelper {");
    code.AppendFormat("public static string XmlSerialize({0} obj) {{", typeof(T).FullName);
    code.AppendLine("StringBuilder result = new StringBuilder();");
    code.AppendFormat("result.Append(" < {0} Type = '{1}'" > ");", typeof(T).Name, typeof(T).AssemblyQualifiedName);
    if (typeof(T).IsPrimitive || typeof(T) == typeof(string)) {
    code.AppendLine("result.AppendLine(obj.ToString());");
    } else {
    foreach (FieldInfo field in typeof(T).GetFields()) {
       code.AppendFormat("result.Append(" < {0} > ");", field.Name);
       code.AppendFormat("result.Append(XmlSerialize(obj.{0}));", field.Name);
       code.AppendFormat("result.Append("</{0} > ");", field.Name);
       }
    }
    code.AppendFormat("result.Append("</{0} > ");", typeof(T).Name);
    code.AppendLine("return result.ToString();");
    code.AppendLine("}");
    code.AppendLine("}");

    CSharpCodeProvider compiler = new CSharpCodeProvider();
    CompilerParameters parameters = new CompilerParameters();
    parameters.ReferencedAssemblies.Add(typeof(T).Assembly.Location);
    parameters.CompilerOptions = "/optimize + ";
    CompilerResults results = compiler.CompileAssemblyFromSource(parameters, code.ToString());
    Type serializationHelper = results.CompiledAssembly.GetType("SerializationHelper");
    MethodInfo method = serializationHelper.GetMethod("XmlSerialize");
    Serializer = (Func <T,string>)Delegate.CreateDelegate(typeof(Func <T,string>), method);
    return Serializer;
  }
}
The Reflection-based part has moved such that it is only used once to generate strongly-typed code—the result is cached in a static field and reused every time a certain type must be serialized. Note that the serializer code above has not been extensively tested; it is merely a proof of concept that demonstrates the idea of code generation. Simple measurements indicate that the code-generation-based approach is more than twice as fast as the original, Reflection-only code.
Generating Code Using Dynamic Lightweight Code Generation
Another example stems from the network protocol parsing domain. Suppose that you have a large stream of binary data, such as network packets, and you have to parse it to retrieve from it packet headers and select parts of the payload. For example, consider the following packet header structure (this is a completely fictional example—TCP packet headers are not arranged that way):
public struct TcpHeader {
  public uint SourceIP;
  public uint DestIP;
  public ushort SourcePort;
  public ushort DestPort;
  public uint Flags;
  public uint Checksum;
}
Retrieving such a structure from a stream of bytes is a trivial task in C/C++, and doesn’t even require copying any memory if accessed by pointer. In fact, retrieving any structure from a stream of bytes would be trivial:
template < typename T>
const T* get_pointer(const unsigned char* data, int offset) {
  return (T*)(data + offset);
}
template < typename T>
const T get_value(const unsigned char* data, int offset) {
  return *get_pointer(data, offset);
}
In C# things are more complicated, unfortunately. There are numerous ways of reading arbitrary data from a stream. One possibility would be to use Reflection to go over the type’s fields and read them from the stream of bytes individually:
//Supports only some primitive fields, does not recurse
public static void ReadReflectionBitConverter < T > (byte[] data, int offset, out T value) {
  object box = default(T);
  int current = offset;
  foreach (FieldInfo field in typeof(T).GetFields()) {
    if (field.FieldType == typeof(int)) {
       field.SetValue(box, BitConverter.ToInt32(data, current));
       current + = 4;
    } else if (field.FieldType == typeof(uint)) {
       field.SetValue(box, BitConverter.ToUInt32(data, current));
       current + = 4;
    } else if (field.FieldType == typeof(short)) {
       field.SetValue(box, BitConverter.ToInt16(data, current));
       current + = 2;
    } else if (field.FieldType == typeof(ushort)) {
       field.SetValue(box, BitConverter.ToUInt16(data, current));
       current + = 2;
    }
    //. . .many more types omitted for brevity
    value = (T)box;
}
When executed 1,000,000 times over a 20-byte TcpHeader structure on one of our test machines, this method took an average of 170ms to execute. Although the running time might seem not too bad, the amount of memory allocated by all the boxing operations is considerable. Additionally, if you consider a realistic network rate of 1Gb/s, it’s reasonable to expect tens of millions of packets per second, which means we would have to spend most of our CPU time reading structures from the incoming data.
A considerably better approach involves the Marshal.PtrToStructure method, which is designed to convert an unmanaged chunk of memory to a managed structure. Using it requires pinning the original data to retrieve a pointer to its memory:
public static void ReadMarshalPtrToStructure < T > (byte[] data, int offset, out T value) {
  GCHandle gch = GCHandle.Alloc(data, GCHandleType.Pinned);
  try {
    IntPtr ptr = gch.AddrOfPinnedObject();
    ptr + = offset;
    value = (T)Marshal.PtrToStructure(ptr, typeof(T));
  } finally {
    gch.Free();
  }
}
This version fares considerably better, at an average of 39ms for 1,000,000 packets. This is a significant performance improvement, but Marshal.PtrToStructure still forces a heap memory allocation because it returns an object reference, and this is still not fast enough for tens of millions of packets per second.
In Chapter 8 we discussed C# pointers and unsafe code, and it seems to be a great opportunity to use them. After all, the C++ version is so easy precisely because it uses pointers. Indeed, the following code is much faster at 0.45ms for 1,000,000 packets—an incredible improvement!
public static unsafe void ReadPointer(byte[] data, int offset, out TcpHeader header) {
  fixed (byte* pData = &data[offset]) {
    header = *(TcpHeader*)pData;
  }
}
Why is this method so fast? Because the entity responsible for copying data around is no longer an API call like Marshal.PtrToStructure—it’s the JIT compiler itself. The assembly code generated for this method can be inlined (indeed, the 64-bit JIT compiler chooses to do so) and can use 3-4 instructions to copy memory around (e.g., using the MOVQ instruction on 32-bit systems to copy 64 bits at a time). The only problem is that the ReadPointer method we devised is not generic, unlike its C++ counterpart. The knee-jerk reaction is to implement a generic version of it—
public static unsafe void ReadPointerGeneric < T > (byte[] data, int offset, out T value) {
  fixed (byte* pData = &data[offset]) {
    value = *(T*)pData;
  }
}
—which does not compile! Specifically, T* is not something you can write in C#, anywhere, because there is no generic constraint to guarantee that a pointer to T can be taken (and only blittable types, discussed in Chapter 8, can be pinned and pointed to). Because no generic constraint is available to express our intent, it would seem that we have to write a separate version of ReadPointer for each type, which is where code generation comes back into play.
TYPEDREFERENCE AND TWO UNDOCUMENTED C# KEYWORDS
Desperate times call for desperate measures, and in this case the desperate measures are pulling out two undocumented C# keywords, __makeref and __refvalue (supported by equally undocumented IL opcodes). Together with the TypedReference struct these keywords are used in some low-level interoperability scenarios with C-style variable length method argument lists (which require another undocumented keyword, __arglist).
TypedReference is a small struct that has two IntPtr fields—Type and Value. The Value field is a pointer to a value, which can be a value type or a reference type, and the Type field is its method table pointer. By creating a TypedReference that points to a value type’s location, we can reinterpret memory in a strongly-typed fashion, as our scenario requires, and use the JIT compiler to copy memory, as in the ReadPointer case.
//We are taking the parameter by ref and not by out because we need to take its address,
//and __makeref requires an initialized value.
public static unsafe void ReadPointerTypedRef < T > (byte[] data, int offset, ref T value) {
   //We aren't actually modifying 'value' -- just need an lvalue to start with
   TypedReference tr = __makeref(value);
   fixed (byte* ptr = &data[offset]) {
     //The first pointer-sized field of TypedReference is the object address, so we
     //overwrite it with a pointer into the right location in the data array:
     *(IntPtr*)&tr = (IntPtr)ptr;
     //__refvalue copies the pointee from the TypedReference to 'value'
     value = __refvalue(tr, T);
   }
}
This nasty compiler magic still has a cost, unfortunately. Specifically, the __makeref operator is compiled by the JIT compiler to call clr!JIT_GetRefAny, which is an extra cost compared to the fully-inlinable ReadPointer version. The result is an almost 2× slowdown—this method takes 0.83ms to execute 1,000,000 iterations. Incidentally, this is still the fastest generic approach we will see in this section.
To avoid writing a separate copy of the ReadPointer method for each type, we’ll use Lightweight Code Generation (the DynamicMethod class) to generate code. First, we inspect the IL generated for the ReadPointer method:
.method public hidebysig static void ReadPointer( uint8[] data, int32 offset, [out] valuetype TcpHeader& header) cil managed
{
  .maxstack 2
  .locals init ([0] uint8& pinned pData)
  ldarg.0
  ldarg.1
  ldelema uint8
  stloc.0
  ldarg.2
  ldloc.0
  conv.i
  ldobj TcpHeader
  stobj TcpHeader
  ldc.i4.0
  conv.u
  stloc.0
  ret
}
Now all we have to do is emit IL where TcpHeader is replaced by the generic type argument. In fact, thanks to the excellent ReflectionEmitLanguage plugin for .NET Reflector (available at http://reflectoraddins.codeplex.com/wikipage?title=ReflectionEmitLanguage), which converts methods to the Reflection.Emit API calls required to generate them, we don’t even have to write the code by hand—although it admittedly required a few minor fixes:
static class DelegateHolder < T>
{
  public static ReadDelegate < T > Value;
  public static ReadDelegate < T > CreateDelegate() {
    DynamicMethod dm = new DynamicMethod("Read", null,
    new Type[] { typeof(byte[]), typeof(int), typeof(T).MakeByRefType() },
    Assembly.GetExecutingAssembly().ManifestModule);
    dm.DefineParameter(1, ParameterAttributes.None, "data");
    dm.DefineParameter(2, ParameterAttributes.None, "offset");
    dm.DefineParameter(3, ParameterAttributes.Out, "value");
    ILGenerator generator = dm.GetILGenerator();
    generator.DeclareLocal(typeof(byte).MakePointerType(), pinned: true);
    generator.Emit(OpCodes.Ldarg_0);
    generator.Emit(OpCodes.Ldarg_1);
    generator.Emit(OpCodes.Ldelema, typeof(byte));
    generator.Emit(OpCodes.Stloc_0);
    generator.Emit(OpCodes.Ldarg_2);
    generator.Emit(OpCodes.Ldloc_0);
    generator.Emit(OpCodes.Conv_I);
    generator.Emit(OpCodes.Ldobj, typeof(T));
    generator.Emit(OpCodes.Stobj, typeof(T));
    generator.Emit(OpCodes.Ldc_I4_0);
    generator.Emit(OpCodes.Conv_U);
    generator.Emit(OpCodes.Stloc_0);
    generator.Emit(OpCodes.Ret);
    Value = (ReadDelegate < T>)dm.CreateDelegate(typeof(ReadDelegate < T>));
    return Value;
  }
}
public static void ReadPointerLCG < T > (byte[] data, int offset, out T value)
{
  ReadDelegate < T > del = DelegateHolder < T > .Value;
  if (del == null) {
    del = DelegateHolder<T>.CreateDelegate();
  }
  del(data, offset, out value);
}
This version takes 1.05ms for 1,000,000 packets, which is more than twice as long as ReadPointer, but still more than two orders of magnitude faster than the original Reflection-based approach—another win for code generation. (The performance loss compared to ReadPointer is due the need to fetch the delegate from a static field, check for null, and invoke the method through a delegate.)
Summary
However different, the optimization tips and techniques discussed in this chapter are critical for implementing high-performance CPU-bound algorithms and designing the architecture of complex systems. By making sure your code takes advantage of the built-in JIT optimizations as well as any specific instructions the processor has to offer, by reducing as much as possible the startup times of your client applications, and by steering clear of expensive CLR mechanisms such as Reflection and exceptions, you will assuredly squeeze every bit of performance from your managed software.
In the next and final chapter we will discuss the performance characteristics of Web applications, primarily in the ASP.NET domain, and introduce specific optimizations that are relevant only to Web servers.