
![]()
In this chapter, we will examine the .NET garbage collector (GC), one of the primary mechanisms affecting the performance of .NET applications. While freeing developers from worrying about memory deallocation, the GC introduces new challenges for constructing deterministically well-behaving programs in which performance is paramount. First, we will review the types of GC available in the CLR, and see how adapting an application to the GC can be very beneficial in terms of overall GC performance and pause times. Next, we’ll see how generations affect GC performance and how to tune applications accordingly. Toward the end of the chapter we will examine the APIs available for controlling the GC directly, as well as the subtleties involved in correctly using non-deterministic finalization.
Many of the examples in this chapter are based on the authors’ personal experience with real-world systems. Where possible, we tried to point you to case studies and even sample applications that you can work on while reading this chapter, illustrating the primary performance pain points. The “Best Practices” section toward the end of the chapter is full of such case studies and examples. However, you should be aware that some of these points are difficult to demonstrate with short code snippets or even a sample program because the situations where performance differences arise are typically within large projects that have thousands of types and millions of objects in memory.
Why Garbage Collection?
Garbage collection is a high-level abstraction that absolves developers of the need to care about managing memory deallocation. In a garbage-collected environment, memory allocation is tied to the creation of objects, and when these objects are no longer referenced by the application, the memory can be freed. A garbage collector also provides a finalization interface for unmanaged resources that do not reside on the managed heap, so that custom cleanup code can be executed when these resources are no longer needed. The two primary design goals of the .NET garbage collector are:
- Remove the burden of memory management bugs and pitfalls
- Provide memory management performance that matches or exceeds the performance of manual native allocators
Existing programming languages and frameworks use several different memory management strategies. We will briefly examine two of them: free list management (that can be found in the C standard allocator) and reference counting garbage collection. This will provide us with a point of reference when looking at the internals of the .NET garbage collector.
Free List Management
Free list management is the underlying memory management mechanism in the C run-time library, which is also used by default by the C++ memory management APIs such as new and delete. This is a deterministic memory manager that relies on developers allocating and freeing memory as they deem fit. Free blocks of memory are stored in a linked list, from which allocations are satisfied (see Figure 4-1). Deallocated blocks of memory are returned to the free list.
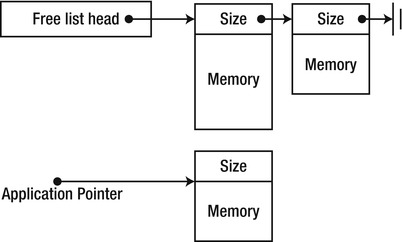
Figure 4-1 . The free list manager manages a list of unused memory blocks and satisfies allocation and deallocation requests. The application is handed out blocks of memory that usually contain the block size
Free list management is not free of strategic and tactical decisions which affect the performance of an application using the allocator. Among these decisions:
- An application using free list management starts up with a small pool of free blocks of memory organized in a free list. This list can be organized by size, by the time of usage, by the arena of allocation determined by the application, and so forth.
- When an allocation request arrives from the application, a matching block is located in the free list. The matching block can be located by selecting the first-fit, the best-fit, or using more complex alternative strategies.
- When the free list is exhausted, the memory manager asks the operating system for another set of free blocks that are added to the free list. When a deallocation request arrives from the application, the freed memory block is added to the free list. Optimizations at this phase include joining adjacent free blocks together, defragmenting and trimming the list, and so on.
The primary issues associated with a free-list memory manager are the following:
- Allocation cost: Finding an appropriate block to satisfy an allocation request is time consuming, even if a first-fit approach is used. Additionally, blocks are often broken into multiple parts to satisfy allocation requests. In the case of multiple processors, contention on the free list and synchronization of allocation requests are inevitable, unless multiple lists are used. Multiple lists, on the other hand, deteriorate the fragmentation of the list.
- Deallocation cost: Returning a free block of memory to the free list is time consuming, and again suffers from the need of multi-processor synchronization of multiple deallocation requests.
- Management cost: Defragmenting and trimming the free lists is necessary to avoid memory exhaustion scenarios, but this work has to take place in a separate thread and acquire locks on the free lists, hindering allocation and deallocation performance. Fragmentation can be minimized by using fixed-size allocation buckets to maintain multiple free-lists, but this requires even more management and adds a small cost to every allocation and deallocation request.
Reference-Counting Garbage Collection
A reference-counting garbage collector associates each object with an integer variable—its reference count. When the object is created, its reference count is initialized to 1. When the application creates a new reference to the object, its reference count is incremented by 1 (see Figure 4-2). When the application removes an existing reference to the object, its reference count is decremented by 1. When the object’s reference count reaches 0, the object can be deterministically destroyed and its memory can be reclaimed.
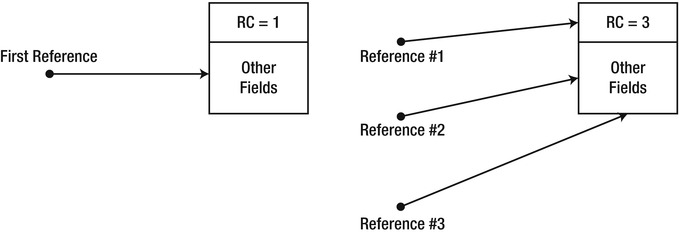
Figure 4-2 . Every object contains a reference count
One example of reference-counting garbage collection in the Windows ecosystem is COM (Component Object Model). COM objects are associated with a reference count that affects their lifetime. When a COM object’s reference count reaches 0, it is typically the object’s responsibility to reclaim its own memory. The burden of managing the reference count is mostly with the developer, through explicit AddRef and Release method calls, although most languages have automatic wrappers that call these methods automatically when references are created and destroyed.
The primary issues associated with reference-counting garbage collection are the following:
- Management cost: Whenever a reference to an object is created or destroyed, the object’s reference count must be updated. This means that trivial operations such as assignment of references (a = b) or passing a reference by value to a function incur the cost of updating the reference count. On multi-processor systems, these updates introduce contention and synchronization around the reference count, and cause cache thrashing if multiple processors update the same object’s reference count. (See Chapters 5 and 6 for more information about single- and multi-processor cache considerations.)
- Memory usage: The object’s reference count must be stored in memory and associated with the object. Depending on the number of references expected for each object, this increases the object’s size by several bytes, making reference counting not worthwhile for flyweight objects. (This is less of an issue for the CLR, where objects have an “overhead” of 8 or 16 bytes already, as we have seen in Chapter 3.)
- Correctness: Under reference counting garbage collection, disconnected cycles of objects cannot be reclaimed. If the application no longer has a reference to two objects, but each of the objects holds a reference to the other, a reference counting application will experience a memory leak (see Figure 4-3). COM documents this behavior and requires breaking cycles manually. Other platforms, such as the Python programming language, introduce an additional mechanism for detecting such cycles and eliminating them, incurring an additional non-deterministic collection cost.
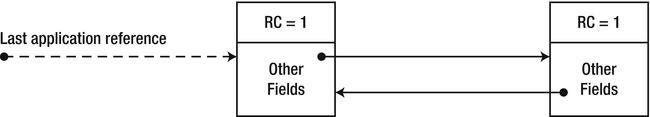
Figure 4-3 . When a cycle of objects is no longer referenced by the application, their internal reference counts remain 1 and they are not destroyed, producing a memory leak. (The dashed reference in the figure has been removed.)
Tracing garbage collection is the garbage collection mechanism used by the .NET CLR, the Java VM and various other managed environments—these environments do not use reference counting garbage collection in any form. Developers do not need to issue explicit memory deallocation requests; this is taken care of by the garbage collector. A tracing GC does not associate an object with a reference count, and normally doesn’t incur any deallocation cost until a memory usage threshold is reached.
When a garbage collection occurs, the collector begins with the mark phase, during which it resolves all objects that are still referenced by the application (live objects). After constructing the set of live objects, the collector moves to the sweep phase, at which time it reclaims the space occupied by unused objects. Finally, the collector concludes with the compact phase, in which it shifts live objects so that they remain consecutive in memory.
In this chapter, we will examine in detail the various issues associated with tracing garbage collection. A general outline of these issues, however, can be provided right now:
- Allocation cost: The allocation cost is comparable to a stack-based allocation, because there is no maintenance associated with free objects. An allocation consists of incrementing a pointer.
- Deallocation cost: Incurred whenever the GC cycle occurs instead of being uniformly distributed across the application’s execution profile. This has its advantages and disadvantages (specifically for low-latency scenarios) that we will discuss later in this chapter.
- Mark phase: Locating referenced objects requires a great deal of discipline from the managed execution environment. References to objects can be stored in static variables, local variables on thread stacks, passed as pointers to unmanaged code, etc. Tracing every possible reference path to each accessible object is everything but trivial, and often incurs a run-time cost outside the collection cycle.
- Sweep phase: Moving objects around in memory costs time, and might not be applicable for large objects. On the other hand, eliminating unused space between objects facilitates locality of reference, because objects that were allocated together are positioned together in memory. Additionally, this removes the need for an additional defragmentation mechanism because objects are always stored consecutively. Finally, this means that the allocation code does not need to account for “holes” between objects when looking for free space; a simple pointer-based allocation strategy can be used instead.
In the subsequent sections, we will examine the .NET GC memory management paradigm, starting from understanding the GC mark and sweep phases and moving to more significant optimizations such as generations.
In the mark phase of the tracing garbage collection cycle, the GC traverses the graph of all objects currently referenced by the application. To successfully traverse this graph and prevent false positives and false negatives (discussed later in this chapter), the GC needs a set of starting points from which reference traversal can ensue. These starting points are termed roots, and as their name implies, they form the roots of the directed reference graph that the GC builds.
After having established a set of roots, the garbage collector’s work in the mark phase is relatively simple to understand. It considers each internal reference field in each root, and proceeds to traverse the graph until all referenced objects have been visited. Because reference cycles are allowed in .NET applications, the GC marks visited objects so that each object is visited once and only once—hence the name of the mark phase.
One of the most obvious types of roots is local variables; a single local variable can form the root of an entire object graph referenced by an application. For example, consider the following code fragment within the application’s Main method that creates a System.Xml.XmlDocument object and proceeds to call its Load method:
static void Main(string[] args) {
    XmlDocument doc = new XmlDocument();
    doc.Load("Data.xml");
    Console.WriteLine(doc.OuterXml);
}
We do not exercise control over the garbage collector’s timing, and therefore must assume that a garbage collection might occur during the Load method call. If that happens, we would not like the XmlDocument object to be reclaimed—the local reference in the Main method is the root of the document’s object graph that must be considered by the garbage collector. Therefore, every local variable that can potentially hold a reference to an object (i.e., every local variable of a reference type) can appear to be an active root while its method is on the stack.
However, we do not need the reference to remain an active root until the end of its enclosing method. For example, after the document was loaded and displayed, we might want to introduce additional code within the same method that no longer requires the document to be kept in memory. This code might take a long time to complete, and if a garbage collection occurs in the meantime, we would like the document’s memory to be reclaimed.
Does the .NET garbage collector provide this eager collection facility? Let’s examine the following code fragment, which creates a System.Threading.Timer and initializes it with a callback that induces a garbage collection by calling GC.Collect (we will examine this API later in more detail):
using System;
using System.Threading;

class Program {
    static void Main(string[] args) {
     Timer timer = new Timer(OnTimer, null, 0, 1000);
     Console.ReadLine();
    }
    static void OnTimer(object state) {
     Console.WriteLine(DateTime.Now.TimeOfDay);
     GC.Collect();
    }
}
If you run the above code in Debug mode (if compiling from the command line, without the /optimize + compiler switch), you will see that the timer callback is called every second, as expected, implying that the timer is not garbage collected. However, if you run it in Release mode (with the /optimize + compiler switch), the timer callback is only called once! In other words, the timer is collected and stops invoking the callback. This is legal (and even desired) behavior because our local reference to the timer is no longer relevant as a root once we reach the Console.ReadLine method call. Because it’s no longer relevant, the timer is collected, producing a rather unexpected result if you didn’t follow the discussion on local roots earlier!
EAGER ROOT COLLECTION
This eager collection facility for local roots is actually provided by the .NET Just-In-Time Compiler (JIT). The garbage collector has no way of knowing on its own whether the local variable can still potentially be used by its enclosing method. This information is embedded into special tables by the JIT when it compiles the method. For each local variable, the JIT embeds into the table the addresses of the earliest and latest instruction pointers where the variable is still relevant as a root. The GC then uses these tables when it performs its stack walk. (Note that the local variables may be stored on the stack or in CPU registers; the JIT tables must indicate this.)
//Original C# code:
static void Main() {
  Widget a = new Widget();
  a.Use();
  //...additional code
  Widget b = new Widget();
  b.Use();
  //...additional code
  Foo(); //static method call
}

//Compiled x86 assembly code:
     ; prologue omitted for brevity
     call 0x0a890a30;              Widget..ctor
+0x14 mov esi, eax ;               esi now contains the object's reference
     mov ecx, esi
     mov eax, dword ptr [ecx]
     ; the rest of the function call sequence
+0x24 mov dword ptr [ebp-12], eax ; ebp-12 now contains the object's reference
     mov ecx, dword ptr [ebp-12]
     mov eax, dword ptr [ecx]
     ; the rest of the function call sequence
+0x34 call 0x0a880480 ;             Foo method call
     ; method epilogue omitted for brevity

//JIT-generated tables that the GC consults:
Register or stack     Begin offset     End offset
     ESI                  0x14           0x24
  EBP - 12                0x24           0x34
The above discussion implies that breaking your code into smaller methods and using less local variables is not just a good design measure or a software engineering technique. With the .NET garbage collector, it can provide a performance benefit as well because you have less local roots! It means less work for the JIT when compiling the method, less space to be occupied by the root IP tables, and less work for the GC when performing its stack walk.
What if we want to explicitly extend the lifetime of our timer until the end of its enclosing method? There are multiple ways of accomplishing this. We could use a static variable (which is a different type of root, to be discussed shortly). Alternatively, we could use the timer just before the method’s terminating statement (e.g., call timer.Dispose()). But the cleanest way of accomplishing this is through the use of the GC.KeepAlive method, which guarantees that the reference to the object will be considered as a root.
How does GC.KeepAlive work? It might appear to be a magical method ascending from the internals of the CLR. However, it is fairly trivial—we could write it ourselves, and we will. If we pass the object reference to any method that can’t be inlined (see Chapter 3 for a discussion of inlining), the JIT must automatically assume that the object is used. Therefore, the following method can stand in for GC.KeepAlive if we wanted to:
[MethodImpl(MethodImplOptions.NoInlining)]
static void MyKeepAlive(object obj) {
  //Intentionally left blank: the method doesn't have to do anything

}
Yet another category of roots is static variables. Static members of types are created when the type is loaded (we have seen this process in Chapter 3), and are considered to be potential roots throughout the entire lifetime of the application domain. For example, consider this short program which continuously creates objects which in turn register to a static event:
class Button {
  public void OnClick(object sender, EventArgs e) {
    //Implementation omitted
  }
}

class Program {
  static event EventHandler ButtonClick;

  static void Main(string[] args) {
    while (true) {
     Button button = new Button();
     ButtonClick += button.OnClick;
    }
  }
}
This turns out to be a memory leak, because the static event contains a list of delegates which in turn contain a reference to the objects we created. In fact, one of the most common .NET memory leaks is having a reference to your object from a static variable!
Other Roots
The two categories of roots just described are the most common ones, but additional categories exist. For example, GC handles (represented by the System.Runtime.InteropServices.GCHandle type) are also considered by the garbage collector as roots. The f-reachable queue is another example of a subtle type of root—objects waiting for finalization are still considered reachable by the GC. We will consider both root types later in this chapter; understanding the other categories of roots is important when debugging memory leaks in .NET applications, because oftentimes there are no trivial (read: static or local) roots referencing your object, but it still remains alive for some other reason.
INSPECTING ROOTS USING SOS.DLL
SOS.DLL, the debugger extension we have seen in Chapter 3, can be used to inspect the chain of roots that is responsible for keeping a particular object alive. Its !gcroot command provides succinct information of the root type and reference chain. Below are some examples of its output:
0:004> !gcroot 02512370
HandleTable:
    001513ec (pinned handle)
    -> 03513310 System.Object[]
    -> 0251237c System.EventHandler
    -> 02512370 Employee

0:004> !gcroot 0251239c
Thread 3068:
    003df31c 002900dc Program.Main(System.String[]) [d:...Ch04Program.cs @ 38]
     esi:
     -> 0251239c Employee

0:004> !gcroot 0227239c
Finalizer Queue:
    0227239c
    -> 0227239c Employee
The first type of root in this output is likely a static field—although ascertaining this would involve some work. One way or another, it is a pinning GC handle (GC handles are discussed later in this chapter). The second type of root is the ESI register in thread 3068, which stores a local variable in the Main method. The last type of root is the f-reachable queue.
Performance Implications
The mark phase of the garbage collection cycle is an “almost read-only” phase, at which no objects are shifted in memory or deallocated from it. Nonetheless, there are significant performance implications that arise from the work done at the mark phase:
- During a full mark, the garbage collector must touch every single referenced object. This results in page faults if the memory is no longer in the working set, and results in cache misses and cache thrashing as objects are traversed.
- On a multi-processor system, since the collector marks objects by setting a bit in their header, this causes cache invalidation for other processors that have the object in their cache.
- Unreferenced objects are less costly in this phase, and therefore the performance of the mark phase is linear in the collection efficiency factor: the ratio between referenced and unreferenced objects in the collection space.
- The performance of the mark phase additionally depends on the number of objects in the graph, and not the memory consumed by these objects. Large objects that do not contain many references are easier to traverse and incur less overhead. This means that the performance of the mark phase is linear in the number of live objects in the graph.
Once all referenced objects have been marked, the garbage collector has a full graph of all referenced objects and their references (see Figure 4-4). It can now move on to the sweep phase.
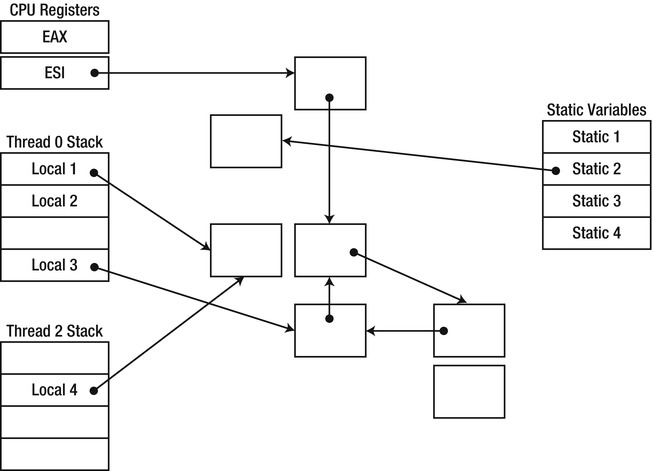
Figure 4-4 . An object graph with various types of roots. Cyclic references are permitted
In the sweep and compact phases, the garbage collector reclaims memory, often by shifting live objects around so that they are placed consecutively on the heap. To understand the mechanics of shifting objects around, we must first examine the allocation mechanism which provides the motivation for the work performed in the sweep phase.
In the simple GC model we are currently examining, an allocation request from the application is satisfied by incrementing a single pointer, which always points to the next available slot of memory (see Figure 4-5). This pointer is called the next object pointer (or new object pointer), and it is initialized when the garbage-collected heap is constructed on application startup.
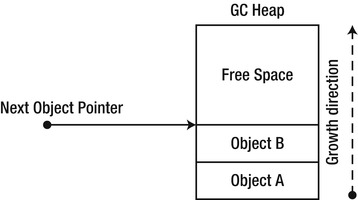
Figure 4-5 . GC heap and the next object pointer
Satisfying an allocation request is extremely cheap in this model: it involves only the atomic increment of a single pointer. Multi-processor systems are likely to experience contention for this pointer (a concern that will be addressed later in this chapter).
If memory were infinite, allocation requests could be satisfied indefinitely by incrementing the new object pointer. However, at some point in time we reach a threshold that triggers a garbage collection. The thresholds are dynamic and configurable, and we will look into ways of controlling them later in this chapter.
During the compact phase, the garbage collector moves live objects in memory so that they occupy a consecutive area in space (see Figure 4-6). This aids locality of reference, because objects allocated together are also likely to be used together, so it is preferable to keep them close together in memory. On the other hand, moving objects around has at least two performance pain-points:
- Moving objects around means copying memory, which is an expensive operation for large objects. Even if the copy is optimized, copying several megabytes of memory in each garbage collection cycle results in unreasonable overhead. (This is why large objects are treated differently, as we shall see later.)
- When objects are moved, references to them must be updated to reflect their new location. For objects that are frequently referenced, this scattered memory access (when references are being updated) can be costly.
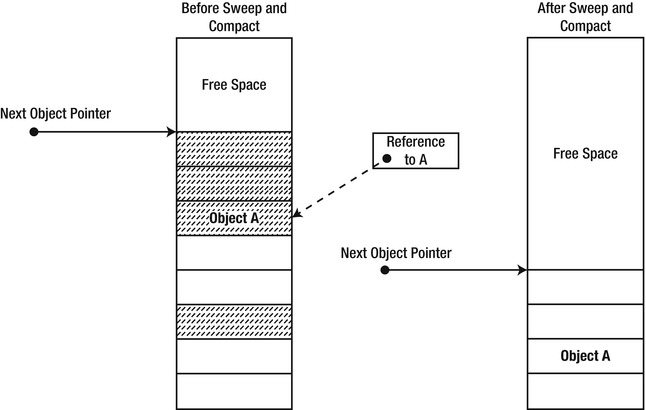
Figure 4-6 . The shaded objects on the left survive garbage collection and are shifted around in memory. This means that the reference to A (dashed line) has to be updated. (The updated reference is not shown in the diagram.)
The general performance of the sweep phase is linear in the number of objects in the graph, and is especially sensitive to the collection efficiency factor. If most objects are discovered to be unreferenced, then the GC has to move only a few objects in memory. The same applies to the scenario where most objects are still referenced, as there are relatively few holes to fill. On the other hand, if every other object in the heap is unreferenced, the GC may have to move almost every live object to fill the holes.
![]() Note Contrary to popular belief, the garbage collector does not always move objects around (i.e., there are some sweep-only collections that do not proceed into the compact phase), even if they are not pinned (see below) and even if free space is available between objects. There is an implementation-defined heuristic which determines whether moving objects to fill free space is worthwhile during the sweep phase. For example, in one test suite executed on the author’s 32-bit system, the garbage collector decided to move objects around if the free space is larger than 16 bytes, consists of more than one object, and more than 16KB of allocations have been made since the last garbage collection. You can’t rely on these results being reproducible, but this does demonstrate the existence of the optimization.
Note Contrary to popular belief, the garbage collector does not always move objects around (i.e., there are some sweep-only collections that do not proceed into the compact phase), even if they are not pinned (see below) and even if free space is available between objects. There is an implementation-defined heuristic which determines whether moving objects to fill free space is worthwhile during the sweep phase. For example, in one test suite executed on the author’s 32-bit system, the garbage collector decided to move objects around if the free space is larger than 16 bytes, consists of more than one object, and more than 16KB of allocations have been made since the last garbage collection. You can’t rely on these results being reproducible, but this does demonstrate the existence of the optimization.
The mark and sweep model described in the preceding sections is subject to one significant deficiency that we will address later in this chapter as we approach the generational GC model. Whenever a collection occurs, all objects in the heap are traversed even if they can be partitioned by likelihood of collection efficiency. If we had prior knowledge that some objects are more likely to die than others, we might be able to tune our collection algorithm accordingly and obtain a lower amortized collection cost.
The garbage collection model presented above does not address a common use case for managed objects. This use case revolves around passing managed objects for consumption by unmanaged code. Two distinct approaches can be used for solving this problem:
- Every object that should be passed to unmanaged code is marshaled by value (copied) when it’s passed to unmanaged code, and marshaled back when it’s returned.
- Instead of copying the object, a pointer to it is passed to unmanaged code.
Copying memory around every time we need to interact with unmanaged code is an unrealistic proposition. Consider the case of soft real-time video processing software that needs to propagate high-resolution images from unmanaged code to managed code and vice versa at 30 frames per second. Copying multiple megabytes of memory every time a minor change is made will deteriorate performance to unacceptable levels.
The .NET memory management model provides the facilities for obtaining the memory address of a managed object. However, passing this address to unmanaged code in the presence of the garbage collector raises an important concern: What happens if the object is moved by the GC while the unmanaged code is still executing and using the pointer?
This scenario can have disastrous consequences—memory can easily become corrupted. One reliable solution to this problem is turning off the garbage collector while unmanaged code has a pointer to a managed object. However, this approach is not granular enough if objects are frequently passed between managed and unmanaged code. It also has the potential of deadlocks or memory exhaustion if a thread enters a long wait from within unmanaged code.
Instead of turning garbage collection off, every managed object whose address can be obtained must also be pinned in memory. Pinning an object prevents the garbage collector from moving it around during the sweep phase until it is unpinned.
The pinning operation itself is not very expensive—there are multiple mechanisms that perform it rather cheaply. The most explicit way to pin an object is to create a GC handle with the GCHandleType.Pinned flag. Creating a GC handle creates a new root in the process’ GC handle table, which tells the GC that the object should be retained as well as pinned in memory. Other alternatives include the magic sauce used by the P/Invoke marshaler, and the pinned pointers mechanism exposed in C# through the fixed keyword (or pin_ptr < T > in C++/CLI), which relies on marking the pinning local variable in a special way for the GC to see. (Consult Chapter 8 for more details.)
However, the performance cost around pinning becomes apparent when we consider how pinning affects the garbage collection itself. When the garbage collector encounters a pinned object during the compact phase, it must work around that object to ensure that it is not moved in memory. This complicates the collection algorithm, but the direst effect is that fragmentation is introduced into the managed heap. A badly fragmented heap directly invalidates the assumptions which make garbage collection viable: It causes consecutive allocations to be fragmented in memory (and the loss of locality), introduces complexity into the allocation process, and causes a waste of memory as fragments cannot be filled.
![]() Note Pinning side-effects can be diagnosed with multiple tools, including the Microsoft CLR Profiler. The CLR profiler can display a graph of objects by address, showing free (fragmented) areas as unused white space. Alternatively, SOS.DLL (the managed debugging extension) can be used to display objects of type “Free”, which are holes created due to fragmentation. Finally, the # of Pinned Objects performance counter (in the .NET CLR Memory performance counter category) can be used to determine how many objects were pinned in the last area examined by the GC.
Note Pinning side-effects can be diagnosed with multiple tools, including the Microsoft CLR Profiler. The CLR profiler can display a graph of objects by address, showing free (fragmented) areas as unused white space. Alternatively, SOS.DLL (the managed debugging extension) can be used to display objects of type “Free”, which are holes created due to fragmentation. Finally, the # of Pinned Objects performance counter (in the .NET CLR Memory performance counter category) can be used to determine how many objects were pinned in the last area examined by the GC.
Despite the above disadvantages, pinning is a necessity in many applications. Oftentimes we do not control pinning directly, when there is an abstraction layer (such as P/Invoke) that takes care of the fine details on our behalf. Later in this chapter, we will come up with a set of recommendations that will minimize the negative effects of pinning.
We have reviewed the basic steps the garbage collector undertakes during a collection cycle. We have also seen what happens to objects that must be passed to unmanaged code. Throughout the previous sections we have seen many areas where optimizations are in place. One thing that was mentioned frequently is that on multi-processor machines, contention and the need for synchronization might be a very significant factor for the performance of memory-intensive applications. In the subsequent sections, we will examine multiple optimizations including optimizations targeting multi-processor systems.
The .NET garbage collector comes in several flavors, even though it might appear to the outside as a large and monolithic piece of code with little room for customization. These flavors exist to differentiate multiple scenarios: Client-oriented applications, high-performance server applications, and so on. To understand how these various flavors are really different from each other, we must look at the garbage collector’s interaction with the other application threads (often called mutator threads).
Pausing Threads for Garbage Collection
When a garbage collection occurs, application threads are normally executing. After all, the garbage collection request is typically a result of a new allocation being made in the application’s code—so it’s certainly willing to run. The work performed by the GC affects the memory locations of objects and the references to these objects. Moving objects in memory and changing their references while application code is using them is prone to be problematic.
On the other hand, in some scenarios executing the garbage collection process concurrently with other application threads is of paramount importance. For example, consider a classic GUI application. If the garbage collection process is triggered on a background thread, we want to be able to keep the UI responsive while the collection occurs. Even though the collection itself might take longer to complete (because the UI is competing for CPU resources with the GC), the user is going to be much happier because the application is more responsive.
There are two categories of problems that can arise if the garbage collector executes concurrently with other application threads:
- False negatives: An object is considered alive even though it is eligible for garbage collection. This is an undesired effect, but if the object is going to be collected in the next cycle, we can live with the consequences.
- False positives: An object is considered dead even though it is still referenced by the application. This is a debugging nightmare, and the garbage collector must do everything in its power to prevent this situation from happening.
Let’s consider the two phases of garbage collection and see whether we can afford running application threads concurrently with the GC process. Note that whatever conclusions we might reach, there are still scenarios that will require pausing threads during the garbage collection process. For example, if the process truly runs out of memory, it will be necessary to suspend threads while memory is being reclaimed. However, we will review less exceptional scenarios, which amount for the majority of the cases.
SUSPENDING THREADS FOR GC
Suspending threads for garbage collection is performed at safe points. Not every set of two instructions can be interrupted to perform a collection. The JIT emits additional information so that the suspension occurs when it’s safe to perform the collection, and the CLR tries to suspend threads gracefully—it will not resort to a blatant SuspendThread Win32 API call without verifying that the thread is safe after suspension.
In CLR 2.0, it was possible to come up with a scenario where a managed thread entangled in a very tight CPU-bound loop would pass around safe points for a long time, causing delays of up to 1500 milliseconds in GC startup (which, in turn, delayed any threads that were already blocked waiting for GC to complete). This problem was fixed in CLR 4.0; if you are curious about the details, read Sasha Goldshtein’s blog post, “Garbage Collection Thread Suspension Delay” (http://blog.sashag.net/archive/2009/07/31/garbage-collection-thread-suspension-delay-250ms-multiples.aspx, 2009).
Note that unmanaged threads are not affected by thread suspension until they return to managed code—this is taken care of by the P/Invoke transition stub.
Pausing Threads during the Mark Phase
During the mark phase, the garbage collector’s work is almost read-only. False negatives and false positives can occur nonetheless.
A newly created object can be considered dead by the collector even though it is referenced by the application. This is possible if the collector has already considered the part of the graph that is updated when the object is created (see Figure 4-7). This can be addressed by intercepting the creation of new references (and new objects) and making sure to mark them. It requires synchronization and increases the allocation cost, but allows other threads to execute concurrently with the collection process.

Figure 4-7 . An object is introduced into the graph after that part of the graph was already marked (dashed objects were already marked). This causes the object to be wrongly assumed unreachable
An object that was already marked by the collector can be eligible for garbage collection if during the mark phase the last reference to it was removed (see Figure 4-8). This is not a severe problem that requires consideration; after all, if the object is really unreachable, it will be collected at the next GC cycle—there is no way for a dead object to become reachable again.
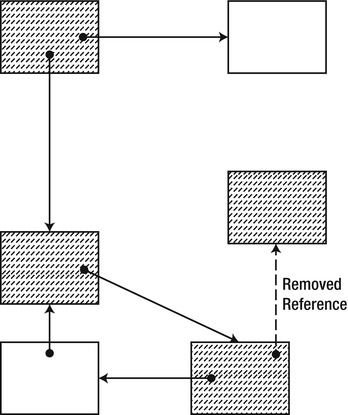
Figure 4-8 . An object is removed from the graph after that part of the graph was already marked (dashed objects were already marked). This causes the object to be wrongly assumed reachable
Pausing Threads during the Sweep Phase
During the sweep phase, not only do references change, but objects move around in memory. This poses a new set of problems for application threads executing concurrently. Among these problems:
- Copying an object is not an atomic operation. This means that after part of the object has been copied, the original is still being modified by the application.
- Updating references to the object is not an atomic operation. This means that some parts of the application might be using the old object reference and some other parts might be using the new one.
Addressing these problems is possible (Azul Pauseless GC for JVM, http://www.azulsystems.com/zing/pgc, is one example), but has not been done in the CLR GC. It is simpler to declare that the sweep phase does not support application threads executing concurrently with the garbage collector.
![]() Tip To determine whether concurrent GC can provide any benefit for your application, you must first determine how much time it normally spends performing garbage collection. If your application spends 50% of its time reclaiming memory, there remains plenty of room for optimization. On the other hand, if you only perform a collection once in a few minutes, you probably should stick to whatever works for you and pursue significant optimizations elsewhere. You can find out how much time you’re spending performing garbage collection through the % Time in GC performance counter in the .NET CLR Memory performance category.
Tip To determine whether concurrent GC can provide any benefit for your application, you must first determine how much time it normally spends performing garbage collection. If your application spends 50% of its time reclaiming memory, there remains plenty of room for optimization. On the other hand, if you only perform a collection once in a few minutes, you probably should stick to whatever works for you and pursue significant optimizations elsewhere. You can find out how much time you’re spending performing garbage collection through the % Time in GC performance counter in the .NET CLR Memory performance category.
Now that we’ve reviewed how other application threads might behave while a garbage collection is in progress, we can examine the various GC flavors in greater detail.
The first GC flavor we will look into is termed the workstation GC. It is further divided into two sub-flavors: concurrent workstation GC and non-concurrent workstation GC.
Under workstation GC, there is a single thread that performs the garbage collection—the garbage collection does not run in parallel. Note that there’s a difference between running the collection process itself in parallel on multiple processors, and running the collection process concurrently with other application threads.
Concurrent Workstation GC
The concurrent workstation GC flavor is the default flavor. Under concurrent workstation GC, there is a separate, dedicated GC thread marked with THREAD_PRIORITY_HIGHEST that executes the garbage collection from start to finish. Moreover, the CLR can decide that it wants some phases of the garbage collection process to run concurrently with application threads (most of the mark phase can execute concurrently, as we have seen above). Note that the decision is still up to the CLR—as we will see later, some collections are fast enough to warrant full suspension, such as generation 0 collections. One way or another, when the sweep phase is performed, all application threads are suspended.
The responsiveness benefits of using the concurrent workstation GC can be trumped if the garbage collection is triggered by the UI thread. In that case, the application’s background threads will be competing with the garbage collection, for which the UI is waiting. This can actually lower the UI responsiveness because the UI thread is blocked until GC completes, and there are other application threads competing for resources with the GC. (See Figure 4-9.)
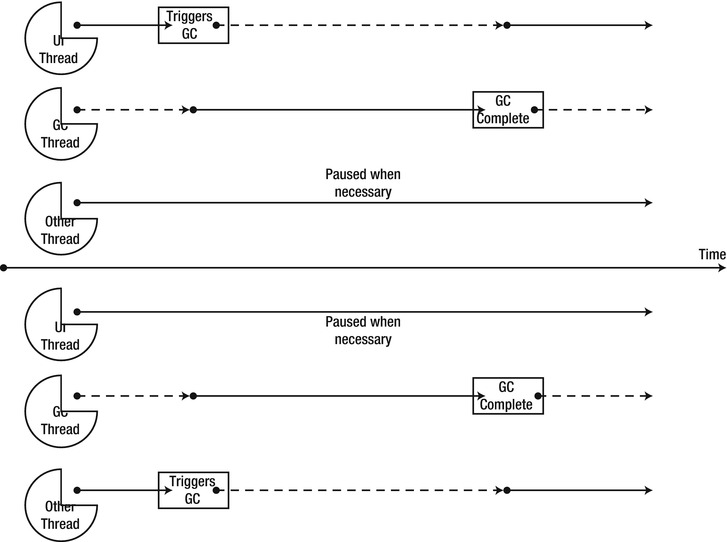
Figure 4-9 . The upper part shows concurrent GC when the UI thread triggers the collection. The lower part shows concurrent GC when one of the background threads triggers the collection. (Dashed lines represent blocked threads.)
Therefore, UI applications using concurrent workstation GC should exercise great care to prevent garbage collections from occurring on the UI thread. This boils down to performing allocations on background threads, and refraining from explicitly calling GC.Collect on the UI thread.
The default GC flavor for all .NET applications (save ASP.NET applications), regardless of whether they run on a user’s workstation or a powerful multiprocessor server is the concurrent workstation GC. This default is rarely appropriate for server applications, as we will see shortly. As we have just seen, this is not necessarily the appropriate default for UI applications either, if they tend to trigger garbage collections on the UI thread.
Non-Concurrent Workstation GC
The non-concurrent workstation GC flavor, as its name implies, suspends the application threads during both the mark and sweep phases. The primary usage scenario for non-concurrent workstation GC is the case mentioned in the previous section, when the UI thread tends to trigger garbage collections. In this case, non-concurrent GC might provide better responsiveness, because background threads won’t be competing with the garbage collection for which the UI thread is waiting, thus releasing the UI thread more quickly. (See Figure 4-10.)

Figure 4-10 . The UI thread triggers a collection under non-concurrent GC. The other threads do not compete for resources during the collection
The server GC flavor is optimized for a completely different type of applications—server applications, as its name implies. Server applications in this context require high-throughput scenarios (often at the expense of latency for an individual operation). Server applications also require easy scaling to multiple processors – and memory management must be able to scale to multiple processors just as well.
An application that uses the server GC has the following characteristics:
- There is a separate managed heap for each processor in the affinity mask of the .NET process. Allocation requests by a thread on a specific processor are satisfied from the managed heap that belongs to that specific processor. The purpose of this separation is to minimize contention on the managed heap while allocations are made: most of the time, there is no contention on the next object pointer and multiple threads can perform allocations truly in parallel. This architecture requires dynamic adjustment of the heap sizes and GC thresholds to ensure fairness if the application creates manual worker threads and assigns them hard CPU affinity. In the case of typical server applications, which service requests off a thread pool worker thread, it is likely that all heaps will have approximately the same size.
- The garbage collection does not occur on the thread that triggered garbage collection. Instead, garbage collection occurs on a set of dedicated GC threads that are created during application startup and are marked THREAD_PRIORITY_HIGHEST. There is a GC thread for each processor that is in the affinity mask of the .NET process. This allows each thread to perform garbage collection in parallel on the managed heap assigned to its processor. Thanks to locality of reference, it is likely that each GC thread should perform the mark phase almost exclusively within its own heap, parts of which are guaranteed to be in that CPU’s cache.
- During both phases of garbage collection, all application threads are suspended. This allows GC to complete in a timely fashion and allows application threads to continue processing requests as soon as possible. It maximizes throughput at the expense of latency: some requests might take longer to process while a garbage collection is in progress, but overall the application can process more requests because less context switching is introduced while GC is in progress.
When using server GC, the CLR attempts to balance object allocations across the processor heaps. Up to CLR 4.0, only the small object heap was balanced; as of CLR 4.5, the large object heap (discussed later) is balanced as well. As a result, the allocation rate, fill rate, and garbage collection frequency are kept similar for all heaps.
The only limitation imposed on using the server GC flavor is the number of physical processors on the machine. If there is just one physical processor on the machine, the only available GC flavor is the workstation GC. This is a reasonable choice, because if there is just a single processor available, there will be a single managed heap and a single GC thread, which hinders the effectiveness of the server GC architecture.
![]() Note Starting from NT 6.1 (Windows 7 and Windows Server 2008 R2), Windows supports more than 64 logical processors by using processor groups. As of CLR 4.5, the GC can use more than 64 logical processors as well. This requires placing the < GCCpuGroup enabled = "true" /> element in your application configuration file.
Note Starting from NT 6.1 (Windows 7 and Windows Server 2008 R2), Windows supports more than 64 logical processors by using processor groups. As of CLR 4.5, the GC can use more than 64 logical processors as well. This requires placing the < GCCpuGroup enabled = "true" /> element in your application configuration file.
Server applications are likely to benefit from the server GC flavor. However, as we have seen before, the default GC flavor is the workstation concurrent GC. This is true for applications hosted under the default CLR host, in console applications, Windows applications and Windows services. Non-default CLR hosts can opt-in to a different GC flavor. This is what the IIS ASP.NET host does: it runs applications under the server GC flavor, because it’s typical for IIS to be installed on a server machine (even though this behavior can still be customized through Web.config).
Controlling the GC flavor is the subject of the next section. It is an interesting experiment in performance testing, especially for memory-intensive applications. It’s a good idea to test the behavior of such applications under the various GC flavors to see which one results in optimal performance under heavy memory load.
Switching Between GC Flavors
It is possible to control the GC flavor with CLR Hosting interfaces, discussed later in this chapter. However, for the default host, it is also possible to control the GC flavor selection using an application configuration file (App.config). The following XML application configuration file can be used to choose between the various GC flavors and sub-flavors:
<?xml version="1.0" encoding="utf-8" ?>
<configuration>
  <runtime>
    <gcServer enabled="true" />
    <gcConcurrent enabled="false" />
  </runtime>
</configuration>
The gcServer element controls the selection of server GC as opposed to workstation GC. The gcConcurrent element controls the selection of the workstation GC sub-flavor.
.NET 3.5 (including .NET 2.0 SP1 and .NET 3.0 SP1) added an additional API that can change the GC flavor at runtime. It is available as the System.Runtime.GCSettings class, which has two properties: IsServerGC and LatencyMode.
GCSettings.IsServerGC is a read-only property that specifies whether the application is running under the server GC. It can’t be used to opt into server GC at runtime, and reflects only the state of the application’s configuration or the CLR host’s GC flavor definition.
The LatencyMode property, on the other hand, takes the values of the GCLatencyMode enumeration, which are: Batch, Interactive, LowLatency, and SustainedLowLatency. Batch corresponds to non-concurrent GC; Interactive corresponds to concurrent GC. The LatencyMode property can be used to switch between concurrent and non-concurrent GC at runtime.
The final, most interesting values of the GCLatencyMode enumeration are LowLatency and SustainedLowLatency. These values signal to the garbage collector that your code is currently in the middle of a time-sensitive operation where a garbage collection might be harmful. The LowLatency value was introduced in .NET 3.5, was supported only on concurrent workstation GC, and is designed for short time-sensitive regions. On the other hand, SustainedLowLatency was introduced in CLR 4.5, is supported on both server and workstation GC, and is designed for longer periods of time during which your application should not be paused for a full garbage collection. Low latency is not for the scenarios when you’re about to execute missile-guiding code for reasons to be seen shortly. It is useful, however, if you’re in the middle of performing a UI animation, and garbage collection will be disruptive for the user experience.
The low latency garbage collection mode instructs the garbage collector to refrain from performing full collections unless absolutely necessary—e.g., if the operating system is running low on physical memory (the effects of paging could be even worse than the effects of performing a full collection). Low latency does not mean the garbage collector is off; partial collections (which we will consider when discussing generations) will still be performed, but the garbage collector’s share of the application’s processing time will be significantly lower.
USING LOW LATENCY GC SAFELY
The only safe way of using the low latency GC mode is within a constrained execution region (CER). A CER delimits a section of code in which the CLR is constrained from throwing out-of-band exceptions (such as thread aborts) which would prevent the section of code from executing in its entirety. Code placed in a CER must call only code with strong reliability guarantees. Using a CER is the only way of guaranteeing that the latency mode will revert to its previous value. The following code demonstrates how this can be accomplished (you should import the System.Runtime.CompilerServices and System.Runtime namespaces to compile this code):
GCLatencyMode oldMode = GCSettings.LatencyMode;
RuntimeHelpers.PrepareConstrainedRegions();
try
{
    GCSettings.LatencyMode = GCLatencyMode.LowLatency;
    //Perform time-sensitive work here
}
finally
{
    GCSettings.LatencyMode = oldMode;
}
The amount of time you want to spend with a low latency GC mode must be kept to a minimum—the long-term effects once you exit the low latency mode and the GC aggressively begins to reclaim unused memory can hinder the application’s performance. If you don’t have full control of all allocations taking place within your process (e.g. if you’re hosting plug-ins or have multiple background threads doing independent work), remember that switching to the low latency GC mode affects the entire process, and can cause undesired effects for other allocation paths.
Choosing the right GC flavor is not a trivial task, and most of the time we can only arrive at the appropriate mode through experimentation. However, for memory-intensive applications this experimentation is a must—we can’t afford spending 50% of our precious CPU time performing garbage collections on a single processor while 15 others happily sit idle and wait for the collection to complete.
Some severe performance problems still plague us as we carefully examine the model laid out above. The following are the most significant problems:
- Large Objects: Copying large objects is an extremely expensive operation, and yet during the sweep phase large objects can be copied around all the time. In certain cases, copying memory might become the primary cost of performing a garbage collection. We arrive at the conclusion that objects must be differentiated by size during the sweep phase.
- Collection Efficiency Factor: Every collection is a full collection, which means that an application with a relatively stable set of objects will pay the heavy price of performing mark and sweep across the entire heap even though most of the objects are still referenced. To prevent a low collection efficiency factor, we must pursue an optimization which can differentiate objects by their collection likelihood: whether they are likely to be collected at the next GC cycle.
Most aspects of these problems can be addressed with the proper use of generations, which is the topic we cover in the next section. We will also touch on some additional performance issues that you need to consider when interacting with the .NET garbage collector.
Generations
The generational model of the .NET garbage collector optimizes collection performance by performing partial garbage collections. Partial garbage collections have a higher collection efficiency factor, and the objects traversed by the collector are those with optimal collection likelihood. The primary decision factor for partitioning objects by collection likelihood is their age—the model assumes that there is an inherent correlation between the object’s age and its life expectancy.
Generational Model Assumptions
Contrary to the human and animal world, young .NET objects are expected to die quickly, whereas old .NET objects are expected to live longer. These two assumptions force the distribution of object life expectancies into the two corners of the graph in Figure 4-11.
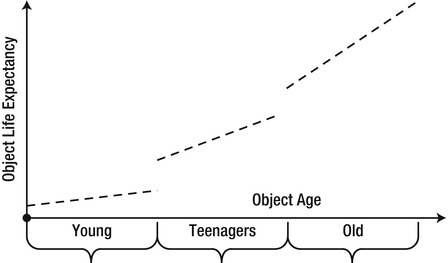
Figure 4-11 . Object life expectancy as a function of object age, partitioned into three areas
![]() Note The definitions of “young” and “old” depend on the frequency of garbage collections the application induces. An object that was created 5 seconds ago will be considered young if a garbage collection occurs once a minute. In another system, it will be considered old because the system is very memory-intensive and causes dozens of collections per second. Nevertheless, in most applications temporary objects (e.g. allocated locally as part of a method call) tend to die young, and objects allocated at application initialization tend to live longer.
Note The definitions of “young” and “old” depend on the frequency of garbage collections the application induces. An object that was created 5 seconds ago will be considered young if a garbage collection occurs once a minute. In another system, it will be considered old because the system is very memory-intensive and causes dozens of collections per second. Nevertheless, in most applications temporary objects (e.g. allocated locally as part of a method call) tend to die young, and objects allocated at application initialization tend to live longer.
Under the generational model, most new objects are expected to exhibit temporary behavior—allocated for a specific, short-lived purpose, and turned into garbage shortly afterwards. On the other hand, objects that have survived a long time (e.g. singleton or well-known objects allocated when the application was initialized) are expected to survive even longer.
Not every application obeys the assumptions imposed by the generational model. It is easy to envision a system in which temporary objects survive several garbage collections and then become unreferenced, and more temporary objects are created. This phenomenon, in which an object’s life expectancy does not fall within the buckets predicted by the generational model, is informally termed mid-life crisis. Objects that exhibit this phenomenon outweigh the benefits of the performance optimization offered by the generational model. We will examine mid-life crisis later in this section.
.NET Implementation of Generations
In the generational model, the garbage collected heap is partitioned into three regions: generation 0, generation 1, and generation 2. These regions reflect on the projected life expectancy of the objects they contain: generation 0 contains the youngest objects, and generation 2 contains old objects that have survived for a while.
Generation 0
Generation 0 is the playground for all new objects (later in this section we will see that objects are also partitioned by size, which makes this statement only partially correct). It is very small, and cannot accommodate for all the memory usage of even the smallest of applications. Generation 0 usually starts with a budget between 256 KB-4 MB and might grow slightly if the need arises.
![]() Note Aside from OS bitness, L2 and L3 cache sizes also affect the size of generation 0, because the primary objective of this generation is to contain objects that are frequently accessed and are accessed together, for a short period of time. It is also controlled dynamically by the garbage collector at runtime, and can be controlled at application startup by a CLR host by setting the GC startup limits. The budget for both generation 0 and generation 1 together cannot exceed the size of a single segment (discussed later).
Note Aside from OS bitness, L2 and L3 cache sizes also affect the size of generation 0, because the primary objective of this generation is to contain objects that are frequently accessed and are accessed together, for a short period of time. It is also controlled dynamically by the garbage collector at runtime, and can be controlled at application startup by a CLR host by setting the GC startup limits. The budget for both generation 0 and generation 1 together cannot exceed the size of a single segment (discussed later).
When a new allocation request cannot be satisfied from generation 0 because it is full, a garbage collection is initiated within generation 0. In this process, the garbage collector touches only those objects which belong in generation 0 during the mark and sweep phases. This is not trivial to achieve because there is no prior correlation between roots and generations, and there is always the possibility of an object outside generation 0 referencing an object inside generation 0. We will examine this difficulty shortly.
A garbage collection within generation 0 is a very cheap and efficient process for several reasons:
- Generation 0 is very small and therefore it does not contain many objects. Traversing such a small amount of memory takes very little time. On one of our test machines, performing a generation 0 collection with 2% of the objects surviving took approximately 70 µs (microseconds).
- Cache size affects the size of generation 0, which makes it more likely for all the objects in generation 0 to be found in cache. Traversing memory that is already in cache is significantly faster than accessing it from main memory or paging it in from disk, as we shall see in Chapter 5.
- Due to temporal locality, it is likely that objects allocated in generation 0 have references to other objects in generation 0. It is also likely that these objects are close to each other in space. This makes traversing the graph during the mark phase more efficient if cache misses are taken after all.
- Because new objects are expected to die quickly, the collection likelihood for each individual object encountered is extremely high. This in turn means that most of the objects in generation 0 do not have to be touched—they are just unused memory that can be reclaimed for other objects to use. This also means that we have not wasted time performing this garbage collection; most objects are actually unreferenced and their memory can be reused.
- When the garbage collection ends, the reclaimed memory will be used to satisfy new allocation requests. Because it has just been traversed, it is likely to be in the CPU cache, rendering allocations and subsequent object access somewhat faster.
As we have observed, almost all objects are expected to disappear from generation 0 when the collection completes. However, some objects might survive due to a variety of reasons:
- The application might be poorly-behaved and performs allocations of temporary objects that survive more than a single garbage collection.
- The application is at the initialization stage, when long-lived objects are being allocated.
- The application has created some temporary short-lived objects which happened to be in use when the garbage collection was triggered.
The objects that have survived a garbage collection in generation 0 are not swept to the beginning of generation 0. Instead, they are promoted to generation 1, to reflect the fact that their life expectancy is now longer. As part of this promotion, they are copied from the region of memory occupied by generation 0 to the region of memory occupied by generation 1 (see Figure 4-12). This copy might appear to be expensive, but it is a part of the sweep operation one way or another. Additionally, because the collection efficiency factor in generation 0 is very high, the amortized cost of this copy should be negligible compared to the performance gains from performing a partial collection instead of a full one.
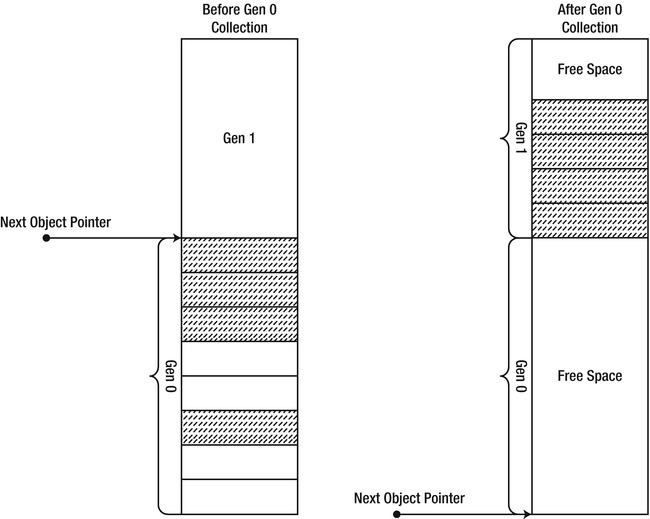
Figure 4-12 . Live (surviving) objects from generation 0 are promoted to generation 1 after a garbage collection completes
MOVING PINNED OBJECTS ACROSS GENERATIONS
Pinning an object prevents it from being moved by the garbage collector. In the generational model, it prevents promotion of pinned objects between generations. This is especially significant in the younger generations, such as generation 0, because the size of generation 0 is very small. Pinned objects that cause fragmentation within generation 0 have the potential of causing more harm than it might appear from examining pinned before we introduced generations into the picture. Fortunately, the CLR has the ability to promote pinned objects using the following trick: if generation 0 becomes severely fragmented with pinned objects, the CLR can declare the entire space of generation 0 to be considered a higher generation, and allocate new objects from a new region of memory that will become generation 0. This is achieved by changing the ephemeral segment, which will be discussed later in this chapter.
The following code demonstrates that pinned objects can move across generations, by using the GC.GetGeneration method discussed later in this chapter:
static void Main(string[] args) {
    byte[] bytes = new byte[128];
    GCHandle gch = GCHandle.Alloc(bytes, GCHandleType.Pinned);

    GC.Collect();
    Console.WriteLine("Generation: " + GC.GetGeneration(bytes));

    gch.Free();
    GC.KeepAlive(bytes);
}
If we examine the GC heap before the garbage collection, the generations are aligned similarly to the following:
Generation 0 starts at 0x02791030
Generation 1 starts at 0x02791018
Generation 2 starts at 0x02791000
If we examine the GC heap after the garbage collection, the generations are re-aligned within the same segment similarly to the following:
Generation 0 starts at 0x02795df8
Generation 1 starts at 0x02791018
Generation 2 starts at 0x02791000
The object’s address (in this case, 0x02791be0) hasn’t changed because it is pinned, but by moving the generation boundaries the CLR maintains the illusion that the object was promoted between generations.
Generation 1 is the buffer between generation 0 and generation 2. It contains objects that have survived one garbage collection. It is slightly larger than generation 0, but still smaller by several orders of magnitude than the entire available memory space. A typical starting budget for generation 1 ranges from 512 KB-4 MB.
When generation 1 becomes full, a garbage collection is triggered in generation 1. This is still a partial garbage collection; only objects in generation 1 are marked and swept by the garbage collector. Note that the only natural trigger for a collection in generation 1 is a prior collection in generation 0, as objects are promoted from generation 0 to generation 1 (inducing a garbage collection manually is another trigger).
A garbage collection in generation 1 is still a relatively cheap process. A few megabytes of memory must be touched, at most, to perform a collection. The collection efficiency factor is still high, too, because most objects that reach generation 1 should be temporary short-lived objects—objects that weren’t reclaimed in generation 0, but will not outlive another garbage collection. For example, short-lived objects with finalizers are guaranteed to reach generation 1. (We will discuss finalization later in this chapter.)
Surviving objects from generation 1 are promoted to generation 2. This promotion reflects the fact that they are now considered old objects. One of the primary risks in generational model is that temporary objects creep into generation 2 and die shortly afterwards; this is the mid-life crisis. It is extremely important to ensure that temporary objects do not reach generation 2. Later in this section we will examine the dire effects of the mid-life crisis phenomenon, and look into diagnostic and preventive measures.
Generation 2 is the ultimate region of memory for objects that have survived at least two garbage collections (and for large objects, as we will see later). In the generational model, these objects are considered old and, based on our assumptions, should not become eligible for garbage collection in the near future.
Generation 2 is not artificially limited in size. Its size can extend the entire memory space dedicated for the OS process, i.e., up to 2 GB of memory on a 32-bit system, or up to 8 TB of memory on a 64-bit system.
![]() Note Despite its huge size, there are dynamic thresholds (watermarks) within generation 2 that cause a garbage collection to be triggered, because it does not make sense to wait until the entire memory space is full to perform a garbage collection. If every application on the system could run until the memory space is exhausted, and only then the GC would reclaim unused memory, paging effects will grind the system to a halt.
Note Despite its huge size, there are dynamic thresholds (watermarks) within generation 2 that cause a garbage collection to be triggered, because it does not make sense to wait until the entire memory space is full to perform a garbage collection. If every application on the system could run until the memory space is exhausted, and only then the GC would reclaim unused memory, paging effects will grind the system to a halt.
When a garbage collection occurs within generation 2, it is a full garbage collection. This is the most expensive kind of garbage collection, which can take the longest to complete. On one of our test machines, performing a full garbage collection of 100MB of referenced objects takes approximately 30ms (milliseconds)—several orders of magnitude slower than a collection of a younger generation.
Additionally, if the application behaves according to the generational model assumptions, a garbage collection in generation 2 is also likely to exhibit a very low collection efficiency factor, because most objects in generation 2 will outlive multiple garbage collection cycles. Because of this, a garbage collection in generation 2 should be a rare occasion—it is extremely slow compared to partial collections of the younger generations, and it is inefficient because most of the objects traversed are still referenced and there is hardly any memory to reclaim.
If all temporary objects allocated by the application die quickly, they do not get a chance to survive multiple garbage collections and reach generation 2. In this optimistic scenario, there will be no collections in generation 2, and the garbage collector’s effect on application performance is minimized by several orders of magnitude.
Through the careful use of generations, we have managed to address one of our primary concerns with the naïve garbage collector outlined in the previous sections: partitioning objects by their collection likelihood. If we successfully predict the life expectancy of objects based on their current life span, we can perform cheap partial garbage collections and only rarely resort to expensive full collections. However, another concern remains unaddressed and even aggravated: large objects are copied during the sweep phase, which can be very expensive in terms of CPU and memory work. Additionally, in the generational model, it is unclear how generation 0 can contain an array of 10,000,000 integers, which is significantly larger than its size.
The large object heap (LOH) is a special area reserved for large objects. Large objects are objects that occupy more than 85KB of memory. This threshold applies to the object itself, and not to the size of the entire object graph rooted at the object, so that an array of 1,000 strings (each 100 characters in size) is not a large object because the array itself contains only 4-byte or 8-byte references to the strings, but an array of 50,000 integers is a large object.
Large objects are allocated from the LOH directly, and do not pass through generation 0, generation 1 or generation 2. This minimizes the cost of promoting them across generations, which would mean copying their memory around. However, when a garbage collection occurs within the LOH, the sweep phase might have to copy objects around, incurring the same performance hit. To avoid this performance cost, objects in the large object heap are not subject to the standard sweep algorithm.
Instead of sweeping large objects and copying them around, the garbage collector employs a different strategy when collecting the LOH. A linked list of all unused memory blocks is maintained, and allocation requests can be satisfied from this list. This strategy is very similar to the free list memory management strategy discussed in the beginning of this chapter, and comes with the same performance costs: allocation cost (finding an appropriate free block, breaking free blocks in parts), deallocation cost (returning the memory region into the free list) and management cost (joining adjacent blocks together). However, it is cheaper to use free list management than it is to copy large objects in memory—and this is a typical scenario where purity of implementation is compromised to achieve better performance.
![]() Caution Because objects in the LOH do not move, it might appear that pinning is unnecessary when taking the address in memory of a large object. This is wrong and relies on an implementation detail. You cannot assume that large objects retain the same memory location throughout their lifetime, and the threshold for a large object might change in the future without any notice! From a practical perspective, nonetheless, it is reasonable to assume that pinning large objects will incur less performance costs than pinning small young objects. In fact, in the case of pinned arrays, it is often advisable to allocate a large array, pin it in memory, and distribute chunks from the array instead of allocating a new small array for each operation that requires pinning.
Caution Because objects in the LOH do not move, it might appear that pinning is unnecessary when taking the address in memory of a large object. This is wrong and relies on an implementation detail. You cannot assume that large objects retain the same memory location throughout their lifetime, and the threshold for a large object might change in the future without any notice! From a practical perspective, nonetheless, it is reasonable to assume that pinning large objects will incur less performance costs than pinning small young objects. In fact, in the case of pinned arrays, it is often advisable to allocate a large array, pin it in memory, and distribute chunks from the array instead of allocating a new small array for each operation that requires pinning.
The LOH is collected when the threshold for a collection in generation 2 is reached. Similarly, when a threshold for a collection in the LOH is reached, generation 2 is collected as well. Creating many large temporary objects, therefore, causes the same problems as the mid-life crisis phenomenon—full collections will be performed to reclaim these objects. Fragmentation in the large object heap is another potential problem, because holes between objects are not automatically removed by sweeping and defragmenting the heap.
The LOH model means application developers must take great care of large memory allocations, often bordering on manual memory management. One effective strategy is pooling large objects and reusing them instead of releasing them to the GC. The cost of maintaining the pool might be smaller than the cost of performing full collections. Another possible approach (if arrays of the same type are involved) is allocating a very large object and manually breaking it into chunks as they are needed (see Figure 4-13).
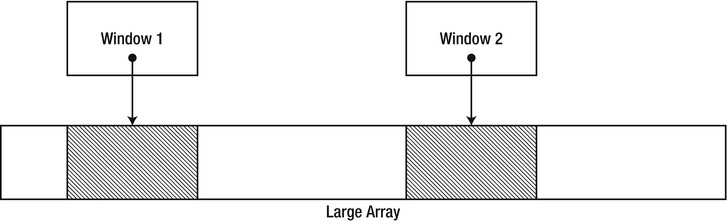
Figure 4-13 . Allocating a large object and manually breaking it into chunks that are exposed to clients through flyweight “window” objects
References between Generations
When discussing the generational model, we dismissed a significant detail which can compromise the correctness and performance of the model. Recall that partial collections of the younger generations are cheap because only objects in the younger generations are traversed during the collection. How does the GC guarantee that it will only touch these younger objects?
Consider the mark phase during a collection of generation 0. During the mark phase, the GC determines the currently active roots, and begins constructing a graph of all objects referenced by the roots. In the process, we want to discard any objects that do not belong to generation 0. However, if we discard them after constructing the entire graph, then we have touched all referenced objects, making the mark phase as expensive as in a full collection. Alternatively, we could stop traversing the graph whenever we reach an object that is not in generation 0. The risk with this approach is that we will never reach objects from generation 0 that are referenced only by objects from a higher generation, as in Figure 4-14!
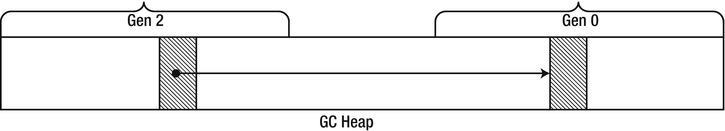
Figure 4-14 . References between generations might be missed if during the mark phase we stop following references once we reach an object in a higher generation
This problem appears to require a compromise between correctness and performance. We can solve it by obtaining prior knowledge of the specific scenario when an object from an older generation has a reference to an object in a younger generation. If the GC had such knowledge prior to performing the mark phase, it could add these old objects into the set of roots when constructing the graph. This would enable the GC to stop traversing the graph when it encounters an object that does not belong to generation 0.
This prior knowledge can be obtained with assistance from the JIT compiler. The scenario in which an object from an older generation references an object from a younger generation can arise from only one category of statements: a non-null reference type assignment to a reference type’s instance field (or an array element write).
class Customer {
    public Order LastOrder { get; set; }
}
class Order { }

class Program {
    static void Main(string[] args) {
     Customer customer = new Customer();
     GC.Collect();
     GC.Collect();
     //customer is now in generation 2
     customer.LastOrder = new Order();
    }
}
When the JIT compiles a statement of this form, it emits a write barrier which intercepts the reference write at run time and records auxiliary information in a data structure called a card table. The write barrier is a light-weight CLR function which checks whether the object being assigned to belongs to a generation older than generation 0. If that’s the case, it updates a byte in the card table corresponding to the range of addresses 1024 bytes around the assignment target (see Figure 4-15).
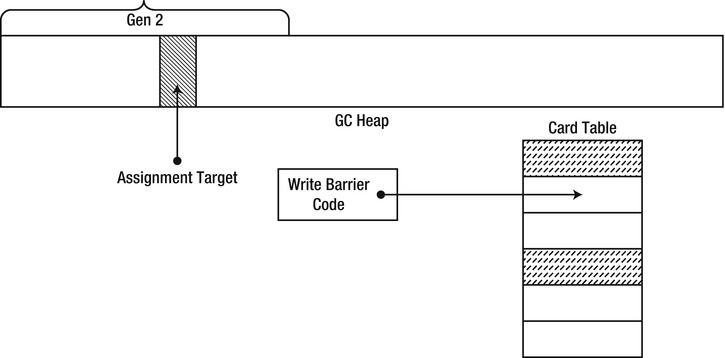
Figure 4-15 . An assignment to a reference field passes through a write barrier which updates the relevant bit in the card table, matching the region in which the reference was updated
Tracing through the write-barrier code is fairly easy with a debugger. First, the actual assignment statement in Main was compiled by the JIT compiler to the following:
; ESI contains a pointer to 'customer', ESI+4 is 'LastOrder', EAX is 'new Order()'
lea edx, [esi+4]
call clr!JIT_WriteBarrierEAX
Inside the write barrier, a check is made to see whether the object being assigned to has an address lower than the start address of generation 1 (i.e., in generation 1 or 2). If that is the case, the card table is updated by assigning 0xFF to the byte at the offset obtained by shifting the object’s address 10 bits to the right. (If the byte was set to 0xFF before, it is not set again, to prevent invalidations of other processor caches; see Chapter 6 for more details.)
mov dword ptr [edx], eax                ; the actual write
cmp eax, 0x272237C                      ; start address of generation 1
jb NoNeedToUpdate
shr edx, 0xA                            ; shift 10 bits to the right
cmp byte ptr [edx+0x48639C], 0xFF       ; 0x48639C is the start of the card table
jne NeedUpdate
NoNeedToUpdate:
ret
NeedUpdate:
mov byte ptr [edx+0x48639C], 0xFF       ;update the card table
ret
The garbage collector uses this auxiliary information when performing the mark phase. It checks the card table to see which address ranges must be considered as roots when collecting the young generation. The collector traverses the objects within these address ranges and locates their references to objects in the younger generation. This enables the performance optimization mentioned above, in which the collector can stop traversing the graph whenever it encounters an object that does not belong to generation 0.
The card table can potentially grow to occupy a single byte for each KB of memory in the heap. This appears to waste ∼ 0.1% of space, but provides a great performance boost when collecting the younger generations. Using an entry in the card table for each individual object reference would be faster (the GC would only have to consider that specific object and not a range of 1024 bytes), but storing additional information at run time for each object reference cannot be afforded. The existing card table approach perfectly reflects this trade-off between memory space and execution time.
![]() Note Although such micro-optimization is rarely worthwhile, we can actively minimize the cost associated with updating and traversing the card table. One possible approach is to pool objects and reuse them instead of creating them. This will minimize garbage collections in general. Another approach is to use value types whenever possible, and minimize the number of references in the graph. Value type assignments do not require a write barrier, because a value type on the heap is always a part of some reference type (or, in boxed form, it is trivially a part of itself).
Note Although such micro-optimization is rarely worthwhile, we can actively minimize the cost associated with updating and traversing the card table. One possible approach is to pool objects and reuse them instead of creating them. This will minimize garbage collections in general. Another approach is to use value types whenever possible, and minimize the number of references in the graph. Value type assignments do not require a write barrier, because a value type on the heap is always a part of some reference type (or, in boxed form, it is trivially a part of itself).
The workstation concurrent GC flavor introduced in CLR 1.0 has a major drawback. Although during a generation 2 concurrent GC application threads are allowed to continue allocating, they can only allocate as much memory as would fit into generations 0 and 1. As soon as this limit is encountered, application threads must block and wait for the collection to complete.
Background GC, introduced in CLR 4.0, enables the CLR to perform a garbage collection in generations 0 and 1 even though a full collection was underway. To allow this, the CLR creates two GC threads: a foreground GC thread and a background GC thread. The background GC thread executes generation 2 collections in the background, and periodically checks for requests to perform a quick collection in generations 0 and 1. When a request arrives (because the application has exhausted the younger generations), the background GC thread suspends itself and yields execution to the foreground GC thread, which performs the quick collection and unblocks the application threads.
In CLR 4.0, background GC was offered automatically for any application using the concurrent workstation GC. There was no way to opt-out of background GC or to use background GC with other GC flavors.
In CLR 4.5, background GC was expanded to the server GC flavor. Moreover, server GC was revamped to support concurrent collections as well. When using concurrent server GC in a process that is using N logical processors, the CLR creates N foreground GC threads and N background GC threads. The background GC threads take care of generation 2 collections, and allow the application code to execute concurrently in the foreground. The foreground GC threads are invoked whenever there’s need to perform a blocking collection if the CLR deems fit, to perform compaction (the background GC threads do not compact), or perform a collection in the younger generations in the midst of a full collection on the background threads.To summarize, as of CLR 4.5, there are four distinct GC flavors that you can choose from using the application configuration file:
- Concurrent workstation GC—the default flavor; has background GC.
- Non-concurrent workstation GC—does not have background GC.
- Non-concurrent server GC—does not have background GC.
- Concurrent server GC—has background GC.
GC Segments and Virtual Memory
In our discussion of the basic GC model and the generational GC model, we have repeatedly assumed that a .NET process usurps the entire memory space available for its hosting process and uses this memory as the backing store for the garbage collected heap. This assumption is blatantly wrong, considering the fact that managed applications can’t survive in isolation without using unmanaged code. The CLR itself is implemented in unmanaged code, the .NET base class library (BCL) often wraps Win32 and COM interfaces, and custom components developed in unmanaged code can be loaded into the otherwise “managed” process.
![]() Note Even if managed code could live in total isolation, it does not make sense for the garbage collector to immediately commit the entire available address space. Although committing memory without using it does not imply the backing store (RAM or disk space) for that memory is immediately required, it is not an operation that comes for free. It is generally advisable to allocate only slightly more than the amount of memory that you are likely to need. As we will see later, the CLR reserves significant memory regions in advance, but commits them only when necessary and makes a point of returning unused memory to Windows.
Note Even if managed code could live in total isolation, it does not make sense for the garbage collector to immediately commit the entire available address space. Although committing memory without using it does not imply the backing store (RAM or disk space) for that memory is immediately required, it is not an operation that comes for free. It is generally advisable to allocate only slightly more than the amount of memory that you are likely to need. As we will see later, the CLR reserves significant memory regions in advance, but commits them only when necessary and makes a point of returning unused memory to Windows.
In view of the above, we must refine the garbage collector’s interaction with the virtual memory manager. During CLR startup within a process, two blocks of memory called GC segments are allocated from virtual memory (more precisely, the CLR host is requested to provide this block of memory). The first segment is used for generation 0, generation 1 and generation 2 (called the ephemeral segment). The second segment is used for the large object heap. The size of the segment depends on the GC flavor and on GC startup limits if running under a CLR host. A typical segment size on 32-bit systems with workstation GC is 16MB, and for server GC it is in the 16-64MB range. On 64-bit systems the CLR uses 128MB-2 GB segments with server GC, and 128MB-256MB segments with workstation GC. (The CLR does not commit an entire segment at a time; it only reserves the address range and commits parts of the segment as the need arises.)
When the segment becomes full and more allocation requests arrive, the CLR allocates another segment. Only one segment can contain generation 0 and generation 1 at any given time. However, it does not have to be the same segment! We have previously observed that pinning objects in generation 0 or generation 1 for a long time is especially dangerous due to fragmentation effects in these small memory regions. The CLR handles these issues by declaring another segment as the ephemeral segment, which effectively promotes the objects previously in the younger generations straight into generation 2 (because there can be only one ephemeral segment).
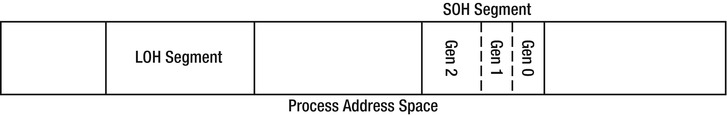
Figure 4-16 . GC segments occupy the virtual address space of the process. The segment containing the young generations is called the ephemeral segment
When a segment becomes empty as the result of a garbage collection, the CLR usually releases the segment’s memory and returns it to the operating system. This is the desired behavior for most applications, especially applications that exhibit infrequent large spikes in memory usage. However, it is possible to instruct the CLR to retain empty segments on a standby list without returning them to the operating system. This behavior is called segment hoarding or VM hoarding, and can be enabled through CLR hosting with the startup flags of the CorBindToRuntimeEx function. Segment hoarding can improve performance in applications which allocate and release segments very frequently (memory-intensive applications with frequent spikes in memory usage), and reduce out of memory exceptions due to virtual memory fragmentation (to be discussed shortly). It is used by default by ASP.NET applications. A custom CLR host can further customize this behavior by satisfying segment allocation requests from a memory pool or any other source by using the IHostMemoryManager interface.
The segmented model of managed memory space introduces an extremely serious problem which has to with external (virtual memory) fragmentation. Because segments are returned to the operating system when they are empty, an unmanaged allocation can occur in the middle of a memory region that was once a GC segment. This allocation causes fragmentation because segments must be consecutive in memory.
The most common causes of virtual memory fragmentation are late-loaded dynamic assemblies (such as XML serialization assemblies or ASP.NET debug compiled pages), dynamically loaded COM objects and unmanaged code performing scattered memory allocations. Virtual memory fragmentation can cause out of memory conditions even when the perceived memory usage of the process is nowhere near the 2 GB limit. Long-running processes such as web servers that perform memory-intensive work with frequent spikes in memory allocation tend to exhibit this behavior after several hours, days or weeks of execution. In non-critical scenarios where a failover is available (such as a load-balanced server farm), this is normally addressed by process recycling.
![]() Note Theoretically speaking, if the segment size is 64MB, the virtual memory allocation granularity is 4KB and the 32-bit process address space is 2GB (in which there is room for only 32 segments), it is possible to allocate only 4KB × 32 = 128KB of unmanaged memory and still fragment the address space such that not a single consecutive segment can be allocated!
Note Theoretically speaking, if the segment size is 64MB, the virtual memory allocation granularity is 4KB and the 32-bit process address space is 2GB (in which there is room for only 32 segments), it is possible to allocate only 4KB × 32 = 128KB of unmanaged memory and still fragment the address space such that not a single consecutive segment can be allocated!
The Sysinternals VMMap utility can diagnose memory fragmentation scenarios quite easily. Not only does it report precisely which region of memory is used for which purposes, it has also a Fragmentation View option that displays a picture of the address space and makes it easy to visualize fragmentation problems. Figure 4-17 shows an example of an address space snapshot in which there are almost 500MB of free space, but no single free fragment large enough for a 16MB GC segment. In the screenshot, white areas are free memory regions.
Figure 4-17 . A badly fragmented address space snapshot. There are almost 500MB of available memory, but no chunk large enough to fit a GC segment
EXPERIMENTING WITH VMMAP
You can try using VMMap with a sample application and see how quickly it points you in the right direction. Specifically, VMMap makes it very easy to determine whether the memory problems you’re experiencing originate within the managed heap or elsewhere, and facilitates the diagnostics of fragmentation problems.
- Download VMMap from Microsoft TechNet (http://technet.microsoft.com/en-us/sysinternals/dd535533.aspx) and store it on your machine.
- Run the OOM2.exe application from this chapter’s sample code folder. The application quickly exhausts all available memory and crashes with an exception. When the Windows error reporting dialog appears, do not dismiss it—keep the application running.
- Run VMMap and choose the OOM2.exe process to monitor. Note the amount of available memory (the “Free” row in the summary table). Open the Fragmentation View (from the View menu) to examine the address space visually. Inspect the detailed list of memory blocks for the “Free” type to see the largest free block in the application’s address space.
- As you can see, the application does not exhaust all the virtual address space, but there is not enough room to allocate a new GC segment—the largest available free block is smaller than 16 MB.
- Repeat steps 2 and 3 with the OOM3.exe application from this chapter’s sample code folder. The memory exhaustion is somewhat slower, and occurs for a different reason.
Whenever you stumble upon a memory-related problem in a Windows application, VMMap should always be ready on your toolbelt. It can point you to managed memory leaks, heap fragmentation, excessive assembly loading, and many other problems. It can even profile unmanaged allocations, helping to detect memory leaks: see Sasha Goldshtein’s blog post on VMMap allocation profiling (http://blog.sashag.net/archive/2011/08/27/vmmap-allocation-profiling-and-leak-detection.aspx).
There are two approaches for addressing the virtual memory fragmentation problem:
- Reducing the number of dynamic assemblies, reducing or pooling unmanaged memory allocations, pooling managed memory allocations or hoarding GC segments. This category of approaches typically extends the amount of time until the problem resurfaces, but does not eliminate it completely.
- Switching to a 64-bit operating system and running the code in a 64-bit process. A 64-bit process has 8TB of address space, which for all practical purposes eliminates the problem completely. Because the problem is not related to the amount of physical memory available, but rather strictly to the amount of virtual address space, switching to 64-bit is sufficient regardless of the amount of physical memory.
This concludes the examination of the segmented GC model, which defines the interaction between managed memory and its underlying virtual memory store. Most applications will never require customizing this interaction; should you be forced to do so in the specific scenarios outlined above, CLR hosting provides the most complete and customizable solution.
This chapter so far addressed in sufficient detail the specifics of managing one type of resources, namely, managed memory. However, in the real world, many other types of resources exist, which can collectively be called unmanaged resources because they are not managed by the CLR or by the garbage collector (such as kernel object handles, database connections, unmanaged memory etc.). Their allocation and deallocation are not governed by GC rules, and the standard memory reclamation techniques outlined above do not suffice when they are concerned.
Freeing unmanaged resources requires an additional feature called finalization, which associates an object (representing an unmanaged resource) with code that must be executed when the object is no longer needed. Oftentimes, this code should be executed in a deterministic fashion when the resource becomes eligible for deallocation; at other times, it can be delayed for a later non-deterministic point in time.
Manual Deterministic Finalization
Consider a fictitious File class that serves as a wrapper for a Win32 file handle. The class has a member field of type System.IntPtr which holds the handle itself. When the file is no longer needed, the CloseHandle Win32 API must be called to close the handle and release the underlying resources.
The deterministic finalization approach requires adding a method to the File class that will close the underlying handle. It is then the client’s responsibility to call this method, even in the face of exceptions, in order to deterministically close the handle and release the unmanaged resource.
class File {
    private IntPtr handle;

    public File(string fileName) {
     handle = CreateFile(...); //P/Invoke call to Win32 CreateFile API
    }
    public void Close() {
     CloseHandle(handle); //P/Invoke call to Win32 CloseHandle API
    }
}
This approach is simple enough and is proven to work in unmanaged environments such as C++, where it is the client’s responsibility to release resources. However, .NET developers accustomed to the practice of automatic resource reclamation might find this model inconvenient. The CLR is expected to provide a mechanism for automatic finalization of unmanaged resources.
Automatic Non-Deterministic Finalization
The automatic mechanism cannot be deterministic because it must rely on the garbage collector to discover whether an object is referenced. The GC’s non-deterministic nature, in turn, implies that finalization will be non-deterministic. At times, this non-deterministic behavior is a show-stopper, because temporary “resource leaks” or holding a shared resource locked for just slightly longer than necessary might be unacceptable behaviors. At other times, it is acceptable, and we try to focus on the scenarios where it is.
Any type can override the protected Finalize method defined by System.Objectto indicate that it requires automatic finalization. The C# syntax for requesting automatic finalization on the File class is the ∼ File method. This method is called a finalizer, and it must be invoked when the object is destroyed.
![]() Note Incidentally, only reference types (classes) can define a finalizer in C#, even though the CLR does not impose this limitation. However, it typically only makes sense for reference types to define a finalization behavior, because value types are eligible for garbage collection only when they are boxed (see Chapter 3 for a detailed treatment of boxing). When a value type is allocated on the stack, it is never added to the finalization queue. When the stack unfolds as part of returning from a method or terminating the frame because of an exception, value type finalizers are not called.
Note Incidentally, only reference types (classes) can define a finalizer in C#, even though the CLR does not impose this limitation. However, it typically only makes sense for reference types to define a finalization behavior, because value types are eligible for garbage collection only when they are boxed (see Chapter 3 for a detailed treatment of boxing). When a value type is allocated on the stack, it is never added to the finalization queue. When the stack unfolds as part of returning from a method or terminating the frame because of an exception, value type finalizers are not called.
When an object with a finalizer is created, a reference to it is added to a special runtime-managed queue called the finalization queue. This queue is considered a root by the garbage collector, meaning that even if the application has no outstanding reference to the object, it is still kept alive by the finalization queue.
When the object becomes unreferenced by the application and a garbage collection occurs, the GC detects that the only reference to the object is the reference from the finalization queue. The GC consequently moves the object reference to another runtime-managed queue called the f-reachable queue. This queue is also considered a root, so at this point the object is still referenced and considered alive.
The object’s finalizer is not run during garbage collection. Instead, a special thread called the finalizer thread is created during CLR initialization (there is one finalization thread per process, regardless of GC flavor, but it runs at THREAD_PRIORITY_HIGHEST). This thread repeatedly waits for the finalization event to become signaled. The GC signals this event after a garbage collection completes, if objects were moved to the f-reachable queue, and as a result the finalizer thread wakes up. The finalizer thread removes the object reference from the f-reachable queue and synchronously executes the finalizer method defined by the object. When the next garbage collection occurs, the object is no longer referenced and therefore the GC can reclaim its memory. Figure 4-18 contains all the moving parts:
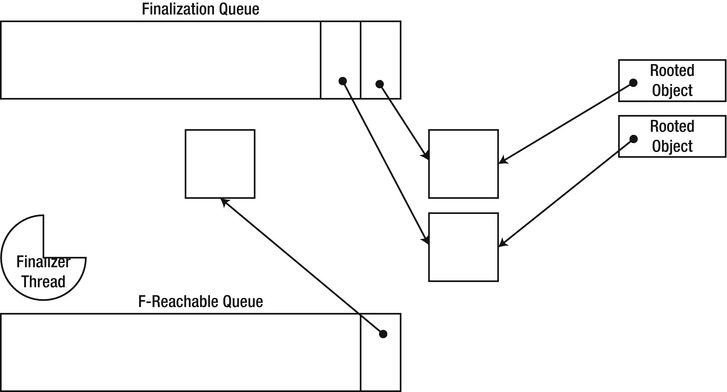
Figure 4-18 . The finalization queue holds references to objects that have a finalizer. When the application stops referencing them, the GC moves the object references to the f-reachable queue. The finalizer thread wakes up and executes the finalizers on these objects, and subsequently releases them
Why doesn’t the GC execute the object’s finalizer instead of deferring the work to an asynchronous thread? The motivation for doing so is closing the loop without the f-reachable queue or an additional finalizer thread, which would appear to be cheaper. However, the primary risk associated with running finalizers during GC is that finalizers (which are user-defined by their nature) can take a long time to complete, thus blocking the garbage collection process, which in turn blocks all application threads. Additionally, handling exceptions that occur in the middle of GC is not trivial, and handling memory allocations that the finalizer might trigger in the middle of GC is not trivial either. To conclude, because of reliability reasons the GC does not execute finalization code, but defers this processing to a special dedicated thread.
Pitfalls of Non-Deterministic Finalization
The finalization model just described carries a set of performance penalties. Some of them are insignificant, but others warrant reconsideration of whether finalization is applicable for your resources.
- Objects with finalizers are guaranteed to reach at least generation 1, which makes them more susceptible to the mid-life crisis phenomenon. This increases the chances of performing many full collections.
- Objects with finalizers are slightly more expensive to allocate because they are added to the finalization queue. This introduces contention in multi-processor scenarios. Generally speaking, this cost is negligible compared to the other issues.
- Pressure on the finalizer thread (many objects requiring finalization) might cause memory leaks. If the application threads are allocating objects at a higher rate than the finalizer thread is able to finalize them, then the application will steadily leak memory from objects waiting for finalization.
The following code shows an application thread that allocates objects at a higher rate than they can be finalized, because of blocking code executing in the finalizer. This causes a steady memory leak.
class File2 {
    public File2() {
     Thread.Sleep(10);
    }
    ∼File2() {
     Thread.Sleep(20);
    }
    //Data to leak:
    private byte[] data = new byte[1024];
}

class Program {
    static void Main(string[] args) {
     while (true) {
     File2 f = new File2();
     }
    }
}
EXPERIMENTING WITH A FINALIZATION-RELATED LEAK
In this experiment, you will run a sample application that exhibits a memory leak and perform partial diagnostics before consulting the source code. Without giving away the problem completely, the leak is related to improper use of finalization, and is similar in spirit to the code listing for the File2 class.
- Run the MemoryLeak.exe application from this chapter’s source code folder.
- Run Performance Monitor and monitor the following performance counters from the .NET CLR Memory category for this application (for more information on Performance Monitor and how to run it, consult Chapter 2): # Bytes in All Heaps, # Gen 0 Collections, # Gen 1 Collections, # Gen 2 Collections, % Time in GC, Allocated Bytes/sec, Finalization Survivors, Promoted Finalization-Memory from Gen 0.
- Monitor these counters for a couple of minutes until patterns emerge. For example, you should see the # Bytes in All Heaps counter gradually go up, although it sometimes drops slightly. Overall, the application’s memory usage is going up, indicating a likely memory leak.
- Note that application allocates memory at an average rate of 1MB/s. This is not a very high allocation rate, and indeed the fraction of time in GC is very low—this is not a case of the garbage collector struggling to keep up with the application.
- Finally, note that the Finalization Survivors counter, whenever it is updated, is quite high. This counter represents the number of objects that survived a recent garbage collection only because they are registered for finalization, and their finalizer has not yet run (in other words, these objects are rooted by the f-reachable queue). The Promoted Finalization-Memory from Gen 0 counter points toward a considerable amount of memory that is being retained by these objects.
Adding these pieces of information together, you can deduce that it is likely that the application is leaking memory because it puts insurmountable pressure on the finalizer thread. For example, it might be creating (and releasing) finalizable resources at a faster rate than the finalizer thread is able to clean them. You can now inspect the application’s source code (use .NET Reflector, ILSpy, or any other decompiler for this) and verify that the source of leak is related to finalization, specifically the Employee and Schedule classes.
Aside from performance issues, using automatic non-deterministic finalization is also the source of bugs which tend to be extremely difficult to find and resolve. These bugs occur because finalization is asynchronous by definition, and because the order of finalization between multiple objects is undefined.
Consider a finalizable object A that holds a reference to another finalizable object B. Because the order of finalization is undefined, A can’t assume that when its finalizer is called, B is valid for use—its finalizer might have executed already. For example, an instance of the System.IO.StreamWriter class can hold a reference to an instance of the System.IO.FileStream class. Both instances have finalizable resources: the stream writer contains a buffer that must be flushed to the underlying stream, and the file stream has a file handle that must be closed. If the stream writer is finalized first, it will flush the buffer to the valid underlying stream, and when the file stream is finalized it will close the file handle. However, because finalization order is undefined, the opposite scenario might occur: the file stream is finalized first and closes the file handle, and when the stream writer is finalized it flushes the buffer to an invalid file stream that was previously closed. This is an irresolvable issue, and the “solution” adopted by the .NET Framework is that StreamWriter does not define a finalizer, and relies on deterministic finalization only. If the client forgets to close the stream writer, its internal buffer is lost.
![]() Tip It is possible for resource pairs to define the finalization order among themselves if one of the resources derives from the System.Runtime.ConstrainedExecution.CriticalFinalizerObject abstract class, which defines its finalizer as a critical finalizer. This special base class guarantees that its finalizer will be called after all other non-critical finalizers have been called. It is used by resource pairs such as System.IO.FileStream with Microsoft.Win32.SafeHandles.SafeFileHandle and System.Threading.EventWaitHandle with Microsoft.Win32.SafeHandles.SafeWaitHandle.
Tip It is possible for resource pairs to define the finalization order among themselves if one of the resources derives from the System.Runtime.ConstrainedExecution.CriticalFinalizerObject abstract class, which defines its finalizer as a critical finalizer. This special base class guarantees that its finalizer will be called after all other non-critical finalizers have been called. It is used by resource pairs such as System.IO.FileStream with Microsoft.Win32.SafeHandles.SafeFileHandle and System.Threading.EventWaitHandle with Microsoft.Win32.SafeHandles.SafeWaitHandle.
Another problem has to do with the asynchronous nature of finalization which occurs in a dedicated thread. A finalizer might attempt to acquire a lock that is held by the application code, and the application might be waiting for finalization to complete by calling GC.WaitForPendingFinalizers(). The only way to resolve this issue is to acquire the lock with a timeout and fail gracefully if it can’t be acquired.
Yet another scenario is caused by the garbage collector’s eagerness to reclaim memory as soon as possible. Consider the following code which represents a naïve implementation of a File class with a finalizer that closes the file handle:
class File3 {
  Handle handle;
  public File3(string filename) {
    handle = new Handle(filename);
  }
  public byte[] Read(int bytes) {
    return Util.InternalRead(handle, bytes);
  }
  ∼File3() {
    handle.Close();
  }
}

class Program {
  static void Main() {
    File3 file = new File3("File.txt");
    byte[] data = file.Read(100);
    Console.WriteLine(Encoding.ASCII.GetString(data));
  }
}
This innocent piece of code can break in a very nasty manner. The Read method can take a long time to complete, and it only uses the handle contained within the object, and not the object itself. The rules for determining when a local variable is considered an active root dictate that the local variable held by the client is no longer relevant after the call to Read has been dispatched. Therefore, the object is considered eligible for garbage collection and its finalizer might execute before the Read method returns! If this happens, we might be closing the handle while it is being used, or just before it is used.
THE FINALIZER MIGHT NEVER BE CALLED
Even though finalization is normally considered a bullet-proof feature that guarantees resource deallocation, the CLR doesn’t actually provide a guarantee that a finalizer will be called under any possible set of circumstances.
One obvious scenario in which finalization will not occur is the case of a brutal process shutdown. If the user closes the process via Task Manager or an application calls the TerminateProcess Win32 API, finalizers do not get a chance to reclaim resources. Therefore, it is incorrect to blindly rely on finalizers for cleaning up resources that cross process boundaries (such as deleting files on disk or writing specific data to a database).
Less obvious is the case when the application encounters an out of memory condition and is on the verge of shutting down. Typically, we would expect finalizers to run even in the face of exceptions, but what if the finalizer for some class has never been called yet, and has to be JITted? The JIT requires a memory allocation to compile the finalizer, but there is no memory available. This can be addressed by using .NET pre-compilation (NGEN) or deriving from CriticalFinalizerObject which guarantees that the finalizer will be eagerly JITted when the type is loaded.
Finally, the CLR imposes time limitations on finalizers that run as part of process shutdown or AppDomain unload scenarios. In these cases (which can be detected through Environment.HasShutdownStarted or AppDomain.IsFinalizingForUnload()), each individual finalizer has (roughly) two seconds to complete its execution, and all finalizers combined have (roughly) 40 seconds to complete their execution. If these time limits are breached, finalizers might not execute. This scenario can be diagnosed at runtime using the BreakOnFinalizeTimeout registry value. See Sasha Goldshtein’s blog post, “Debugging Shutdown Finalization Timeout” (http://blog.sashag.net/archive/2008/08/27/debugging-shutdown-finalization-timeout.aspx, 2008) for more details.
We have reviewed multiple problems and limitations with the implementation of non-deterministic finalization. It is now appropriate to reconsider the alternative—deterministic finalization—which was mentioned earlier.
The primary problem with deterministic finalization is that the client is responsible for using the object properly. This contradicts the object-orientation paradigm, in which the object is responsible for its own state and invariants. This problem cannot be addressed to a full extent because automatic finalization is always non-deterministic. However, we can introduce a contractual mechanism that will strive to ensure that deterministic finalization occurs, and that will make it easier to use from the client side. In exceptional scenarios, we will have to provide automatic finalization, despite all the costs mentioned in the previous section.
The conventional contract established by the .NET Framework dictates that an object which requires deterministic finalization must implement the IDisposable interface, with a single Dispose method. This method should perform deterministic finalization to release unmanaged resources.
Clients of an object implementing the IDisposable interface are responsible for calling Dispose when they have finished using it. In C#, this can be accomplished with a using block, which wraps object usage in a try...finally block and calls Dispose within the finally block.
This contractual model is fair enough if we trust our clients completely. However, often we can’t trust our clients to call Dispose deterministically, and must provide a backup behavior to prevent a resource leak. This can be done using automatic finalization, but brings up a new problem: if the client calls Dispose and later the finalizer is invoked, we will release the resources twice. Additionally, the idea of implementing deterministic finalization was avoiding the pitfalls of automatic finalization!
What we need is a mechanism for instructing the garbage collector that the unmanaged resources have already been released and that automatic finalization is no longer required for a particular object. This can be done using the GC.SuppressFinalize method, which disables finalization by setting a bit in the object’s header word (see Chapter 3 for more details about the object header). The object still remains in the finalization queue, but most of the finalization cost is not incurred because the object’s memory is reclaimed immediately after the first collection, and it is never seen by the finalizer thread.
Finally, we might want a mechanism to alert our clients of the case when a finalizer was called, because it implies that they haven’t used the (significantly more efficient, predictable and reliable) deterministic finalization mechanism. This can be done using System.Diagnostics.Debug.Assert or a logging framework of some sort.
The following code is a rough draft of a class wrapping an unmanaged resource that follows these guidelines (there are more details to consider if the class were to derive from another class that also manages unmanaged resources):
class File3 : IDisposable {
  Handle handle;
  public File3(string filename) {
    handle = new Handle(filename);
  }
  public byte[] Read(int bytes) {
    Util.InternalRead(handle, bytes);
  }
  ∼File3() {
    Debug.Assert(false, "Do not rely on finalization! Use Dispose!");
    handle.Close();
  }
  public void Dispose() {
    handle.Close();
    GC.SuppressFinalize(this);
  }
}
![]() Note The finalization pattern described in this section is called the Dispose pattern, and covers additional areas such as the interaction between derived and base classes requiring finalization. For more information on the Dispose pattern, refer to the MSDN documentation. Incidentally, C++/CLI implements the Dispose pattern as part of its native syntax: !File is the C++/CLI finalizer and ∼ File is the C++/CLI IDisposable.Dispose implementation. The details of calling the base class and ensuring finalization is suppressed are taken care of automatically by the compiler.
Note The finalization pattern described in this section is called the Dispose pattern, and covers additional areas such as the interaction between derived and base classes requiring finalization. For more information on the Dispose pattern, refer to the MSDN documentation. Incidentally, C++/CLI implements the Dispose pattern as part of its native syntax: !File is the C++/CLI finalizer and ∼ File is the C++/CLI IDisposable.Dispose implementation. The details of calling the base class and ensuring finalization is suppressed are taken care of automatically by the compiler.
Ensuring that your implementation of the Dispose pattern is correct is not as difficult as ensuring that clients using your class will use deterministic finalization instead of automatic finalization. The assertion approach outlined earlier is a brute-force option that works. Alternatively, static code analysis can be used to detect improper use of disposable resources.
Finalization provides an opportunity for an object to execute arbitrary code after it is no longer referenced by the application. This opportunity can be used to create a new reference from the application to the object, reviving the object after it was already considered dead. This ability is called resurrection.
Resurrection is useful in a handful of scenarios, and should be used with great care. The primary risk is that other objects referenced by your object might have an invalid state, because their finalizers might have run already. This problem can’t be solved without reinitializing all objects referenced by your object. Another issue is that your object’s finalizer will not run again unless you use the obscure GC.ReRegisterForFinalize method, passing a reference to your object (typically this) as a parameter.
One of the applicable scenarios for using resurrection is object pooling. Object pooling implies that objects are allocated from a pool and returned to the pool when they are no longer used, instead of being garbage collected and recreated. Returning the object to the pool can be performed deterministically or delayed to finalization time, which is a classic scenario for using resurrection.
Weak references are a supplementary mechanism for handling references to managed objects. The typical object reference (also known as strong reference) is very deterministic: as long as you have a reference to the object, the object will stay alive. This is the correctness promise of the garbage collector.
However, in some scenarios, we would like to keep an invisible string attached to an object without interfering with the garbage collector’s ability to reclaim that object’s memory. If the GC reclaimed the memory, our string becomes unattached and we can detect this. If the GC hasn’t touched the object yet, we can pull the string and retrieve a strong reference to the object to use it again.
This facility is useful for various scenarios, of which the following are the most common:
- Providing an external service without keeping the object alive. Services such as timers and events can be provided to objects without keeping them referenced, which can solve many typical memory leaks.
- Automatically managing a cache or pool strategy. A cache can keep weak references to the least recently used objects without preventing them from being collected; a pool can be partitioned into a minimum size which contains strong references and an optional size which contains weak references.
- Keeping a large object alive with the hope that it will not be collected. The application can hold a weak reference to a large object that took a long time to create and initialize. The object might be collected, in which case the application will reinitialize it; otherwise, it can be used the next time it is needed.
Weak references are exposed to application code through the System.WeakReference class, which is a special case of the System.Runtime.InteropServices.GCHandle type. A weak reference has the IsAlive Boolean property which indicates whether the underlying object hasn’t been collected yet, and the Target property that can be used to retrieve the underlying object (if it has been collected, null is returned).
![]() Caution Note that the only safe way of obtaining a strong reference to the target of a weak reference is by using the Target property. If the IsAlive property returns true, it is possible that immediately afterwards the object will be collected. To defend against this race condition, you must use the Target property, assign the returned value to a strong reference (local variable, field etc.) and then check whether the returned value is null. Use the IsAlive property when you are interested only in the case that the object is dead; for example, to remove the weak reference from a cache.
Caution Note that the only safe way of obtaining a strong reference to the target of a weak reference is by using the Target property. If the IsAlive property returns true, it is possible that immediately afterwards the object will be collected. To defend against this race condition, you must use the Target property, assign the returned value to a strong reference (local variable, field etc.) and then check whether the returned value is null. Use the IsAlive property when you are interested only in the case that the object is dead; for example, to remove the weak reference from a cache.
The following code shows a draft implementation of an event based on weak references (see Figure 4-19). The event itself can’t use a .NET delegate directly, because a delegate has a strong reference to its target and this is not customizable. However, it can store the delegate’s target (as a weak reference) and its method. This prevents one of the most common .NET memory leaks—forgetting to unregister from an event!
public class Button {
  private class WeakDelegate {
    public WeakReference Target;
    public MethodInfo Method;
  }
  private List<WeakDelegate> clickSubscribers = new List<WeakDelegate>();

  public event EventHandler Click {
    add {
     clickSubscribers.Add(new WeakDelegate {
     Target = new WeakReference(value.Target),
     Method = value.Method
     });
    }
    remove {
     //...Implementation omitted for brevity
    }
  }
  public void FireClick() {
    List<WeakDelegate> toRemove = new List<WeakDelegate>();
    foreach (WeakDelegate subscriber in clickSubscribers) {
     object target = subscriber.Target.Target;
     if (target == null) {
     toRemove.Add(subscriber);
     } else {
     subscriber.Method.Invoke(target, new object[] { this, EventArgs.Empty });
     }
    }
    clickSubscribers.RemoveAll(toRemove);
  }
}
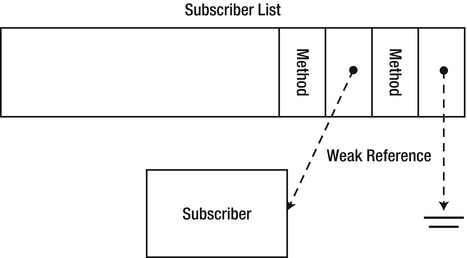
Figure 4-19 . The weak event has a weak reference to every subscriber. If the subscriber is unreachable by the application, the weak event can detect this because the weak reference is nulled out
Weak references do not track object resurrection by default. To enable resurrection tracking, use the overloaded constructor that accepts a Boolean parameter and pass true to indicate that resurrection should be tracked. Weak references that track resurrection are called long weak references; weak references that do not track resurrection are called short weak references.
Weak references are a special case of GC handles. A GC handle is a special low-level value type that can provide several facilities for referencing objects:
- Keeping a standard (strong) reference to an object, preventing it from being collected. This is represented by the GCHandleType.Normal enumeration value.
- Keeping a short weak reference to an object. This is represented by the GCHandleType.Weak enumeration value.
- Keeping a long weak reference to an object. This is represented by the GCHandleType.WeakTrackResurrection enumeration value.
- Keeping a reference to an object, pinning it so that it cannot move in memory and obtaining its address if necessary. This is represented by the GCHandleType.Pinned enumeration value.
There is rarely any need to use GC handles directly, but they often come up in profiling results as another type of root that can retain managed objects.
Interacting with the Garbage Collector
So far, we viewed our application as a passive participant in the GC story. We delved into the implementation of the garbage collector, and reviewed significant optimizations, all performed automatically and requiring little or no involvement from our part. In this section, we will examine the available means of active interaction with the garbage collector in order to tune the performance of our applications and receive diagnostic information that is unavailable otherwise.
The System.GC class is the primary point of interaction with the .NET garbage collector from managed code. It contains a set of methods that control the garbage collector’s behavior and obtain diagnostic information regarding its work so far.
Diagnostic Methods
The diagnostic methods of the System.GC class provide information on the garbage collector’s work. They are meant for use in diagnostic or debugging scenarios; do not rely on them to make decisions at normal run time. The information set returned by some of these diagnostic methods is available as performance counters, under the .NET CLR Memory performance category.
- The GC.CollectionCount method returns the number of garbage collections of the specified generation since application startup. It can be used to determine whether a collection of the specified generation occurred between two points in time.
- The GC.GetTotalMemory method returns the total memory consumed by the garbage collected heap, in bytes. If its Boolean parameter is true, a full garbage collection is performed before returning the result, to ensure that only memory that could not be reclaimed is accounted for.
- The GC.GetGeneration method returns the generation to which a specific object belongs. Note that under the current CLR implementation, objects are not guaranteed to be promoted between generations when a garbage collection occurs.
Notifications
Introduced in .NET 3.5 SP1, the GC notifications API provides applications an opportunity to learn in advance that a full garbage collection is imminent. The API is available only when using non-concurrent GC, and is aimed at applications that have long GC pause times and want to redistribute work or notify their execution environment when they sense a pause approaching.
First, an application interested in GC notifications calls the GC.RegisterForFullGCNotification method, and passes to it two thresholds (numbers between 1 and 99). These thresholds indicate how early the application wants the notification based on thresholds in generation 2 and the large object heap. In a nutshell, larger thresholds make sure that you receive a notification but the actual collection may be delayed for a while, whereas smaller thresholds risk not receiving a notification at all because the collection was too close to the notification trigger.
Next, the application uses the GC.WaitForFullGCApproach method to synchronously block until the notification occurs, makes all the preparations for GC, and then calls GC.WaitForFullGCComplete to synchronously block until the GC completes. Because these APIs are synchronous, you might want to call them on a background thread and raise events to your main processing code, like so:
public class GCWatcher {
  private Thread watcherThread;

  public event EventHandler GCApproaches;
  public event EventHandler GCComplete;

  public void Watch() {
    GC.RegisterForFullGCNotification(50, 50);
    watcherThread = new Thread(() => {
     while (true) {
     GCNotificationStatus status = GC.WaitForFullGCApproach();
     //Omitted error handling code here
     if (GCApproaches != null) {
     GCApproaches(this, EventArgs.Empty);
     }
     status = GC.WaitForFullGCComplete();
     //Omitted error handling code here
     if (GCComplete != null) {
     GCComplete(this, EventArgs.Empty);
     } }
    });
    watcherThread.IsBackground = true;
    watcherThread.Start();
  }

  public void Cancel() {
    GC.CancelFullGCNotification();
    watcherThread.Join();
  }
}
For more information and a complete example using the GC notifications API to redistribute server load, consult the MSDN documentation at http://msdn.microsoft.com/en-us/library/cc713687.aspx.
The GC.Collect method instructs the garbage collector to perform a garbage collection of the specified generation (including all younger generations). Starting with .NET 3.5 (and also available in .NET 2.0 SP1 and .NET 3.0 SP1), the GC.Collect method is overloaded with a parameter of the enumerated type GCCollectionMode. This enumeration has the following possible values:
- When using GCCollectionMode.Forced, the garbage collector performs the collection immediately and synchronously with the current thread. When the method returns, it is guaranteed that the garbage collection completed.
- When using GCCollectionMode.Optimized, the garbage collector can decide whether a collection will be productive at this point in time or not. The ultimate decision whether a collection will be performed is delayed to run time, and is not guaranteed by the implementation. This the recommended mode to use if you are trying to assist the garbage collector by providing hints as to when a collection might be beneficial. In diagnostic scenarios, or when you want to force a full garbage collection to reclaim specific objects that you are interested in, you should use GCCollectionMode.Forced instead.
- As of CLR 4.5, using GCCollectionMode.Default is equivalent to GCCollectionMode.Forced.
Forcing the garbage collector to perform a collection is not a common task. The optimizations described in this chapter are largely based on dynamic tuning and heuristics that have been thoroughly tested for various application scenarios. It is not recommended to force a garbage collection or even to recommend a garbage collection (using GCCollectionMode.Optimized) in non-exceptional circumstances. With that said, we can outline several scenarios that warrant the careful consideration of forcing a garbage collection:
- When an infrequent repeatable action that required a large amount of long-lived memory completes, this memory becomes eligible for garbage collection. If the application does not cause full garbage collections frequently, this memory might remain in generation 2 (or in the LOH) for a long time before being reclaimed. In this scenario, it makes sense to force a garbage collection when the memory is known to be unreferenced so that it does not occupy unnecessary space in the working set or in the page file.
- When using the low latency GC mode, it is advisable to force garbage collections at safe points when it is known that the time-sensitive work has idled and can afford pausing to perform a collection. Staying in low latency mode without performing a collection for a long period of time might result in out of memory conditions. Generally speaking, if the application is sensitive to garbage collection timing, it’s reasonable to force a collection during idle times to influence a biased redistribution of garbage collection overhead into the idle run time regions.
- When non-deterministic finalization is used to reclaim unmanaged resources, it is often desirable to block until all such resources have been reclaimed. This can be accomplished by following a GC.Collect call with a GC.WaitForPendingFinalizers call. Deterministic finalization is always preferred in these scenarios, but often we do not have control over the internal classes that actually perform the finalization work.
![]() Note As of .NET 4.5, the GC.Collect method has an additional overload with a trailing Boolean parameter: GC.Collect(int generation, GCCollectionMode mode, bool blocking). This parameter controls whether a blocking garbage collection is required (the default) or whether the request can be satisfied asynchronously by launching a background garbage collection.
Note As of .NET 4.5, the GC.Collect method has an additional overload with a trailing Boolean parameter: GC.Collect(int generation, GCCollectionMode mode, bool blocking). This parameter controls whether a blocking garbage collection is required (the default) or whether the request can be satisfied asynchronously by launching a background garbage collection.
The other control methods are the following:
- The GC.AddMemoryPressure and GC.RemoveMemoryPressure methods can be used to notify the garbage collector about unmanaged memory allocations taking place in the current process. Adding memory pressure indicates to the garbage collector that the specified amount of unmanaged memory has been allocated. The garbage collector may use this information for tuning the aggressiveness and frequency of garbage collections, or ignore it altogether. When the unmanaged allocation is known to be reclaimed, notify the garbage collector that the memory pressure can be removed.
- The GC.WaitForPendingFinalizers method blocks the current thread until all finalizers have finished executing. This method should be used with caution because it might introduce deadlocks; for example, if the main thread blocks inside GC.WaitForPendingFinalizers while holding some lock, and one of the active finalizers requires that same lock, a deadlock occurs. Because GC.WaitForPendingFinalizers does not accept a timeout parameter, the locking code inside the finalizer must use timeouts for graceful error handling.
- The GC.SuppressFinalize and GC.ReRegisterForFinalize methods are used in conjunction with finalization and resurrection features. They are discussed in the finalization section of this chapter.
- Starting with .NET 3.5 (and also available in .NET 2.0 SP1 and .NET 3.0 SP1), another interface to the garbage collector is provided by the GCSettings class that was discussed earlier, for controlling the GC flavor and switching to low latency GC mode.
For other methods and properties of the System.GC class that were not mentioned in this section, refer to the MSDN documentation.
Interacting with the GC using CLR Hosting
In the preceding section, we have examined the diagnostic and control methods available for interacting with the garbage collector from managed code. However, the degree of control offered by these methods leaves much to be desired; additionally, there is no notification mechanism available to let the application know that a garbage collection occurs.
These deficiencies cannot be addressed by managed code alone, and require CLR hosting to further control the interaction with the garbage collector. CLR hosting offers multiple mechanisms for controlling .NET memory management:
- The IHostMemoryManager interface and its associated IHostMalloc interface provide callbacks which the CLR uses to allocate virtual memory for GC segments, to receive a notification when memory is low, to perform non-GC memory allocations (e.g. for JITted code) and to estimate the available amount of memory. For example, this interface can be used to ensure that all CLR memory allocation requests are satisfied from physical memory that cannot be paged out to disk. This is the essence of the Non-Paged CLR Host open source project (http://nonpagedclrhost.codeplex.com/, 2008).
- The ICLRGCManager interface provides methods to control the garbage collector and obtain statistics regarding its operation. It can be used to initiate a garbage collection from the host code, to retrieve statistics (that are also available as performance counters under the .NET CLR Memory performance category) and to initialize GC startup limits including the GC segment size and the maximum size of generation 0.
- The IHostGCManager interface provides methods to receive a notification when a garbage collection is starting or ending, and when a thread is suspended so that a garbage collection can proceed.
Below is a small code extract from the Non-Paged CLR Host open source project, which shows how the CLR host customizes segment allocations requested by the CLR and makes sure any committed pages are locked into physical memory:
HRESULT __stdcall HostControl::VirtualAlloc(
  void* pAddress, SIZE_T dwSize, DWORD flAllocationType,
  DWORD flProtect, EMemoryCriticalLevel dwCriticalLevel, void** ppMem) {

  *ppMem = VirtualAlloc(pAddress, dwSize, flAllocationType, flProtect);
  if (*ppMem == NULL) {
    return E_OUTOFMEMORY;
  }
  if (flAllocationType & MEM_COMMIT) {
    VirtualLock(*ppMem, dwSize);
    return S_OK;
  }
}

HRESULT __stdcall HostControl::VirtualFree(
  LPVOID lpAddress, SIZE_T dwSize, DWORD dwFreeType) {

  VirtualUnlock(lpAddress, dwSize);
  if (FALSE == VirtualFree(lpAddress, dwSize, dwFreeType)) {
    return E_FAIL;
  }
  return S_OK;
}
For information about additional GC-related CLR hosting interfaces, including IGCHost, IGCHostControl and IGCThreadControl, refer to the MSDN documentation.
We have seen several reasons for the GC to fire, but never listed them all in one place. Below are the triggers used by the CLR to determine whether it’s necessary to perform a GC, listed in order of likelihood:
- Generation 0 fills. This happens all the time as the application allocates new objects in the small object heap.
- The large object heap reaches a threshold. This happens as the application allocates large objects.
- The application calls GC.Collect explicitly.
- The operating system reports that it is low on memory. The CLR uses the memory resource notification Win32 APIs to monitor system memory utilization and be a good citizen in case resources are running low for the entire system.
- An AppDomain is unloaded.
- The process (or the CLR) is shutting down. This is a degenerate garbage collection—nothing is considered a root, objects are not promoted, and the heap is not compacted. The primary reason for this collection is to run finalizers.
Garbage Collection Performance Best Practices
In this section, we will provide a summary of best practices for interacting with the .NET garbage collector. We will examine multiple scenarios which demonstrate aspects of these best practices, and point out pitfalls that must be avoided.
We reviewed the generational model as the enabler of two significant performance optimizations to the naïve GC model discussed previously. The generational heap partitions managed objects by their life expectancy, enabling the GC to frequently collect objects that are short-lived and have high collection likelihood. Additionally, the separate large object heap solves the problem of copying large objects around by employing a free list management strategy for reclaimed large memory blocks.
We can now summarize the best practices for interacting with the generational model, and then review a few examples.
- Temporary objects should be short-lived. The greatest risk is temporary objects that creep into generation 2, because this causes frequent full collections.
- Large objects should be long-lived or pooled. A LOH collection is equivalent to a full collection.
- References between generations should be kept to a minimum.
The following case studies represent the risks of the mid-life crisis phenomenon. In a monitoring UI application implemented by one of our customers, 20,000 log records were constantly displayed on the application’s main screen. Each individual record contained a severity level, a brief description message and additional (potentially large) contextual information. These 20,000 records were continuously replaced as new log records would flow into the system.
Because of the large amount of log records on display, most log records would survive two garbage collections and reach generation 2. However, the log records are not long-lived objects, and shortly afterwards they are replaced by new records which in turn creep into generation 2, exhibiting the mid-life crisis phenomenon. The net effect was that the application performed hundreds of full garbage collections per minute, spending nearly 50% of its time in GC code.
After an initial analysis phase, we had reached the conclusion that displaying 20,000 log records in the UI is unnecessary. We trimmed the display to show the 1,000 most recent records, and implemented pooling to reuse and reinitialize existing record objects instead of creating new ones. These measures minimized the memory footprint of the application, but, even more significantly, minimized the time in GC to 0.1%, with a full collection occurring only once in a few minutes.
Another example of mid-life crisis is a scenario encountered by one of our web servers. The web server system is partitioned to a set of front-end servers which receive web requests. These front-end servers use synchronous web service calls to a set of back-end servers in order to process the individual requests.
In the QA lab environment, the web service call between the front-end and back-end layers would return within several milliseconds. This caused the HTTP request to be dismissed shortly, so the request object and its associated object graph were truly short-lived.
In the production environment, the web service call would often take longer to execute, due to network conditions, back-end server load and other factors. The request still returned to the client within a fraction of a second, which was not worth optimizing because a human being cannot observe the difference. However, with many requests flowing into the system each second, the lifetime of each request object and its associated object graph was extended such that these objects survived multiple garbage collections and creep into generation 2.
It is important to observe that the server’s ability to process requests was not harmed by the fact requests lived slightly longer: the memory load was still acceptable and the clients didn’t feel a difference because the requests were still returned within a fraction of a second. However, the server’s ability to scale was significantly harmed, because the front-end application spent 70% of its time in GC code.
Resolving this scenario requires switching to asynchronous web service calls or releasing most objects associated with the request as eagerly as possible (before performing the synchronous service call). A combination of the two brought time in GC down to 3%, improving the site’s ability to scale by a factor of 3!
Finally, consider a design scenario for a simple 2D pixel-based graphics rendering system. In this kind of system, a drawing surface is a long-lived entity which constantly repaints itself by placing and replacing short-lived pixels of varying color and opacity.
If these pixels were represented by a reference type, then not only would we double or triple the memory footprint of the application; we would also create references between generations and create a gigantic object graph of all the pixels. The only practical approach is using value types to represent pixels, which can bring down the memory footprint by a factor of 2 or 3, and the time spent in GC by several orders of magnitude.
Pinning
We have previously discussed pinning as a correctness measure that must be employed to ensure that the address of a managed object can safely be passed to unmanaged code. Pinning an object keeps it in the same location in memory, thereby reducing the garbage collector’s inherent ability to defragment the heap by sweeping objects around.
With this in mind, we can summarize the best practices for using pinning in applications that require it.
- Pin objects for the shortest possible time. Pinning is cheap if no garbage collection occurs while the object is pinned. If calling unmanaged code that requires a pinned object for an indefinite amount of time (such as an asynchronous call), consider copying or unmanaged memory allocation instead of pinning a managed object.
- Pin a few large buffers instead of many small ones, even if it means you have to manage the small buffer sizes yourself. Large objects do not move in memory, thus minimizing the fragmentation cost of pinning.
- Pin and re-use old objects that have been allocated in the application’s startup path instead of allocating new buffers for pinning. Old objects rarely move, thus minimizing the fragmentation cost of pinning.
- Consider allocating unmanaged memory if the application relies heavily on pinning. Unmanaged memory can be directly manipulated by unmanaged code without pinning or incurring any garbage collection cost. Using unsafe code (C# pointers) it is possible to conveniently manipulate unmanaged memory blocks from managed code without copying the data to managed data structures. Allocating unmanaged memory from managed code is typically performed using the System.Runtime.InteropServices.Marshal class. (See Chapter 8 for more details.)
The spirit of the finalization section makes it quite clear that the automatic non-deterministic finalization feature provided by .NET leaves much to be desired. The best piece of advice with regard to finalization is to make it deterministic whenever possible, and delegate the exceptional cases to the non-deterministic finalizer.
The following practices summarize the proper way to address finalization in your application:
- Prefer deterministic finalization and implement IDisposable to ensure that clients know what to expect from your class. Use GC.SuppressFinalize within your Dispose implementation to ensure that the finalizer isn’t called if it isn’t necessary.
- Provide a finalizer and use Debug.Assert or a logging statement to ensure that clients are aware of the fact they didn’t use your class properly.
- When implementing a complex object, wrap the finalizable resource in a separate class (the System.Runtime.InteropServices.SafeHandle type is a canonical example). This will ensure that only this small type wrapping the unmanaged resource will survive an extra garbage collection, and the rest of your object can be destroyed when the object is no longer referenced.
Miscellaneous Tips and Best Practices
In this section, we will briefly examine assorted best practices and performance tips that do not belong to any other major section discussed in this chapter.
Value Types
When possible, prefer value types to reference types. We have examined the various traits of value types and reference types from a general perspective in Chapter 3. Additionally, value types have several characteristics that affect garbage collection cost in the application:
- Value types have the most negligible allocation cost when used as local stack variables. This allocation is associated with the extension of the stack frame, which is created whenever a method is entered.
- Value types used as local stack variables have no deallocation (garbage collection) cost—they are deallocated automatically when the method returns and its stack frame is destroyed.
- Value types embedded in reference types minimize the cost of both phases of garbage collections: if objects are larger, there are less objects to mark, and if objects are larger, the sweep phase copies more memory at each time, which reduces the overhead of copying many small objects around.
- Value types reduce the application’s memory footprint because they occupy less memory. Additionally, when embedded inside a reference type, they do not require a reference in order to access them, thereby eliminating the need to store an additional reference. Finally, value types embedded in reference types exhibit locality of access—if the object is paged in and hot in cache, its embedded value type fields are also likely to be paged in and hot in cache.
- Value types reduce references between generations, because fewer references are introduced into the object graph.
Reducing the size of the object graph directly affects the amount of work the garbage collector has to perform. A simple graph of large objects is faster to mark and sweep than a complex graph of many small objects. We have mentioned a specific scenario of this earlier.
Additionally, introducing fewer local variables of reference types reduces the size of the local root tables generated by the JIT, which improves compilation times and saves a small amount of memory.
Object pooling is a mechanism designed to manage memory and resources manually instead of relying on the facilities provided by the execution environment. When object pooling is in effect, allocating a new object means retrieving it from a pool of unused objects, and deallocating an object means returning it to the pool.
Pooling can provide a performance boost if the allocation and deallocation costs (not including initialization and uninitialization) are more expensive than managing the lifetime of the objects manually. For example, pooling large objects instead of allocating and freeing them using the garbage collector might provide a performance improvement, because freeing large objects that are frequently allocated requires a full garbage collection.
![]() Note Windows Communication Foundation (WCF) implements pooling of byte arrays used for storing and transmitting messages. The System.ServiceModel.Channels.BufferManager abstract class serves as the pool façade, providing the facilities for obtaining an array of bytes from the pool and for returning it to the pool. Two internal implementations of the abstract base operations provide a GC-based allocation and deallocation mechanism side-by-side with a mechanism which manages pool of buffers. The pooled implementation (as of the time of writing) manages multiple pools internally for varying sizes of buffers, and takes the allocating thread into account. A similar technique is used by the Windows Low-Fragmentation Heap, introduced in Windows XP.
Note Windows Communication Foundation (WCF) implements pooling of byte arrays used for storing and transmitting messages. The System.ServiceModel.Channels.BufferManager abstract class serves as the pool façade, providing the facilities for obtaining an array of bytes from the pool and for returning it to the pool. Two internal implementations of the abstract base operations provide a GC-based allocation and deallocation mechanism side-by-side with a mechanism which manages pool of buffers. The pooled implementation (as of the time of writing) manages multiple pools internally for varying sizes of buffers, and takes the allocating thread into account. A similar technique is used by the Windows Low-Fragmentation Heap, introduced in Windows XP.
Implementing an efficient pool requires taking at least the following factors into consideration:
- Synchronization around the allocation and deallocation operations must be kept to a minimum. For example, a lock-free (wait-free) data structure could be used to implement the pool (see Chapter 6 for a treatment of lock-free synchronization).
- The pool should not be allowed to grow indefinitely, implying that under certain circumstances objects will be returned to the mercy of the garbage collector.
- The pool should not be exhausted frequently, implying that a growth heuristic is needed to balance the pool size based on the frequency and amount of allocation requests.
Most pooling implementations will also benefit from implementing a least recently used (LRU) mechanism for retrieving objects from the pool, because the least recently used object is likely to be paged in and hot in CPU cache.
Implementing pooling in .NET requires hooking the allocation and deallocation requests for instances of the pooled type. There is no way to hook the allocation directly (the new operator cannot be overloaded), but an alternative API such as Pool.GetInstance can be used. Returning an object to the pool is best implemented using the Dispose pattern, with finalization as a backup.
An extremely simplified skeleton of a .NET pool implementation and a matching poolable object base is shown in the following code:
public class Pool<T> {
  private ConcurrentBag<T> pool = new ConcurrentBag<T>();
  private Func<T> objectFactory;

  public Pool(Func<T> factory) {
    objectFactory = factory;
  }
  public T GetInstance() {
    T result;
    if (!pool.TryTake(out result)) {
     result = objectFactory();
    }
    return result;
  }
  public void ReturnToPool(T instance) {
    pool.Add(instance);
  }
}

public class PoolableObjectBase<T> : IDisposable {
  private static Pool<T> pool = new Pool<T>();

  public void Dispose() {
    pool.ReturnToPool(this);
  }
  ∼PoolableObjectBase() {
    GC.ReRegisterForFinalize(this);
    pool.ReturnToPool(this);
  }
}

public class MyPoolableObjectExample : PoolableObjectBase<MyPoolableObjectExample> {
  ...
}
Paging and Allocating Unmanaged Memory
The .NET garbage collector automatically reclaims unused memory. Therefore, by definition, it cannot provide a perfect solution for every memory management need that may arise in real-world applications.
In previous sections, we examined numerous scenarios in which the garbage collector behaves poorly and must be tuned to provide adequate performance. An additional example that can bring the application down to its knees involves using the garbage collector where physical memory is insufficient to contain all objects.
Consider an application that runs on a machine with 8GB of physical memory (RAM). Such machines are soon to become extinct, but the scenario easily scales to any amount of physical memory, as long as the application is capable of addressing it (on a 64-bit system, this is a lot of memory). The application allocates 12GB of memory, of which at most 8GB will reside in the working set (physical memory) and at least 4GB will be paged out to disk. The Windows working set manager will ensure that pages containing objects frequently accessed by the application will remain in physical memory, and pages containing objects rarely accessed by the application will be paged out to disk.
During normal operation, the application might not exhibit paging at all because it very rarely accesses the paged-out objects. However, when a full garbage collection occurs, the GC must traverse every reachable object to construct the graph in the mark phase. Traversing every reachable object means performing 4GB of reads from disk to access them. Because physical memory is full, this also implies that 4GB of writes to disk must be performed to free physical memory for the paged-out objects. Finally, after the garbage collection completes, the application will attempt accessing its frequently used objects, which might have been paged out to disk, inducing additional page faults.
Typical hard drives, at the time of writing, provide transfer rates of approximately 150MB/s for sequential reads and writes (even fast solid-state drivers don’t exceed this by more than a factor of 2). Therefore, performing 8GB of transfers while paging in from and paging out to disk might take approximately 55 seconds. During this time, the application is waiting for the GC to complete (unless it is using concurrent GC); adding more processors (i.e. using server GC) would not help because the disk is the bottleneck. Other applications on the system will suffer a substantial decrease in performance because the physical disk will be saturated by paging requests.
The only way to address this scenario is by allocating unmanaged memory to store objects that are likely to be paged out to disk. Unmanaged memory is not subject to garbage collection, and will be accessed only when the application needs it.
Another example that has to do with controlling paging and working set management is locking pages into physical memory. Windows applications have a documented interface to the system requesting that specific regions of memory are not paged out to disk (disregarding exceptional circumstances). This mechanism can’t be used directly in conjunction with the .NET garbage collector, because a managed application does not have direct control over the virtual memory allocations performed by the CLR. However, a custom CLR host can lock pages into memory as part of the virtual memory allocation request arriving from the CLR.
Static Code Analysis (FxCop) Rules
Static code analysis (FxCop) for Visual Studio has a set of rules targeting common performance and correctness problems related to garbage collection. We recommend using these rules because they often catch bugs during the coding phase, which are cheapest to identify and fix. For more information on managed code analysis with or without Visual Studio, consult the MSDN online documentation.
The GC-related rules that shipped with Visual Studio 11 are:
- Design Rules—CA1001—Types that own disposable fields should be disposable. This rule ensures deterministic finalization of type members by their aggregating type.
- Design Rules—CA1049—Types that own native resources should be disposable. This rule ensures that types providing access to native resources (such as System.Runtime.InteropServices.HandleRef) implement the Dispose pattern correctly.
- Design Rules—CA1063—Implement IDisposable correctly. This rule ensures that the Dispose pattern is correctly implemented by disposable types.
- Performance Rules—CA1821—Remove empty finalizers. This rule ensures that types do not have empty finalizers, which degrade performance and effect mid-life crisis.
- Reliability Rules—CA2000—Dispose objects before losing scope. This rule ensures that all local variables of an IDisposable type are disposed before they disappear out of scope.
- Reliability Rules—CA2006—Use SafeHandle to encapsulate native resources. This rule ensures that when possible, the SafeHandle class or one of its derived classes is used instead of a direct handle (such as System.IntPtr) to an unmanaged resource.
- Usage Rules—CA1816—Call GC.SuppressFinalize correctly. This rule ensures that disposable types call suppress finalization within their finalizer, and do not suppress finalization for unrelated objects.
- Usage Rules—CA2213—Disposable fields should be disposed. This rule ensures that types implementing IDisposable should in turn call Dispose on all their fields that implement IDisposable.
- Usage Rules—CA2215—Dispose methods should call base class dispose. This rule ensures that the Dispose pattern is implemented correctly by invoking the base class’ Dispose method if it is also IDisposable.
- Usage Rules—CA2216—Disposable types should declare finalizer. This rule ensures that disposable types provide a finalizer as a backup for the scenario when the class user neglects to deterministically finalize the object.
Summary
Through the course of this chapter, we reviewed the motivation and implementation of the .NET garbage collector, the entity responsible for automatically reclaiming unused memory. We examined alternatives to tracing garbage collection, including reference counting garbage collection and manual free list management.
At the heart of the .NET garbage collector lie the following coordinating concepts, which we examined in detail:
- Roots provide the starting point for constructing a graph of all reachable objects.
- Mark is the stage at which the garbage collector constructs a graph of all reachable objects and marks them as used. The mark phase can be performed concurrently with application thread execution.
- Sweep is the stage at which the garbage collector shifts reachable objects around and updates references to these objects. The sweep phase requires stopping all application threads before proceeding.
- Pinning is a mechanism which locks an object in place so that the garbage collector can’t move it. Used in conjunction with unmanaged code requiring a pointer to a managed object, and can cause fragmentation.
- GC flavors provide static tuning for the behavior of the garbage collector in a specific application to better suit its memory allocation and deallocation patterns.
- The generational model describes the life expectancy of an object based on its current age. Younger objects are expected to die fast; old objects are expected to live longer.
- Generations are conceptual regions of memory that partition objects by their life expectancy. Generations facilitate frequently performing cheap partial collections with higher collection likelihood, and rarely performing full collections which are expensive and less efficient.
- Large object heap is an area of memory reserved for large objects. The LOH can become fragmented, but objects do not move around, thereby reducing the cost of the sweep phase.
- Segments are regions of virtual memory allocated by the CLR. Virtual memory can become fragmented because segment size is fixed.
- Finalization is a backup mechanism for automatically releasing unmanaged resources in a non-deterministic fashion. Prefer deterministic finalization to automatic finalization whenever possible, but offer clients both alternatives.
The common pitfalls associated with garbage collection are often related to the virtues of its most powerful optimizations:
- The generational model provides performance benefits for well-behaved applications, but can exhibit the mid-life crisis phenomenon which direly affects performance.
- Pinning is a necessity whenever managed objects are passed by reference to unmanaged code, but can introduce internal fragmentation into the GC heap, including the lower generations.
- Segments ensure that virtual memory is allocated in large chunks, but can exhibit external fragmentation of virtual memory space.
- Automatic finalization provides convenient disposal of unmanaged resources, but is associated with a high performance cost and often leads to mid-life crisis, high-pressure memory leaks and race conditions.
The following is a list of some of the best practices for getting the most of the .NET garbage collector:
- Allocate temporary objects so that they die fast, but keep old objects alive for the entire lifetime of your application.
- Pin large arrays at application initialization, and break them into small buffers as needed.
- Manage memory using pooling or unmanaged allocation where the GC fails.
- Implement deterministic finalization and rely on automatic finalization as a backup strategy only.
- Tune your application using GC flavors to find which one works best on various types of hardware and software configurations.
Some of the tools that can be used to diagnose memory-related issues and to examine the behavior of your application from the memory management perspective are the following:
- CLR Profiler can be used to diagnose internal fragmentation, determine the heavy memory allocation paths in an application, see which objects are reclaimed at each garbage collection and obtain general statistics on the size and age of retained objects.
- SOS.DLL can be used to diagnose memory leaks, analyze external and internal fragmentation, obtain garbage collection timing, list the objects in the managed heap, inspect the finalization queue and view the status of the GC threads and the finalizer thread.
- CLR performance counters can be used to obtain general statistics on garbage collection, including the size of each generation, the allocation rate, finalization information, pinned object count and more.
- CLR hosting can be used as a diagnostic utility to analyze segment allocations, garbage collection frequencies, threads causing garbage collections and non-GC related memory allocation requests originating at the CLR.
Armed by the theory of garbage collection, the subtleties of all related mechanisms, common pitfalls and best performance practices, and diagnostic tools and scenarios, you are now ready to begin the quest to optimize memory management in your applications and to design them with a proper memory management strategy.