
![]()
Web applications are designed to handle hundreds and even thousands of requests per second. To build such applications successfully, it is important to identify potential performance bottlenecks and to do everything you can to prevent them from occurring. But handling and preventing bottlenecks in ASP.NET applications is not confined to your code alone. From the time a web request reaches the server to the time it reaches your application’s code, it passes through an HTTP pipeline and then through the IIS pipeline, only to reach another pipeline, the ASP.NET’s pipeline, and only then does it reach your code. And when you finish handling the request, the response is sent down those pipelines until it is eventually received by the client’s machine. Every one of these pipelines is a potential bottleneck, so improving the performance of ASP.NET applications actually means improving both your code and the performance of the pipeline.
When discussing ways to improve the performance of ASP.NET applications, one has to look further than just the application itself, and examine the way various parts that make a web application affect its overall performance. The overall performance of a web application is comprised of the following:
- The application’s code
- The ASP.NET environment
- The hosting environment (in most cases, IIS)
- The network
- The client-side (not discussed in this book)
In this chapter we will briefly discuss tools for performance testing of web applications and explore various ways, from each of the above mentioned subjects, which can help us improve the overall performance of our web application. Toward the end of the chapter, we will discuss the need and implications of scaling web applications and how to avoid known pitfalls when scaling.
Testing the Performance of Web Applications
Before you start making changes to your web application, you need to know if your application is performing well or not—is it up to the requirements specified in the SLA (service level agreement)? Does it behave differently under load? Are there any general issues which can be improved? To know all this and more we need to use testing and monitoring tools that can help us identify pitfalls and bottlenecks in our web application.
In Chapter 2 we discussed some general-purpose analysis tools to detect performance issues in code, such as the Visual Studio and ANTS profilers, but there are additional tools that can assist you in testing, measuring, and investigating the “web” part of your application.
This is just a brief introduction to the world of web application performance testing. For a more thorough description and guidance on how to plan, execute, and analyze web application performance testing, you can refer to the “Performance Testing Guidance for Web Applications” MSDN article (http://msdn.microsoft.com/library/bb924375).
Visual Studio Web Performance Test and Load Test
Among the testing features that are available in Visual Studio Ultimate is the Web Performance test, which enables you to evaluate the response time and throughput of a web application. With the Web Performance test, you can record the HTTP requests and responses which are generated when browsing a web application, as shown in Figure 11-1. (This is supported directly in Internet Explorer only.)
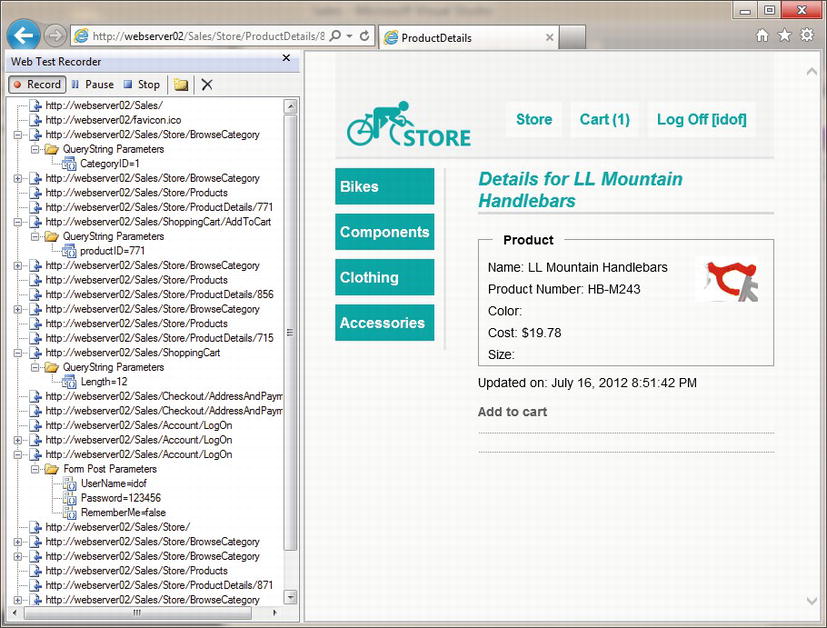
Figure 11-1 . Recording a web application with Web Test Recorder
Once a recording has taken place, you can use that recording to test the performance of the web application, as well as test its correctness, by matching the new responses with the previously recorded responses.
Web Performance tests allow you to customize the flow of the test. You can change the order of requests and add new requests of your own, insert loops and conditions to the flow, change the headers and content of requests, add validation rules for responses, and even customize the entire test flow by converting it to code and editing the generated code.
Using the Web Performance test on its own has its benefits, but in order to test the performance of your web application under stress, use the Web Performance test in conjunction with Visual Studio’s Load Test feature. This Visual Studio feature enables you to simulate loads on the system where multiple users are calling it concurrently, performing different operations on it, and to test how the system behaves during that time, by collecting various performance information such as performance counters and event logs.
![]() Caution It is advisable that you do not load test a public web site, only your own web sites and web applications. Load testing a public web site may be interpreted as a denial-of-service (DOS) attack, causing your machine or even your local network to be banned from accessing the web site.
Caution It is advisable that you do not load test a public web site, only your own web sites and web applications. Load testing a public web site may be interpreted as a denial-of-service (DOS) attack, causing your machine or even your local network to be banned from accessing the web site.
Combining Load Test with the recordings of the Web Performance test, we can simulate dozens and even hundreds of users, concurrently accessing our web application, simulating calls to various pages with different parameters in each request.
To properly simulate hundreds of users, it is advisable that you use test agents. Test agents are machines that receive testing instructions from a controller machine, perform the required tests, and send the results back to the controller. The use of test agents helps in reducing the stress on the testing machine (not the machine being tested), because a single machine simulating hundreds of users may suffer from performance degradation, causing the test to produce faulty results.
During load test we can monitor various performance counters that can point out how our application behaves under stress, for example by checking if requests are queued in ASP.NET, if the duration of a request is increasing over time, and if requests are getting timed out because of faulty configuration.
By running load tests with various scenarios, such as different number of concurrent users or different types of networks (slow/fast), we can learn a lot on how our web application works under stress, and from the recorded data derive conclusions on ways we can improve its overall performance.
Network monitoring tools that can sniff HTTP communication, such as Wireshark, NetMon, HTTP Analyzer, and Fiddler, can assist us in identifying issues with the HTTP requests and responses send to and from our web application. With the help of monitoring tools, we can verify various issues which can affect the performance of our web application. For example:
- Properly using the browser’s cache. By looking at the HTTP traffic, we can identify which responses are returned without caching headers, and whether requests are sent with the proper “match” headers when the requested content has already been cached.
- Number and size of messages. Monitoring tools show each request and response, the time it took for each message to be received, and the size of each message, allowing you to track down requests that are sent too often, large requests and responses, and requests that are taking too long to process.
- Applying compression. By viewing the requests and responses, you can verify that requests are being sent with the Accept-Encoding header to enable GZip compression, and that your web server returns a compressed response accordingly.
- Synchronized communication. Some HTTP monitoring tools can show a timeline of the requests and which process generated which request, so we can verify whether our client application is able to send multiple requests at once, or are requests being synchronized due to lack of outgoing connections. For example, you can use this feature to detect how many concurrent connections a browser can open to a specific server, or check if your .NET client application is using the default two connections restriction enforced by System.Net.ServicePointManager.
Some tools, such as Fiddler, can also export the recorded traffic as a Visual Studio Web Performance test, so you can use Web Test and Load Test to test web applications that are called from client applications and browsers other than Internet Explorer. For example, you can monitor HTTP-based WCF calls from a .NET client application, export them as a Web Test, and use the Load Test to stress test your WCF service.
Another set of tools that can be used to identify issues with web applications are web analysis tools, such as Yahoo!’s YSlow and Google’s Page Speed. Web analyzing tools do more than just analyze the traffic itself, looking for missing caching headers and non-compressed responses. They analyze the HTML page itself to detect problems that can affect the performance of loading and rendering pages, such as:
- Large HTML structures that can affect the rendering time.
- HTML, CSS, and JavaScript content that can be shrunk in size by using minifications techniques.
- Large images that can be scaled down to reduce their size and match their dimensions in the HTML page.
- JavaScript code that can be executed after the page is loaded instead of during, to allow pages to load faster.
Improving Web Performance on the Server
There are many ways to improve the performance of code in ASP.NET applications. Some improvements can be made using techniques that are valid for both ASP.NET applications and desktop applications, such as using threads or Tasks for non-dependent asynchronous operations, but there are also some improvements that relate to the way you write your ASP.NET code, whether it is a WebForm’s code-behind, or an ASP.NET MVC Controller. These changes, however small, can help utilize your server better, allowing the application to run faster, and handle more concurrent requests.
The processing of a request in a web application often requires the use of fetched data, usually from a remote location such as a database, or a web service. These data lookups are expensive operations, often causing latency in response time. Instead of fetching the data for each operation, that data can be pre-fetched once, and stored in-memory, in some sort of a caching mechanism. New requests that will come in after the data was fetched can use the cached data instead of fetching it again from its original source. The caching paradigm is often described as:
- If the data is already cached, use it.
- Else:
- a. Fetch the data.
- b. Store it in the cache.
- c. Use it.
![]() Caution Since several requests can access the same cached object at any given time, causing the same object be referenced from multiple threads, it is expected that an update to a cached object will be done responsibly, whether by treating it as immutable (changes to a cached object will require cloning it, making the changes on the new copy, and then updating the cache with the cloned object), or by using locking mechanisms to make sure it is not being updated by other threads.
Caution Since several requests can access the same cached object at any given time, causing the same object be referenced from multiple threads, it is expected that an update to a cached object will be done responsibly, whether by treating it as immutable (changes to a cached object will require cloning it, making the changes on the new copy, and then updating the cache with the cloned object), or by using locking mechanisms to make sure it is not being updated by other threads.
Many developers use ASP.NET’s Application state collection as a sort of caching mechanism, because it provides an in-memory caching store, accessible for all users and sessions. Using the Application collection is quite simple:
Application["listOfCountries"] = countries; // Store a value in the collection
countries = (IEnumerable < string>)Application["listOfCountries"]; // Get the value back
When using the Application collection, the resources which are stored in memory and accumulated over time can eventually fill the server memory, causing the ASP.NET application to start using paged memory from disk, or even fail due to lack of memory. Therefore, ASP.NET provides a special caching mechanism, which provides some sort of management over cached items, freeing unused items when memory is lacking.
ASP.NET caching, accessible through the Cache class, provides an extensive caching mechanism, which in addition to storing resources also allows you to:
- Define an expiration for a cached object, either by specified a TimeSpan or a fixed DateTime. Once the allotted life time of the cached object expires, the object will automatically be removed from the cache.
- Define priority for cached objects. When there is a memory lack and objects need to be freed, the priority can assist the cache mechanism to decide which objects are less “important.”
- Define validity for a cached object by adding dependencies, such as an SQL dependency. For example, if the cached object is a result of an SQL query, an SQL dependency can be set, so changes in the database that affects the results returned from the query will invalidate the cached object.
- Attach callbacks to cached objects, so when an object is being removed from the cache, the callback is invoked. Using callbacks can assist in retrieving updated resource information when expiration or invalidation occurs in the cache.
Adding items to the cache is as simple as adding items to a dictionary:
Cache["listOfCountries"] = listOfCountries;
When adding an item to the cache using the above code, the cached item will have the default priority of Normal and will not use any expiration or dependency checks. For example, to add an item to the cache with a sliding expiration, use the Insert method:
Cache.Insert("products", productsList,
  Cache.NoAbsoluteExpiration, TimeSpan.FromMinutes(60), dependencies: null);
![]() Note The Cache class also provides the Add method. Unlike the Insert method, the Add method will throw an exception if the cache already contains an item with the same key parameter.
Note The Cache class also provides the Add method. Unlike the Insert method, the Add method will throw an exception if the cache already contains an item with the same key parameter.
The cache access paradigm, using ASP.NET’s Cache class is usually implemented as follows:
object retrievedObject = null;

retrievedObject = Cache["theKey"];
if (retrievedObject == null) {
  //Lookup the data somewhere (database, web service, etc.)
  object originalData = null;
  . . .
  //Store the newly retrieved data in the cache
  Cache["theKey"] = originalData;
  retrievedObject = originalData;
}
//Use the retrieved object (either from the cache or the one that was just cached)
. . .
You’ll notice that the first line of code attempts to retrieve the object from the cache, without first checking whether it exists in the cache. This is because objects can be removed from the cache at any time by other requests or by the cache mechanism itself, so an item can be removed from the cache between checking and retrieval.
Using Asynchronous Pages, Modules, and Controllers
When IIS passes a request to ASP.NET, the request is queued to the thread pool, and a worker thread is assigned to handle the request whether it is a request for a simple HTTP handler, a page within an ASP.NET WebForm application, or a controller within an ASP.NET MVC application.
Since the number of worker threads in the thread pool is limited (defined by the value set for processModel ![]() maxWorkerThreads section in the web.config), then that implies ASP.NET is also limited by the number of threads, or requests, it can execute simultaneously.
maxWorkerThreads section in the web.config), then that implies ASP.NET is also limited by the number of threads, or requests, it can execute simultaneously.
The thread limit is usually high enough to support small-to-medium web applications that need to handle only several dozens of concurrent requests. However, if your web application is required to handle hundreds of requests concurrently, you should keep reading this section.
The limit on the number of concurrently executing requests encourages developers to try to minimize the execution time of requests, but what happens when the execution of a request depends on some other I/O operation, such as calling a web service, or waiting for a database operation to complete? In this case the execution time of the requests is highly dependent on the time it takes to get the information back from the remote process, and during that time the worker thread attached to the request is occupied and cannot be freed for another request.
Eventually, when the number of currently executing requests exceeds the limit of the thread pool, new requests will be placed in a special waiting queue. When the number of queued requests exceeds the limit of the queue, incoming requests will fail, returning an HTTP 503 response (“service unavailable”).
![]() Note The limitation of the thread pool and requests queue is defined for ASP.NET applications in the processModel section of the web.config file, and is controlled partially by the processModel
Note The limitation of the thread pool and requests queue is defined for ASP.NET applications in the processModel section of the web.config file, and is controlled partially by the processModel ![]() autoConfig attribute.
autoConfig attribute.
In modern web applications, where I/O operations are an inevitable part of our system’s design (calling web services, querying databases, reading from network file storages, etc.), this behavior often leads to having many running threads waiting on I/O and only several threads actually performing CPU consuming tasks. This often leads to a low utilization of the server’s CPU, which cannot be used by other requests since there are no more free threads for the incoming requests.
In web applications where many requests start by fetching data from web services or databases, it is common to see low CPU utilization even with high user load. You can use performance counters to check the CPU utilization of your web application, by checking the Processor\% CPU Utilization counter in conjunction with the ASP.NET ApplicationsRequests/Sec and ASP.NETRequests Queued counters.
If some of your requests are executing lengthy I/O operations, then there is no need to hold the worker thread until completion. With ASP.NET you can write asynchronous pages, controllers, handlers, and modules, which enable you to return worker threads back to the thread pool while your code is waiting for an I/O operation to complete, and once completed, to grab a worker thread from the pool to complete the execution of the request. From the end-user’s point of view, the page will still seem to take some time to load, since the server is holding the request until the processing is complete and the response is ready to be sent back.
By changing I/O-bound requests to use asynchronous processing instead of synchronous processing, you can increase the number of worker threads available for CPU-intensive requests, enabling your server to better utilize its CPU(s) and prevent requests from being queued.
If you have an ASP.NET Web Forms application, and you wish to create an async page, first you will need to mark the page as async:
<%@ Page Async = "true" . . .
Once marked as async, create a new PageAsyncTask object and pass it the delegates for the begin, end, and timeout methods. After creating the PageAsyncTask object, call the Page.RegisterAsyncTask method to start the asynchronous operation.
The following code shows how to start a lengthy SQL query using the PageAsyncTask:
public partial class MyAsyncPage : System.Web.UI.Page {
  private SqlConnection _sqlConnection;
  private SqlCommand _sqlCommand;
  private SqlDataReader _sqlReader;

  IAsyncResult BeginAsyncOp(object sender, EventArgs e, AsyncCallback cb, object state) {
  //This part of the code will execute in the original worker thread,
  //so do not perform any lengthy operations in this method
  _sqlCommand = CreateSqlCommand(_sqlConnection);
  return _sqlCommand.BeginExecuteReader(cb, state);
  }
  void EndAsyncOp(IAsyncResult asyncResult) {
  _sqlReader = _sqlCommand.EndExecuteReader(asyncResult);
  //Read the data and build the page’s content
  . . .
  }
 void TimeoutAsyncOp(IAsyncResult asyncResult) {
  _sqlReader = _sqlCommand.EndExecuteReader(asyncResult);
  //Read the data and build the page’s content
  . . .
  }

  public override void Dispose() {
  if (_sqlConnection ! = null) {
  _sqlConnection.Close();
  }
  base.Dispose();
  }
  protected void btnClick_Click(object sender, EventArgs e) {
  PageAsyncTask task = new PageAsyncTask(
  new BeginEventHandler(BeginAsyncOp),
  new EndEventHandler(EndAsyncOp),
  new EndEventHandler(TimeoutAsyncOp),
  state:null);
  RegisterAsyncTask(task);
  }
}
Another way of creating async pages is by using completion events, such as the ones created when using web services or WCF services-generated proxies:
public partial class MyAsyncPage2 : System.Web.UI.Page {
  protected void btnGetData_Click(object sender, EventArgs e) {
  Services.MyService serviceProxy = new Services.MyService();
  //Attach to the service’s xxCompleted event
  serviceProxy.GetDataCompleted + = new
  Services.GetDataCompletedEventHandler(GetData_Completed);
  //Use the Async service call which executes on an I/O thread
  serviceProxy.GetDataAsync();
  }
  void GetData_Completed (object sender, Services. GetDataCompletedEventArgs e) {
  //Extract the result from the event args and build the page’s content
  }
}
In the above example the page is also marked as Async, as the first example, but there is no need to create the PageAsyncTask object, since the page automatically receives notification when the xxAsync method is called, and after the xxCompleted event is fired.
![]() Note When setting the page to async, ASP.NET changes the page to implement the IHttpAsyncHandler instead of the synchronous IHttpHandler. If you wish to create your own asynchronous generic HTTP handler, create a generic HTTP handler class which implements the IHttpAsyncHandler interface.
Note When setting the page to async, ASP.NET changes the page to implement the IHttpAsyncHandler instead of the synchronous IHttpHandler. If you wish to create your own asynchronous generic HTTP handler, create a generic HTTP handler class which implements the IHttpAsyncHandler interface.
Creating an Asynchronous Controller
Controller classes in ASP.NET MVC can also be created as asynchronous controllers, if they perform lengthy I/O operations. To create an asynchronous controller you will need to perform these steps:
- Create a controller class that inherits from the AsyncController type.
- Implement a set of action methods for each async operation according to the following convention, where xx is the name of the action: xxAsync and xxCompleted.
- In the xxAsync method, call the AsyncManager.OutstandingOperations.Increment method with the number of asynchronous operations you are about to perform.
- In the code which executes during the return of the async operation, call the AsyncManager.OutstandingOperations.Decrement method to notify the operation has completed.
For example, the following code shows a controller with an asynchronous action named Index, which calls a service that returns the data for the view:
public class MyController : AsyncController {
  public void IndexAsync() {
  //Notify the AsyncManager there is going to be only one Async operation
  AsyncManager.OutstandingOperations.Increment();
  MyService serviceProxy = new MyService();
  //Register to the completed event
  serviceProxy.GetDataCompleted + = (sender, e) = > {
  AsyncManager.Parameters["result"] = e.Value;
  AsyncManager.OutstandingOperations.Decrement();
  };
  serviceProxy.GetHeadlinesAsync();
  }
  public ActionResult IndexCompleted(MyData result) {
  return View("Index", new MyViewModel { TheData = result });
  }
}
Tweaking the ASP.NET Environment
In addition to our code, every incoming request and outgoing response has to go through ASP.NET’s components. Some of ASP.NET’s mechanisms were created to serve the developer’s needs, such as the ViewState mechanism, but can affect the overall performance of our application. When fine-tuning ASP.NET applications for performance, it is advisable to change the default behavior of some of these mechanisms, although changing them may sometimes require changing the way your application code is constructed.
Turn Off ASP.NET Tracing and Debugging
ASP.NET Tracing enables developers to view diagnostic information for requested pages, such as execution time and path, session state, and HTTP headers list.
Although tracing is a great feature and provides added value when developing and debugging ASP.NET applications, it has some effects on the overall performance of the application, due to the tracing mechanism and the collection of data which is performed on each request. Therefore, if you have enabled tracing during development, turn it off before deploying your web application to the production environment, by changing the trace settings in the web.config:
<configuration>
  <system.web>
  <trace enabled = "false"/>
  </system.web>
</configuration>
![]() Note The default value of trace, if not specified otherwise in the web.config, is disabled (enabled = "false"), so removing the trace settings from the web.config file will also disable it.
Note The default value of trace, if not specified otherwise in the web.config, is disabled (enabled = "false"), so removing the trace settings from the web.config file will also disable it.
When creating new ASP.NET web applications, one of the things automatically added to the application’s web.config file is the system.web ![]() compilation configuration section with the debug attribute set to true:
compilation configuration section with the debug attribute set to true:
<configuration>
  <system.web>
  <compilation debug = "true" targetFramework = "4.5" />
  </system.web>
</configuration>
![]() Note This is the default behavior when creating ASP.NET web applications in Visual Studio 2012 or 2010. In prior versions of Visual Studio the default behavior was to set the debug setting to false, and when the developer first tried to debug the application, a dialog appeared asking permission to change the setting to true.
Note This is the default behavior when creating ASP.NET web applications in Visual Studio 2012 or 2010. In prior versions of Visual Studio the default behavior was to set the debug setting to false, and when the developer first tried to debug the application, a dialog appeared asking permission to change the setting to true.
The issue with this setting is that developers often neglect to change the setting from true to false when they deploy the application to production, or even do it intentionally to get more detailed exception information. In fact, keeping this setting can lead to several performance problems:
- Scripts that are downloaded using the WebResources.axd handler, for example when using validation controls in pages, will not be cached by the browser. When setting the debug flag to false, responses from this handler will be returned with caching headers, allowing browsers to cache the response for future visits.
- Requests will not timeout when debug is set to true. Although this is very convenient when debugging the code, this behavior is less desired in production environments when such requests can lead to the server not being able to handle other incoming requests, or even cause extensive CPU usage, increased memory consumption and other resource allocation issues.
- Setting the debug flag to false will enable ASP.NET to define timeouts for requests according to the httpRuntime
 executionTimeout configuration settings (the default value is 110 seconds).
 - JIT optimizations will not be applied to the code when running with debug = true. JIT optimizations are one of the most important advantages of .NET and can efficiently improve the performance of your ASP.NET application without requiring you changing your code. Setting debug to false will allow the JIT compiler to perform its deeds, making your application perform faster and more efficient.
- The compilation process does not use batch compilations when using debug = true. Without batch compilation an assembly will be created for each page and user control, causing the web application to load dozens and even hundreds of assemblies during runtime; loading that many assemblies may cause future memory exceptions due to fragmented address space. When the debug mode is set to false, batch compilation is used, generating a single assembly for the user controls, and several assemblies for the pages (pages are grouped to assemblies according to their use of user controls).
Changing this setting is very easy: either remove the debug attribute entirely from the configuration, or set it to false:
<configuration>
  <system.web>
  <compilation debug = "false" targetFramework = "4.5" />
  </system.web>
</configuration>
In case you fear forgetting to change this setting when deploying applications to production servers, you can force all ASP.NET applications in a server to ignore the debug setting by adding the following configuration in the server’s machine.config file:
<configuration>
  <system.web>
  <deployment retail = "true"/>
  </system.web>
</configuration>
View state is the technique used in ASP.NET Web Forms applications to persist a page’s state into the rendered HTML output (ASP.NET MVC applications do not use this mechanism). View state is used to allow ASP.NET to keep the state of a page between postbacks performed by the user. The view state data is stored in the HTML output by serializing the state, encrypting it (not set by default), encoding it to a Base64 string, and storing it in a hidden field. When the user posts back the page, the content is decoded, and then deserialized back to the view state dictionary. Many server controls use the view state to persist their own state, for example storing their property values in the view state.
Although very useful and powerful, this mechanism generates a payload that, when placed in the page as a Base64 string, can increase the size of the response by a magnitude. For example, a page containing a single GridView with paging, bounded to a list of 800 customers, will generate an output HTML 17 KB in size, out of which 6 KB is the view state field—this is because GridView controls store their data source in the view state. In addition, using view state requires serializing and deserializing the view state on each request, which adds additional overhead to the processing of the page.
![]() Tip The payload created by using view state is usually not noticeable by clients that access a web server in their own local area network. This is because LANs are usually very fast and able to transfer very large pages in a matter of milliseconds (an optimal 1Gb LAN can reach a throughput of ∼40–100 MB/s, depending on hardware). However, the payload of the view state is most notable when using slow wide area networks, such as the Internet.
Tip The payload created by using view state is usually not noticeable by clients that access a web server in their own local area network. This is because LANs are usually very fast and able to transfer very large pages in a matter of milliseconds (an optimal 1Gb LAN can reach a throughput of ∼40–100 MB/s, depending on hardware). However, the payload of the view state is most notable when using slow wide area networks, such as the Internet.
If you do not require the use of the view state, it is advisable to disable it. View state can be disabled for the entire application by disabling it in the web.config file:
<system.web>
  <pages enableViewState = "false"/>
</system.web>
If you don’t wish to disable view state for the entire application, it can also be disabled for a single page and all of its controls:
<%@ PageEnableViewState = "false". . . %>
You can also disable view state per control:
<asp:GridView ID = "gdvCustomers" runat = "server" DataSourceID = "mySqlDataSource"
  AllowPaging = "True"EnableViewState = "false"/>
Prior to ASP.NET 4, disabling the view state in the page made it impossible to re-enable it for specific controls in the page. As of ASP.NET 4, a new approach was added to allow disabling view state on a page, but re-enabling it for specific controls. This is achieved in ASP.NET 4 by using the ViewStateMode property. For example, the following code disables the view state for the entire page, excluding the GridView control:
<%@ Page EnableViewState = "true"ViewStateMode = "Disabled". . . %>

<asp:GridView ID = "gdvCustomers" runat = "server" DataSourceID = "mySqlDataSource"
  AllowPaging = "True"ViewStateMode = "Enabled"/>
![]() Caution Disabling the view state by setting the EnableViewState to false will override any setting done to the ViewStateMode. Therefore, if you wish to use the ViewStateMode, make sure EnableViewState is set to true or omitted (the default value is true).
Caution Disabling the view state by setting the EnableViewState to false will override any setting done to the ViewStateMode. Therefore, if you wish to use the ViewStateMode, make sure EnableViewState is set to true or omitted (the default value is true).
Although ASP.NET pages are considered dynamic in content, you often end up in scenarios where the dynamic content of a page does not necessarily change over time. For example, a page can receive the ID of a product and return an HTML content describing that product. The page itself is dynamic, because it can return different HTML content for different products, but the product page for a specific product does not change that often, at least not until the product details themselves change in the database.
Continuing our product example, to prevent our page from requerying the database every time a product is requested, we may want to cache that product information in a local cache so we can access it faster, but still we will need to render the HTML page every time. Instead of caching the data we need, ASP.NET offers a different caching mechanism, the ASP.NET Output Cache, which caches the outputted HTML itself.
By using output cache, ASP.NET can cache the rendered HTML so subsequent requests will automatically receive the rendered HTML without needing to execute our page’s code. Output cache is supported in ASP.NET Web Forms for caching pages, as well as in ASP.NET MVC for caching controller actions.
For example, the following code uses output cache to cache the view returned by an ASP.NET MVC controller’s action for 30 seconds:
public class ProductController : Controller {
  [OutputCache(Duration = 30)]
  public ActionResult Index() {
  return View();
  }
}
If the index action in the above example received an ID parameter and returned a view displaying specific product information, we would need to cache several versions of the output, according to the different IDs the action receives. Output cache, therefore, supports not just a single caching of the output, but also supports caching different outputs of the same action according to the parameters passed to that action. The following code shows how to alter the action to cache outputs according to an ID parameter passed to the method:
public class ProductController : Controller {
  [OutputCache(Duration = 30, VaryByParam = "id")]
  public ActionResult Index(int id) {
  //Retrieve the matching product and set the model accordingly . . .
  return View();
  }
}
![]() Note In addition to varying by query string parameters, output cache can also vary the cached output by the request’s HTTP headers, such as the Accept-Encoding and Accept-Language header. For example, if your action returns content in different languages according to the Accept-Language HTTP header, you can set the output cache to vary by that header, creating a different cached version of the output for each requested language.
Note In addition to varying by query string parameters, output cache can also vary the cached output by the request’s HTTP headers, such as the Accept-Encoding and Accept-Language header. For example, if your action returns content in different languages according to the Accept-Language HTTP header, you can set the output cache to vary by that header, creating a different cached version of the output for each requested language.
If you have the same caching settings for different pages or actions, you can create a caching profile, and use that profile instead of repeating the caching settings over and over again. Caching profiles are created in the web.config, under the system.web ![]() caching section. For example, the following configuration declares a caching profile which we want to use in several pages:
caching section. For example, the following configuration declares a caching profile which we want to use in several pages:
<system.web>
  <caching>
    <outputCacheSettings>
      <outputCacheProfiles>
         <add name = "CacheFor30Seconds" duration = "30" varyByParam = "id"/>
      </outputCacheProfiles>
    </outputCacheSettings>
  </caching>
</system.web>
Now the profile can be used for our Index action, instead of repeating the duration and parameter:
public class ProductController : Controller {
  [OutputCache(CacheProfile = "CacheFor30Seconds")]
  public ActionResult Index(int id) {
  //Retrieve the matching product and set the model
  . . .
  return View();
  }
}
We can also use the same caching profile in an ASP.NET web form, by using the OutputCache directive:
<%@ OutputCache CacheProfile = "CacheEntityFor30Seconds" %>
![]() Note By default, the ASP.NET output cache mechanism keeps the cached content in the server’s memory. As of ASP.NET 4, you can create your own output cache provider to be used instead of the default one. For example, you can write your own custom provider which stores the output cache to disk.
Note By default, the ASP.NET output cache mechanism keeps the cached content in the server’s memory. As of ASP.NET 4, you can create your own output cache provider to be used instead of the default one. For example, you can write your own custom provider which stores the output cache to disk.
Pre-Compiling ASP.NET Applications
When compiling an ASP.NET Web application project, a single assembly is created to hold all application’s code. However, web pages (.aspx) and user controls (.ascx) are not compiled, and deployed as-is to the server. The first time the web application starts (upon first request), ASP.NET dynamically compiles the web pages and user controls, and places the compiled files in the ASP.NET Temporary Files folder. This dynamic compilation increases the response time of first requests, causing users to experience a slow-loading web site.
To resolve this issue, web applications can be pre-compiled, including all code, pages, and user controls, by using the ASP.NET compilation tool (Aspnet_compiler.exe). Running the ASP.NET compilation tool in production servers can reduce the delay users experience on first requests. To run the tool, follow these steps:
- Open a command prompt in your production server.
- Navigate to the %windir%Microsoft.NET folder
- Navigate to either the Framework or Framework64 folder, according to the whether the web application’s application pool is configured to support 32-bit applications or not (for 32-bit operating systems, the Framework folder is the only option).
- Navigate to the framework version’s folder, according to the .NET framework version used by the application pool (v2.0.50727 or v4.0.30319).
- Enter the following command to start the compilation (replace WebApplicationName with the virtual path of your application):
- Aspnet_compiler.exe -v /WebApplicationName
Fine-Tuning the ASP.NET Process Model
When a call is made to an ASP.NET application, ASP.NET uses a worker thread to handle the request. Sometimes, the code in our application can itself create a new thread, for example when calling out to a service, thus reducing the number of free threads in the thread pool.
To prevent exhaustion of the thread pool, ASP.NET automatically performs several adjustments to the thread pool, and applies several limitations on the number of requests that can execute at any given by. These settings are controlled from three main configuration sections—the system.web ![]() processModel section, the system.web
processModel section, the system.web ![]() httpRuntime section, and the system.net
httpRuntime section, and the system.net ![]() connectionManagement section.
connectionManagement section.
![]() Note The httpRuntime and connectionManagement sections can be set from within the application’s web.config file. The processModel section, however, can only be changed in the machine.config file.
Note The httpRuntime and connectionManagement sections can be set from within the application’s web.config file. The processModel section, however, can only be changed in the machine.config file.
The processModel section controls thread pool limitations such as minimum and maximum number of worker threads, while the httpRuntime section defines limitations related to available threads, such as the minimum number of available threads that must exist in order to keep processing incoming requests. The connectionManagement section controls the maximum number of outgoing HTTP connections per address.
All of the settings have default values, however, since some of these values are set a bit low, ASP.NET includes another setting, the autoConfig setting, which tweaks some of the settings to achieve optimal performance. This setting, which is part of the processModel configuration section exists since ASP.NET 2.0, and is automatically set to true.
The autoConfig setting controls the following settings (the default values below were obtained from the Microsoft Knowledge Base article KB821268 at http://support.microsoft.com/?id=821268 ):
- processModel maxWorkerThreads. Changes the maximum amount of worker threads in the thread pool from 20× the number of cores to 100× the number of cores.
- processModel maxIoThreads. Changes the maximum amount of I/O threads in the thread pool from 20× the number of cores to 100× the number of cores.
- httpRuntime minFreeThreads. Changes the minimum number of available threads that are required to allow the execution of new requests from 8 to 88× the number of cores.
- httpRuntime minLocalFreeThreads. Changes the minimum number of available threads that are required to allow the execution of new local requests (from the local host) from 4 to 76× the number of cores.
- connectionManagement maxConnections. Changes the maximum number of concurrent connections from 10 to 12× the number of cores.
Although the above defaults were set in order to achieve optimized performance, there may be cases when you will need to change them, in order to achieve better performance, depending on the scenario you encounter with your web application. For example, if your application calls out to services, you may need to increase the number of maximum concurrent connections to allow more requests to connect to backend services at the same time. The following configuration shows how to increase the number of maximum connection:
<configuration>
  <system.net>
  <connectionManagement>
  <add address = "*" maxconnection = "200" />
  </connectionManagement>
  </system.net>
</configuration>
In other scenarios, for example when web applications tend to get many requests upon starting, or have a sudden burst of requests, you may need to change the minimum number of worker threads in the thread pool (the value you specify is multiplied at runtime by the number of cores on the machine). To perform this change, apply the following configuration in the machine.config file:
<configuration>
  <system.web>
  <processModel autoConfig = "true" minWorkerThreads = "10"/>
  </system.web>
</configuration>
Before you rush to increase the size of minimum and maximum threads, consider the side effects this change may have on your application: if you allow too many requests to run concurrently, this may lead to excessive CPU usage and high memory consumption, which can eventually crash your web application. Therefore, after changing these settings, you must perform load test to verify the machine can sustain that many requests.
Configuring IIS
As our web application’s hosting environment, IIS has some influence on its overall performance, for example, the smaller the IIS pipeline is, less code will be executed on each request. There are mechanisms in IIS which can be used to increase our application’s performance regarding latency and throughput, as well as some mechanisms which, when tuned properly, can improve the overall performance of our application.
Output Caching
We already saw that ASP.NET provides its own mechanism for output caching, so why does IIS need yet another mechanism for output caching? The answer is quite simple: there are other content types we want to cache, not only ASP.NET pages. For example, we may want to cache a set of static image files that are frequently requested, or the output of a custom HTTP handler. For that purpose, we can use the output cache provided by IIS.
IIS has two types of output cache mechanisms: user-mode cache and kernel-mode cache.
Just like ASP.NET, IIS is capable of caching responses in-memory, so subsequent requests are answered automatically from memory without accessing static files from disk, or invoking server-side code.
To configure the output cache for your web application, open the IIS Manager application, select your web application, open the Output Caching feature. Once opened, click the Add. . . link from the Actions pane to add a new cache rule, or select an existing rule to edit it.
To create a new user-mode cache rule, add a new rule, type the file name extension you wish to cache, and check the User-mode caching checkbox in the Add Cache Rule dialog, as shown in Figure 11-2.
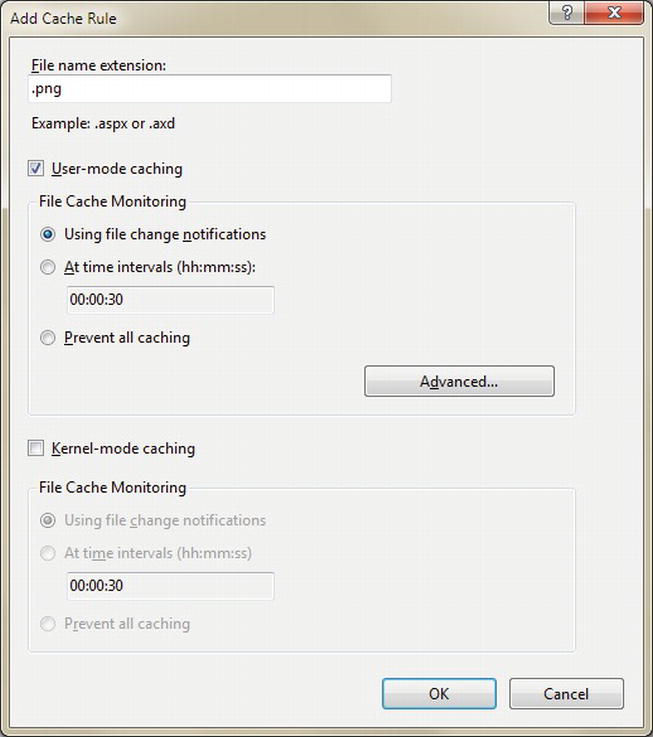
Figure 11-2. The Add Cache Rule dialog
Once you checked the checkbox, you can select when the cached item will be removed from memory, such as after the file has been updated or after some time has passed since the content was first cached. File changes is more suitable for static files, whereas time interval is more suitable for dynamic content. By pressing the Advanced button you can also control how the cache will store different versions of the output (options are according to query string or HTTP headers).
Once you add a caching rule, its configuration will be stored in your application’s web.config file, under the system.webServer ![]() caching section. For example, setting the rule to cache .aspx pages, causes them to expire after 30 minutes, and varies the output by the Accept-Language HTTP header will generate the following configuration:
caching section. For example, setting the rule to cache .aspx pages, causes them to expire after 30 minutes, and varies the output by the Accept-Language HTTP header will generate the following configuration:
<system.webServer>
  <caching>
  <profiles>
  <add extension = ".aspx" policy = "CacheForTimePeriod" kernelCachePolicy = "DontCache"
  duration = "00:00:30" varyByHeaders = "Accept-Language" />
  </profiles>
  </caching>
</system.webServer>
Unlike user-mode cache, which stores the cached content in the IIS’s worker process memory, kernel-mode caching stored cached content in the HTTP.sys kernel-mode driver. Using kernel-mode caching provides faster response time, however it is not always supported. For example, kernel-mode caching cannot be used when the request contains a query string, or when the request is not an anonymous request.
Setting up a cache rule for kernel-mode is done in a similar manner to user-mode caching. In the rules dialog, check the Kernel-mode caching checkbox, and then select the caching monitoring setting you wish to use.
You can use both kernel-mode and user-mode caching in the same rule. When both modes are used, kernel-mode caching is attempted first. If not successful, for example, when the request contains a query string, the user-mode caching is applied.
![]() Tip When using a time interval for monitoring with both kernel-mode and user-mode set, make sure the time interval is identical in both settings, otherwise the interval for kernel-mode will be used for both.
Tip When using a time interval for monitoring with both kernel-mode and user-mode set, make sure the time interval is identical in both settings, otherwise the interval for kernel-mode will be used for both.
Application Pool Configuration
Application pools control how IIS creates and maintains the worker processes which eventually host our code. When you install IIS and ASP.NET several application pools are created, according to the .NET framework versions installed on the web server, to which you can add new pools as you install more web applications on the server. When an application pool is created, it has some default settings which control its behavior. For example, every application pool, when created, has a default setting for the idle timeout after which the application pool shuts down.
Understanding the meaning of some of these settings can help you configure the way the application pool works, so it will serve your application’s needs more precisely.
By changing the recycling settings you can control when the application pool restarts the worker process. For example, you can set that the worker process be recycled every couple of hours, or when it exceeds a certain amount of memory. If your web application consumes a lot of memory over time (for example due to stored objects), increasing the number of recycles can help maintain its overall performance. On the other hand, if your web application performs normally, reducing the number of recycles will prevent loss of state information.
![]() Tip You can use the ASP.NETWorker Process Restarts performance counter to check the number of times your application pool recycled itself and the recycling frequency. If you see many recycles with no apparent reason, try to correlate the results with the application’s memory consumption and CPU usage to verify it hasn’t crossed any thresholds defined in the application pool configuration.
Tip You can use the ASP.NETWorker Process Restarts performance counter to check the number of times your application pool recycled itself and the recycling frequency. If you see many recycles with no apparent reason, try to correlate the results with the application’s memory consumption and CPU usage to verify it hasn’t crossed any thresholds defined in the application pool configuration.
The default setting of an application pool shuts down the pool after 20 minutes of inactivity. If you expect such idle timeframes, for example when all the users go out for lunch, you may want to increase the timeout period, or even cancel it.
By default, an application pool is configured to use all the cores available in the server. If you have any special background process running on the server which needs as much CPU time as it can get, you can tweak the affinity of the pool to use only specific cores, freeing the other cores for the background process. Of course this will also require you to set the background process’s affinity so it won’t compete with the worker process over the same cores.
The default behavior of an application pool is to start one worker process which handles all the requests for the application. If your worker process handles several requests at once, and those requests compete for the same resource by locking on it, you may end up with contention, causing latency in returning responses. For example, if your application is using a proprietary caching mechanism that has locks that prevent concurrent requests from inserting items to the cache, requests will start to synchronize one after the other, causing latencies that will be hard to detect and fix. Although we can sometimes fix the code to use less locking, it is not always possible. Another way of resolving this contention issue is to spin up multiple worker processes, all running the same application, and each handling its own set of requests, thus lowering the contention rate in the application.
Another scenario where running several processes of the same web application is useful, is when you have a 64-bit IIS server running a 32-bit web application. 64-bit servers usually have lots of memory, but 32-bit applications can only use up to 2 GB memory, which often leads up to frequent GC cycles and probably frequent application pool recycles. By spinning two or three worker processes for a 32-bit web application, the application can better utilize the server’s available memory and reduce the number of GC cycles and application pool recycles it requires.
In the IIS application pool configuration, you can set the maximum number of worker processes that are permitted to service requests. Increasing the value to more than 1 (which is the default), will spin more worker processes as requests come in, up to the defined maximum. An application pool that has more than one worker process is referred to as a “Web Garden.” Each time a connection is made from a client, it is assigned to a worker process which services the requests from that client from now on, allowing the requests from multiple users to be balanced between the processes, hopefully lowering to contention rate.
Note that using web gardens has its disadvantages. Multiple worker processes take up more memory, they prevent the use of the default in-proc session state, and when multiple worker processes are running on the same machine you may find yourself dealing with local resource contention, for example if both worker processes try to use the same log file.
Even if you write code that runs fast and you have a hosting environment that has a high throughput, still one of the more problematic bottlenecks of web applications is the bandwidth of your clients and the amount of data and number of requests that the client passes through the network. There are several techniques that can help reduce the number of requests and the size of the responses, some of them are easy as configuring IIS, while others require some more attention to in the application’s code.
Apply HTTP Caching Headers
One of the ways to conserve bandwidth is to make sure that all the content that is not going to change for some time will be cached in the browser. Static content, such as images, scripts, and CSS files are good candidates for browser cache, but also dynamic content such as .aspx and .ashx files can often be cached if the content is not getting updated often.
Setting Cache Headers for Static Content
Static files are usually sent back to the client with two caching headers:
- ETag. This HTTP header is set by IIS to contain a calculated hash, based on the last modification date of the requested content. For static content, such as image files and CSS files, IIS sets the ETag according to the last modification date of the file. When subsequent requests are sent with the previously cached ETag value, IIS calculates the ETag for the requested file, and if it does not match the client’s ETag, the requested file is sent back. If the ETags match, an HTTP 304 (Not Modified) response is sent back. For subsequent requests, the value of the cached ETag is placed in the If-None-Match HTTP header.
- Last-Modified. IIS sets this HTTP header to the last modification date of the requested file. This is an additional caching header which provides a backup in case IIS’s ETag support is disabled. When a subsequent request containing the last modified date is sent to the server, IIS verifies the last modification time of the file and decides whether to respond with the content of the file, if the modification time has changed, or with an HTTP 304 response. For subsequent requests, the value of the cached Last-Modified is placed in the If-Modified-Since HTTP header.
These caching headers will ensure that content is not sent back to the client if the client already has the recent version, but it still requires that a request will be sent from the client to the server to verify that the content hasn’t changed. If you have static files in your application that you know probably won’t change in the next couple of weeks, or even months, such as your company’s logo or script files that are not going to be changed until the next version of the application, you may want to set caching headers that will allow the client to cache that content and reuse it without verifying with the server if the content has changed every time that content is requested. This behavior can be achieved by using either the Cache-Control HTTP header with max-age or the Expires HTTP header. The different between max-age and Expires is that max-age sets a sliding expiration value while Expires allows you to set a fixed point in time (date + time) when the content will expire. For example, setting the max-age to 3600 will allow the browser to use the cached content for one hour (3600 seconds = 60 minutes = 1 hour) automatically, without sending requests to the server to validate it. Once the content expires, either due to the sliding window expiration or due to the arrival of the fixed expiration time, it is marked as stale. When a new request is made to a stale content, the browser will send a request to the server asking for newer content.
![]() Tip You can verify no requests are being sent for cached content by using HTTP monitoring tools, such as Fiddler, and inspecting which requests are sent to the server. If you notice a request being sent although it was supposed to be cached, check the response of that request to verify the existence of the max-age / Expires headers.
Tip You can verify no requests are being sent for cached content by using HTTP monitoring tools, such as Fiddler, and inspecting which requests are sent to the server. If you notice a request being sent although it was supposed to be cached, check the response of that request to verify the existence of the max-age / Expires headers.
Using max-age / Expires together with the ETag / Last-Modified ensures that a request that is sent after the content has expired can return with an HTTP 304 response if the content on the server hasn’t actually changed. The response in this case will contain a new max-age / Expires HTTP header.
In most browsers, clicking the Refresh button (or pressing F5) will force the browser to refresh the cache by ignoring the max-age / Expires header, and sending requests for cached content even if the content has yet to expire. The requests will still have the If-Modified-Since / If-None-Match headers, if applicable, so that the server can return a 304 response if the content is still up-to-date.
To set max-age, add the following configuration to your web.config file:
<system.webServer>
  <staticContent>
  <clientCache cacheControlMode = "UseMaxAge" cacheControlMaxAge = "0:10:00" />
  </staticContent>
</system.webServer>
The above configuration will cause all responses sent for static content to have the Cache-Control HTTP header with the max-age attribute set to 600 seconds.
To use the Expires header, change the clientCache element configuration as shown in the following sample:
<system.webServer>
  <staticContent>
    <clientCache cacheControlMode = "UseExpires" httpExpires = "Wed, 11 Jul 2013 6:00:00 GMT"/>
  </staticContent>
</system.webServer>
The above configuration will make all static content expire on July 11, 2013, at 6 AM.
If you wish to have different max-age or expiration settings for different content, such as have a fixed expiration for JavaScript files and a 100 day sliding window for images, you can use the location section to apply different configuration to different parts of the application, as shown in the following example:
<location path = "Scripts">
  <system.webServer>
   <staticContent>
    <clientCache cacheControlMode = "UseExpires" httpExpires = "Wed, 11 Jul 2013 6:00:00 GMT" />
  </staticContent>
  </system.webServer>
</location>
    <location path = "Images">  <system.webServer>
  <staticContent>
<clientCache cacheControlMode = "UseMaxAge" cacheControlMaxAge = "100.0:00:0" />
  </staticContent>
  </system.webServer>
</location>
![]() Note You must use a fully formatted date and time to set the Expires header. Also, according to the HTTP specifications, the Expires header’s date must not exceed a year from the current date.
Note You must use a fully formatted date and time to set the Expires header. Also, according to the HTTP specifications, the Expires header’s date must not exceed a year from the current date.
Setting Cache Headers for Dynamic Content
Static files have modification dates that can be used to verify if a cached content has changed or not. Dynamic content, however, does not have a modification date, because every time a dynamic content is requested it is recreated and its modification date is actually the current date, therefore headers such as ETag and Last-Modified are not relevant when dealing with dynamic content.
Having said that, if you look at the content of a dynamic page, you may find a way to express the modification date of that content, or maybe calculate an ETag for it. For example, if a request is sent to retrieve product information from the database, the product table might hold a last update date column that can be used to set the Last-Modified header. If the database table doesn’t have a last update column, you can try calculating an MD5 hash from the entity’s fields and set the ETag to the result. When a subsequent request is sent to the server, the server can recalculate the MD5 hash for the entity, and if none of the fields has changed, the ETags will be identical and the server can return an HTTP 304 response.
For example, the following code sets the Last-Modified cache header in a dynamic page to the last update date of a product:
Response.Cache.SetLastModified(product.LastUpdateDate);
If you don’t have the last update date, you can set the ETag to an MD5 hash calculated by the entity’s properties, as demonstrated in the following code:
Response.Cache.SetCacheability(HttpCacheability.ServerAndPrivate);
//Calculate MD5 hash
System.Security.Cryptography.MD5 md5 = System.Security.Cryptography.MD5.Create();
string contentForEtag = entity.PropertyA + entity.NumericProperty.ToString();
byte[] checksum = md5.ComputeHash(System.Text.Encoding.UTF8.GetBytes(contentForEtag));

//Create an ETag string from the hash.
//ETag strings must be surrounded with double quotes, according to the standard
string etag = """ + Convert.ToBase64String(checksum, 0, checksum.Length) + """;
Response.Cache.SetETag(etag);
![]() Note The default cacheability mode of requests in ASP.NET prevents the use of ETags. To support ETags, we need to change the cacheability mode to ServerAndPrivate, allowing content to be cached on the server-side and on the client-side, but not on shared machines, such as proxies.
Note The default cacheability mode of requests in ASP.NET prevents the use of ETags. To support ETags, we need to change the cacheability mode to ServerAndPrivate, allowing content to be cached on the server-side and on the client-side, but not on shared machines, such as proxies.
When receiving a request containing an ETag, you can compare the calculated ETag with the ETag supplied by the browser, and if they match, respond with a 304 response, as shown in the following code:
if (Request.Headers["If-None-Match"] == calculatedETag) {
  Response.Clear();
  Response.StatusCode = (int)System.Net.HttpStatusCode.NotModified; Response.End();
}
If you have any assumptions on the life span of the dynamic content, you can also apply values to the max-age or Expires headers. For example, if you assume that a discontinued product will not be changed, you can set the page returned for the product to expire in one year, as follow:
if (productIsDiscontinued)
  Response.Cache.SetExpires(DateTime.Now.AddYears(1));
You can also do the same using the Cache-Control max-age header:
if (productIsDiscontinued)
  Response.Cache.SetMaxAge(TimeSpan.FromDays(365));
Instead of setting the response’s expiration in code, you can specify it in the .aspx file as an output cache directive. For example, if the product information shown in the product page can be cached for 10 minutes (600 seconds) in the client, you can set the product page’s output cache directive to the following:
<%@ Page . . . %>
<%@ OutputCache Duration = "600" Location = "Client"%>
When using the OutputCache directive, the specified duration is output to the response’s HTTP headers as both max-age and expires (expires is calculated from the current date).
Turn on IIS Compression
With the exception of multimedia files (sound, images, and videos) and binary files, such as Silverlight and Flash components, most of the content returned from our web server is text-based, such as HTML, CSS, JavaScript, XML, and JSON. By using IIS compression, those textual responses can be shrunk in size, allowing a quicker response with smaller payloads. With the use of IIS compression, responses can be reduced in size up to 50–60 percent of their original size, and sometimes even more than that. IIS supports two types of compression, static and dynamic. To use IIS compression, make sure you first install the static and dynamic compression IIS components.
Static Compression
When using static compression in IIS, compressed content is stored on disk, so for subsequent requests for the resource, the already compressed content will be returned without the need to perform the compression again. By only compressing the content once, you pay with disk space, but reduce CPU usage and latency that is usually the result of using compression.
Static compression is useful for files that don’t usually change (therefore “static”), such as CSS files, JavaScript files, but even if the original file changes, IIS will notice the change, and will recompress the updated file.
Note that compression works best for text files (*.htm, *.txt, *.css) and even for binary files, such as Microsoft Office documents (*.doc, *.xsl), but doesn’t work that well for files which are already compressed, such as image files (*.jpg, *.png) and compressed Microsoft Office documents (.docx, .xslx).
Dynamic Compression
When using dynamic compression, IIS performs the compression each time a resource is requested, without storing the post-compression content. This means every time the resource is requested it will be compressed before being sent to the client, incurring both CPU usage and some latency due to the compression process. Dynamic compression, therefore, is more suitable for content that changes often, such as ASP.NET pages.
Since dynamic compression increases the CPU usage, it is advisable that you check your CPU utilization after turning on the compression, to verify it does not put too much strain on the CPU.
The first thing that needs to be done to use compression is to enable either static compression, dynamic compression, or both. To enable compression in IIS, open the IIS Manager application, select your machine, click the Compression option, and select which compression features your wish to use, as shown in Figure 11-3:
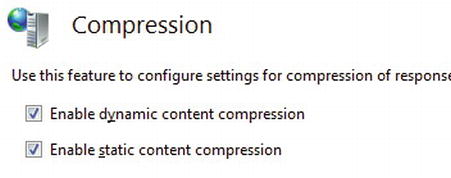
Figure 11-3 . Enabling dynamic and static compression in the IIS Manager application
You can also use the Compression dialog to set static compression settings, such as the folder where the cached content will be stored, and the minimum file size eligible for compression.
After selecting which compression types are active, you can go ahead and select which MIME types will be statically compressed and which will be dynamically compressed. Unfortunately, IIS doesn’t support changing these settings from the IIS Manager application, so you will need to change it manually in the IIS configuration file, applicationHost.config, which is located in the %windir%System32inetsrvconfig folder. Open the file and search for the < httpCompression > section, you should already see several MIME types defined for static compression and several other types for dynamic compression. In addition to the already specified MIME types, you can add additional types which you use in your web applications. For example, if you have AJAX calls that return JSON responses, you may want to add dynamic compression support for those responses. The following configuration shows how to dynamic compression support for JSON (existing content was removed for brevity):
<httpCompression>
   <dynamicTypes>
     <add mimeType = "application/json; charset = utf-8" enabled = "true" />
   </dynamicTypes>
</httpCompression>
![]() Note After adding new MIME types to the list, it is advised that you verify the compression is indeed working by checking the responses with HTTP sniffing tools, such as Fiddler. Compressed responses should have the Content-Encoding HTTP header, and it should be set to either gzip or deflate.
Note After adding new MIME types to the list, it is advised that you verify the compression is indeed working by checking the responses with HTTP sniffing tools, such as Fiddler. Compressed responses should have the Content-Encoding HTTP header, and it should be set to either gzip or deflate.
IIS Compression and Client Applications
In order for IIS to compress outgoing responses, it needs to know that the client application can handle compressed responses. Therefore, when a client application sends a request to the server, it needs to add the Accept-Encoding HTTP header and set it to either gzip or deflate.
Most known browsers add this header automatically, so when using a browser with a web application or a Silverlight application, IIS will respond with compressed content. However, in .NET applications, when sending HTTP requests with the HttpWebRequest type, the Accept-Encoding header is not automatically added, and you will need to add it manually. Furthermore, HttpWebRequest will not try to decompress responses unless it is set to expect compressed responses. For example, if you are using an HttpWebRequest object, you will need to add the following code to be able to receive and decompress compressed responses:
var request = (HttpWebRequest)HttpWebRequest.Create(uri);
request.Headers.Add(HttpRequestHeader.AcceptEncoding, "gzip,deflate");
request.AutomaticDecompression = DecompressionMethods.GZip | DecompressionMethods.Deflate;
Other HTTP communication objects, such as an ASMX web service proxy or a WebClient object, also support IIS compression, but need to be manually configured to send the header and decompress the response. As for HTTP-based WCF services, prior to WCF 4, .NET clients using either a service reference or a channel factory did not support IIS compression. As of WCF 4, IIS compression is supported automatically, both for sending the header and decompressing the response.
When working with web applications, you often work with pages that use several JavaScript and CSS files. When a page has several links to external resources, loading the page in a browser becomes a lengthy operation, since the user will often need to wait until the page and all of its related styles and scripts are downloaded and parsed. When working with external resources we face two problems:
- The number of requests the browser needs to send and wait for the response. The more requests there are, the more time it will take the browser to send all requests, since browsers are limited by the number of concurrent connections they can have to a single server (for example, in IE 9 the number of concurrent requests per server is 6).
- The size of the response, which affects the overall time it takes the browser to download all the responses. The larger the responses, the more time it will take for the browser to download the response. This may also affect the browser’s ability to begin sending new requests if hitting the maximum number of concurrent requests.
To resolve this issue we need a technique that will both enable us to lower the size of responses and reduce the number of requests (and therefore responses). With ASP.NET MVC 4 and in ASP.NET 4.5, this technique is now built in to the framework and is called “bundling and minification.”
Bundling refers to the ability to bundle a set of files into one URL which when requested, returns all the files concatenated as one response, and minification refers to the reduction of size of a style or script file by removing whitespaces, and in the case of script files, renaming variables and functions so they use less characters, therefore taking less space.
The use of minification together with compression can significantly reduce the size of responses. For example, the size of the jQuery 1.6.2 script file before minification is 240 kb. After compression the file size is approximately 68 kb. The minified version of the original file is 93 kb, a bit bigger than the compressed version, but after applying compression to the minified file, the size comes down to only 33 kb, about 14 percent of the original file size.
To create a minified bundle, first install the Microsoft.AspNet.Web.Optimization NuGet package, and add a reference to the System.Web.Optimization assembly. Once added, you can use the BundleTable static class to create new bundles for scripts and styles. The bundling should be set prior to loading pages, therefore you should place the bundling code in the global.asax, in the Application_Start method. For example, the following code creates a bundle named MyScripts (accessible from the virtual bundles folder) with three script files which will automatically be minified:
protected void Application_Start() {
  Bundle myScriptsBundle = new ScriptBundle("∼/bundles/MyScripts").Include(
    "∼/Scripts/myCustomJsFunctions.js",
    "∼/Scripts/thirdPartyFunctions.js",
    "∼/Scripts/myNewJsTypes.js");
  BundleTable.Bundles.Add(myScriptsBundle);
  BundleTable.EnableOptimizations = true;
}
![]() Note By default, bundling and minification only work when the web application’s compilation mode is set to release. To enable bundling even when in debug mode, we set EnableOptimizations to true.
Note By default, bundling and minification only work when the web application’s compilation mode is set to release. To enable bundling even when in debug mode, we set EnableOptimizations to true.
To use the bundle which was created, add the following script line to the page:
<% = Scripts.Render("∼/bundles/MyScripts") %>
When the page is rendered, the above line will be replaced with a < script > tag that points to the bundle, for example the above line may translate to the following HTML:
<script src = "/bundles/MyScript?v = XGaE5OlO_bpMLuETD5_XmgfU5dchi8G0SSBExK294I41"
  type = "text/javascript" > </script>
By default, the bundle and minification framework sets the response to expire after one year, so the bundle will remain in the browser’s cache and served from the cache. To prevent bundles from becoming stale, each bundle has a token which is placed in the URL’s query string. If any of the files are removed from the bundle, if new files are added, or if the bundled files are changed, the token will change, and the next request to the page will generate a different URL with a different token, making the browser request for the new bundle.
In a similar manner, we can create a bundle for CSS files:
Bundle myStylesBundle = new StyleBundle("∼/bundles/MyStyles")
  .Include("∼/Styles/defaultStyle.css",
        "∼/Styles/extensions.css",
        "∼/Styles/someMoreStyles.js");
BundleTable.Bundles.Add(myStylesBundle);
And use the bundle in a page:
<% = Styles.Render("∼/bundles/MyStyles") %>
Which will render a < link > element:
<link href = "/bundles/MyStyles?v = ji3nO1pdg6VLv3CVUWntxgZNf1zRciWDbm4YfW-y0RI1"
  rel = "stylesheet" type = "text/css" />
The bundling and minification framework also supports custom transformations, allowing the creation of specialized transform classes, for example to create your own custom minification for JavaScript files.
Use Content Delivery Networks (CDNs)
One of the performance issues related to web applications is the latency involved with accessing resources over the network. End-users who use the same local network as the web server usually have good response time, but once your web application goes global and users from all over the world access it over the Internet, distant users, such as users from other continents, will probably suffer from longer latencies and slower bandwidth due to network problems.
One solution to the location problem is to spread multiple instances of the web server in different locations, geographically dispersed, so end-users will always be geographically close to one of the servers. Of course this creates a whole management issue since you will need to replicate and synchronize servers all the time, and possibly instruct each end-user to use a different URL according to where they are in the world.
That is where Content Delivery Networks (CDNs) come in. A CDN is a collection of web servers, placed in different locations around the globe, allowing end-users to always be close to your web application’s content. When using CDNs, you actually use the same address of the CDN all over the world, but the local DNS in your area translates that address to the actual CDN server which is closest to your location. Various Internet companies, such as Microsoft, Amazon, and Akamai have their own CDNs which you can use for a certain fee.
The following scenario describes the common use of a CDN:
- You set up your CDN and point it to where the original content is.
- The first time an end-user accesses the content through the CDN, the local CDN server connects to your web server, pulls the content from it, caches it in the CDN server, and returns the content to the end-user.
- For subsequent requests, the CDN server returns the cached content without contacting your web server, allowing for quicker response times, and possibly faster bandwidth.
![]() Note In addition to serving your end-users faster, the use of a CDN also reduces the number of requests for static content your web server needs to handle, allowing it to dedicate most of its resources for handling dynamic content.
Note In addition to serving your end-users faster, the use of a CDN also reduces the number of requests for static content your web server needs to handle, allowing it to dedicate most of its resources for handling dynamic content.
To achieve the first step, you will need to choose the CDN provider you wish to use, and configure your CDN as instructed by its provider. Once you have the address of the CDN, simply change the links for your static content (images, styles, scripts) to point to the CDN address. For example, if you upload your static content to Windows Azure blob storage and register your content with Windows Azure CDN, you can change the URLs in your pages to point to the CDN like so:
<link href = "http://az18253.vo.msecnd.net/static/Content/Site.css
" rel = "stylesheet" type = "text/css" />
For debugging purposes you can replace the static URL with a variable that will allow you to control whether to use a local address or the CDN’s address. For example, the following Razor code constructs the URL by prefixing it with the CDN address provided by the CdnUrl application setting from the web.config file:
@using System.Web.Configuration
<script src = "@WebConfigurationManager.AppSettings["CdnUrl"]/Scripts/jquery-1.6.2.js"
  type = "text/javascript" > </script>
When debugging your web application, change the CdnUrl to an empty string to get the content from your local web server.
Scaling ASP.NET Applications
So you’ve improved the performance of your web application by incorporating everything you learned here, maybe even applied some other techniques to boost things up, and now your application is working great, and is as optimized as it can be. You put your application to production, everything works great for the first couple of weeks, but then additional users start using the web site, and more new users are joining every day, increasing the number of requests your server has to handle, and suddenly, your server starts to choke. It may begin with requests taking longer than usual, your worker process starts to use more memory and more CPU, and eventually requests give in to timeouts, and HTTP 500 (“Internal Server Error”) messages are filling your log files.
What has gone wrong? Should you try to improve the performance of your application again? More users will join and again you’ll be in the same situation. Should you increase the machine’s memory, or add more CPUs? There’s a limit to the amount of scale-up you can do on a single machine. It’s time to face the facts—you need to scale out to more servers.
Scaling out web applications is a natural process that has to occur at some point in the life cycle of web applications. One server can hold dozens and even thousands of concurrent users, but it cannot handle that kind of stress for that long. Session state filling up the server’s memory, threads getting starved because there are no more threads available, and context-switching that occurs too often will eventually increase the latency and lower the throughput of your single server.
From an architectural point of view, scaling is not hard: just buy another machine or two (or ten), place the servers behind a load-balancer, and from there on, all should be OK. The problem is that usually it’s not that easy.
One of the major issues developers face when having to scale is how to handle server affinity. For example, when you use a single web server, the session state of your users is kept in-memory. If you add another server, how will you make those session objects available to it? How will you synchronize the sessions between the servers? Some web developers tend to solve this issue by keeping the state in the server and having an affinity between the client and the server. Once a client connects to one of the servers through the load balancer, the load balancer will, from that point on, keep sending all of that client’s requests to the same web server, this is also referred to as a “sticky” session. Using sticky sessions is a workaround, not a solution, since it does not allow you to truly balance the work between the servers. It is easy getting to a situation where one of the servers is handling too many users, whereas other servers are not handling requests at all, because all of their clients already disconnected.
So the real solution for good scalability is not to rely on your machine’s memory, whether its regarding the state you keep for your users, or the cache you store in-memory to boost performance. Why does storing cache on a machine become problematic when scaling? Just think what will happen when a user sends a request that causes the cache to be updated: the server that got the request will update its in-memory cache, but other servers won’t know of this change, and if they also have a copy of that cached object, it will become stale and cause application-wide inconsistencies. One of the ways you might choose to solve this issue is by synchronizing cached objects between servers. Although possible, this solution adds another layer of complexity to the architecture of your web application, not to mention the amount of chatter your servers are going to have between them.
ASP.NET Scaling Mechanisms
Scaling out to multiple servers requires an out-of-process state management. ASP.NET has two built-in out-of-process mechanisms for state management:
- State Service. The state service is a Windows service that provides state management for multiple machines. This service is installed automatically when installing the .NET framework, but is turned off by default. You can simply choose which machine will run the state service, and configure all other machines to use it. Although state service enables several machines to use the same session store, it does not provide persistency, so if something happens to the machine hosting the service, the entire session state of your web farm will be lost.
- SQL Server. ASP.NET supports storing the session state in SQL Server. Storing state in SQL Server gives the same sharing abilities as that of the state service, but it also enables the persistency of the state, so even if your web servers fail, and if the SQL Server fails, the state information can be restored.
For caching, the solution in most cases is to use a distributed cache mechanism, such as Microsoft’s AppFabric Cache, NCache, or Memcached which is an open-source distributed cache. With distributed cache, you can take several servers and combine their memory into one distributed memory, which is used as a cache store for your cached data. Distributed caches offer abstraction of location so you don’t need to know where each piece of data is located, notification services so you can know when something has changed, and high-availability to make sure that even if one of the cache servers fails, the data is not lost.
Some distributed caches, such as AppFabric Cache and Memcached also have custom Session State and Cache providers for ASP.NET.
Although not relevant to performance, it is a good place to mention some other issues you should be aware of when scaling out your web application. Certain parts in web applications require the use of a special security keys to generate unique identifiers that prevent tampering and spoofing the web application. For example, a unique key is used when creating Forms Authentication cookies, and when encrypting view state data. By default, the security keys for a web application are generated each time the application pool starts. For a single server this might not be a problem, but when you scale out your server into multiple servers this will pose a problem, since each server will have its own unique key. Consider the following scenario: a client sends a request to server A and gets back a cookie signed with server A’s unique key, then the client sends a new request to server B with the cookie it received before. Since server B has a different unique key, the validation of the cookie’s content will fail and an error will be returned.
You can control how these keys are generated in ASP.NET by configuring the machineKey section in your web.config. When scaling out web applications to multiple servers, you need to configure the machine key to use the same pre-generated key in all the servers by hard-coding it into the application’s configuration.
Another issue relating to scaling out and the use of unique keys is the ability to encrypt sections in web.config files. Sensitive information located in the web.config file is often encrypted when the application is deployed to production servers. For example, the connectionString section can be encrypted to prevent the username and password to the database from being discovered. Instead of encrypting the web.config file separately in each server after deployment, making the deployment process tedious, you can generate one encrypted web.config file and deploy it to all the servers. To be able to do that, all you need to do is to create an RSA key container and import it once in all the web servers.
![]() Note To learn more about generating machine keys and applying them to the application’s configuration, consult the Microsoft Knowledge Base document KB312906 (http://support.microsoft.com/?id=312906). For more information on generating the RSA key container, read the “Importing and Exporting Protected Configuration RSA Key Containers” MSDN article (http://msdn.microsoft.com/library/yxw286t2).
Note To learn more about generating machine keys and applying them to the application’s configuration, consult the Microsoft Knowledge Base document KB312906 (http://support.microsoft.com/?id=312906). For more information on generating the RSA key container, read the “Importing and Exporting Protected Configuration RSA Key Containers” MSDN article (http://msdn.microsoft.com/library/yxw286t2).
Summary
In the beginning of this chapter, we argued that the overall performance of a web application is controlled not only by your code, but also by various parts of the pipeline. We started this chapter by examining some testing and analyzing tools that can assist you in locating the bottlenecks in your web applications. By proper testing, and using monitoring and analysis tools, you can easily track down problems, and significantly improve the performance of your web application. From there, we went over the pipeline, identifying different parts of it that can be modified to make your application either work faster, work smarter, or provide smaller payloads so they can be sent more quickly. After going over this chapter, you are now aware to how small changes, such as working properly with client-side caching, can help reduce the number of requests your server has to deal with, resolving some bottleneck issues many applications are facing.
Later on in the chapter, we realized that a single server will not be able to handle all of your client’s requests, so planning ahead for scaling and applying scalable solutions beforehand, such as distributed cache and out-of-process state management, will enable you to scale easier once you’ve reached the point where one server is just not enough. Finally, in this chapter we only explored different techniques of improving the server-side of your web application, leaving another side for you to explore—the client side.
This is the last chapter of this book. Throughout its eleven chapters, you have seen how to measure and improve application performance, how to parallelize .NET code and run your algorithms on the GPU, how to navigate the complexities of the .NET type system and garbage collector, how to choose collections wisely and when to implement your own, and even how to use the latest-and-greatest processor features to squeeze additional performance for your CPU-bound software. Thank you for following us on this journey, and best of luck improving the performance of your applications!