
![]()
Debugging Async—Beyond Visual Studio
Visual Studio is a very powerful debugging tool. However, by its very nature, it struggles to provide insight into issues experienced on production machines. Developers cannot install development tools on production machines or attach an interactive debugger; as you have seen, hitting a breakpoint halts execution of all threads in the process, which means the production system halts. Instead, we need an approach that gives us data that we can mine, offline, to discover the root cause of a bug or performance issue. Generally this means using memory dumps.
Memory Dumps
A memory dumpis a file containing a copy of the address space of a process. There are, in fact, two types of memory dumps: full dumps and mini dumps. Full dumps contain the entire virtual address space of the process, whereas mini dumps contain only a subset of those data, possibly down to only the stacks of the threads in the process. For native code a mini dump can prove very useful for the issue being investigated, especially if the interesting state resides on the stack. However, managed code heavily relies on heap-based resources—for example, thrown exceptions are allocated on the heap. This means that even though the process may have terminated due to an unhanded exception, with a mini dump you cannot discern the actual cause. Therefore, using memory dumps for debugging managed code generally requires a full dump.
Generating a Memory Dump
To many people the most familiar way of getting a dump file for a process is via Dr. Watson for Windows; however, this only produces mini dumps. Luckily there are a number of alternative techniques that will create full dumps, or at least heavily augmented mini dumps that are useful for managed code debugging.
A QUESTION OF “BITNESS”
Modern versions of Windows are 64 bit. When you write managed code it is commonly compiled for “Any CPU”—in other words, the JIT compiler will compile the code for 64 bit when loaded into the 64-bit subsystem and 32 bit when loaded into the 32-bit subsystem. Sometimes, however, through interop, your managed code is dependent on 32-bit or 64-bit native DLLs. If that is the case you need to ensure your code is always loaded into the correct subsystem, such that the native DLLs can be loaded successfully. You can control this via the Build tab in the project properties where the Platform Target drop-down allows you to specify how the JIT compiler should behave.
Dump files, and the tools you use to analyze them, need to match the “bitness” of the process you are debugging. Fortunately all of the tools used for generating dump files have the potential to create a dump file with the correct bitness.
Sometimes you have to work with what you have—for example, a customer has generated a mismatched dump file and it can’t easily be recreated. Fortunately, all is not lost and workarounds for mismatches can sometimes be found. Generally, however, life is always far smoother if the tools and the application are aligned.
Task Manager
Since Windows Vista we have been able to right-click on a process in Task Manager and select Create Dump File. This will generate a dump file in the current user’s profile in the AppDataLocalTemp directory. As long as you are simply trying to take a snapshot of a process, this is probably the simplest method of generating a dump file. However, because Task Manager is part of the operating system, it is easy to forget that it is bound to either 32 bit or 64 bit. On a 64-bit operating system the Task Manager you will normally see is a 64-bit application. As the “A Question of ‘Bitness’” sidebar explains, this is not a problem for 64-bit applications but will cause issues with 32-bit applications. So how do you know whether the application for which you want to create a dump file is a 32-bit or 64-bit application?
By default Task Manager doesn’t show the subsystem a process is running in. To see this information you have to show an extra column in the Details view of Task Manager. You can do this by right-clicking on the column headers and selecting Select Columns. If you click the Platform check box you will see a new Platform column showing either 32 bit or 64 bit (Figure 14-1).
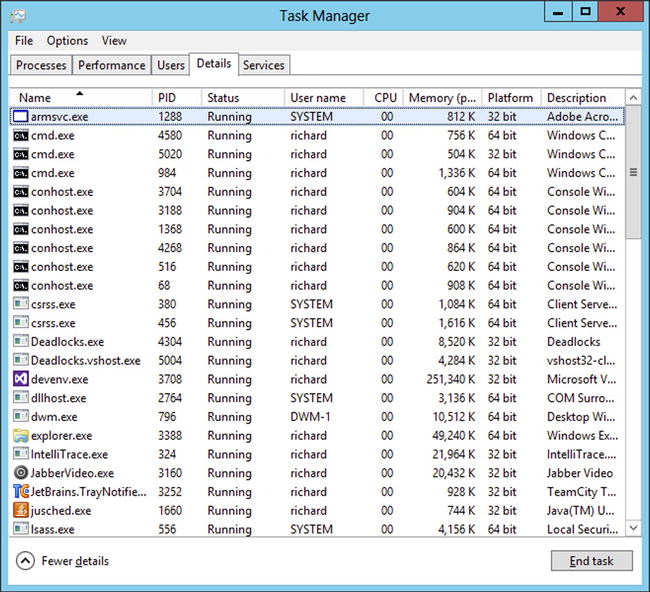
Figure 14-1. Task Manager showing Platform
If the process is 64 bit, then you can happily create the dump file directly and it will be perfectly usable. However, if the process is 32 bit, then to get a usable dump file you need to run the 32-bit version of Task Manager and capture the dump using that. On a 64-bit machine you will find the 32-bit version of Task Manager (taskmgr.exe) under the Windows directory in the SysWOW64 subdirectory.
If you call Microsoft Product Support with a server problem, and they need a memory dump to aid their diagnosis, they will very likely ask you to install a tool called DebugDiag on the machine. They will then walk you through configuring it to create one or more dump files. DebugDiag is a free download from Microsoft’s website. It installs as a Windows service and monitors applications, generating dump files according to a set of configurable rules.
Adding Rules
Rules are added using a wizard. By default, this wizard starts automatically when the DebugDiag Collection application is started. However, if you have turned this off it can be found as the Tools ![]() Rule Actions
Rule Actions ![]() Add Rule menu option. The initial page of the wizard is shown in Figure 14-2.
Add Rule menu option. The initial page of the wizard is shown in Figure 14-2.

Figure 14-2. The Add Rule Wizard
There are three types of rules that you can add: Crash, Performance, and Native (non-.NET) Memory and Handle Leak. These labels, however, don’t tell the whole story. For example, the Crash option allows you to create dumps on a far more flexible basis than simply if the application crashes. Let’s look at the options in more detail.
Crash
Certainly the crash option can be used for capturing a memory dump when an application crashes, but as you have seen, threading bugs rarely manifest themselves as program crashes. Fortunately, the Crash option is far more flexible than just capturing simple crashes. First you need to select the process to monitor, and again you have a choice. When you click the Next button with the Crash option selected you are presented with the Select Target Type wizard (Figure 14-3). Of these options, only three really apply to managed code: a process (for standard applications), an IIS web application pool (for ASP.NET web applications or services), and an NT service (for code deployed as a service). Select the most appropriate option for your needs and you will be presented with the corresponding list of targets (processes, application pools, or services). One option to note when selecting a process is that you can opt to monitor just one running instance of a process or all instances of that process (including ones that have yet to be started).
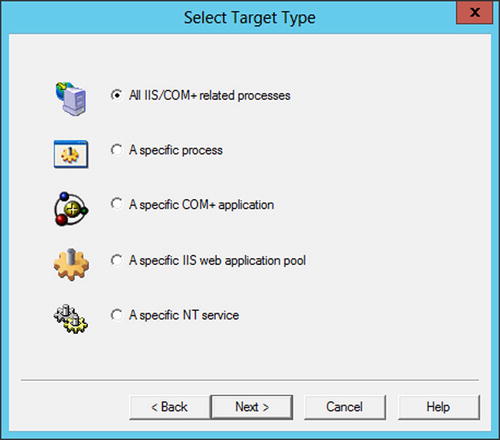
Figure 14-3. The Select Target Type page of the Crash Wizard
Once you have selected the target and pressed Next you will be presented with a dialog that lets you choose the process, service or IIS application pool. Once this is selected, you can tune the rule for dump file generation on the Advanced Configuration Dialog (Figure 14-4).
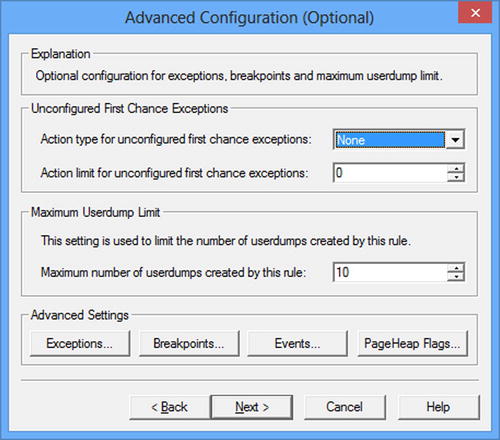
Figure 14-4. The Advanced Configuration dialog
If you simply click Next, you will create a rule that generates a single dump file if the process terminates unexpectedly. However, for multithreaded debugging there is another useful option you can enable. In the Events part of the advanced configuration you can add events to monitor for thread creation and exit (Figure 14-5). This means that you can auto-generate a dump file every time a new thread is created or exits (remember to select the option to generate a full dump).
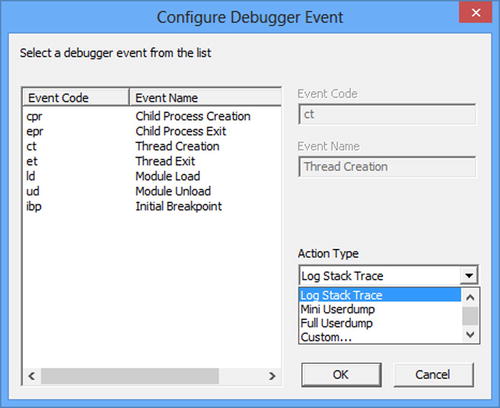
Figure 14-5. The Add Event dialog
One thing to consider, however, is that with the thread pool, threads are reused. These events therefore will not necessarily map to new items of work being executed or finishing. However, it is still worth bearing them in mind as one way to trigger dump file creation.
Performance
There are two types of performance rules: those based on a performance counter and those focused on HTTP. Selecting the Performance option on the initial Crash Wizard page and clicking Next will show the Select Performance Rule Type page (Figure 14-6).
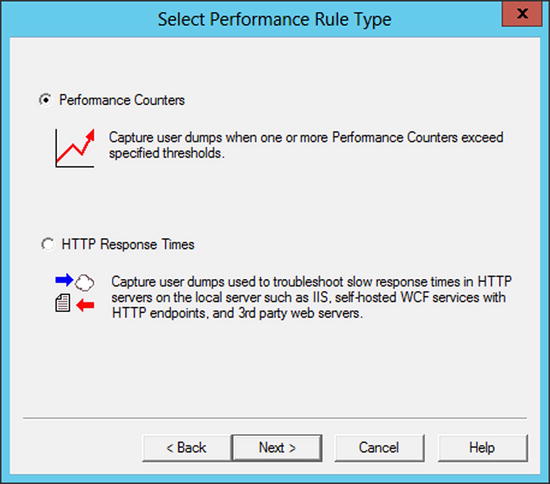
Figure 14-6. Selecting the performance rule type
The performance-counter-based rules allow you to select a performance counter and trigger dump files based on that counter breaching specified values. To get started, add performance triggers—the .NET CLR LocksAndThreads category contains useful counters for working with asynchronous processing. Figure 14-7 shows a trigger being set for the Contention Rate/sec for all instances of a process called DebugDiagRules.exe.
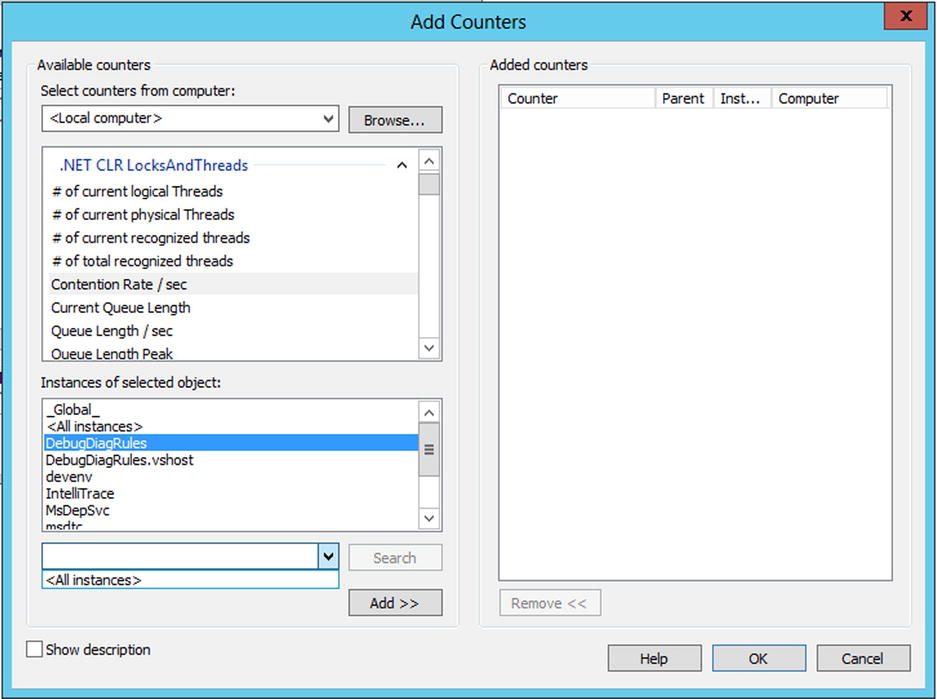
Figure 14-7. Adding a performance counter trigger
Once you have added the trigger, you can set trigger points for the counter by selecting the created trigger and clicking the Edit Thresholds button. This shows the properties of the trigger (Figure 14-8). On this dialog you can specify what the threshold is and for how long it must be breached before a dump file is generated.
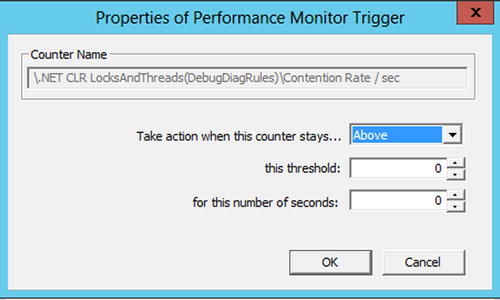
Figure 14-8. Editing the trigger thresholds
Now you need to define what processes should be dumped when the trigger fires. Often this will be the same process as the performance counter is measuring. However, imagine a situation where a server is running completely swamped by the large numbers of threads. In this situation you could set up a trigger on the total number of threads and get DebugDiag to dump all of the ASP.NET application pools. In a similar way to the crash rules, you can select processes, application pools, and services.
The penultimate step is to configure the kind of dumps you want and how many. This is done on the Configure UserDump Series page of the wizard. Make sure you select the option to Collect FullUserDumps (Figure 14-9).
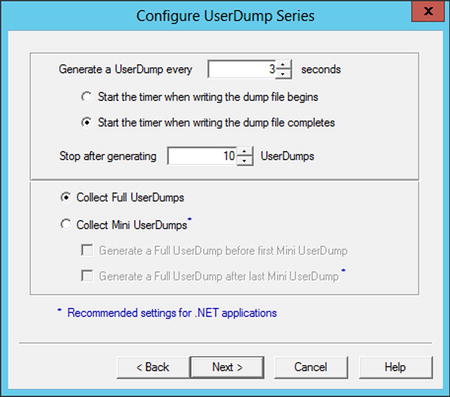
Figure 14-9. Configuring the UserDumps
Last, name the rule and specify an output directory for the generated dump files and the rule is complete.
![]() Tip You may be thinking, “I know when my issue occurs but I can’t work out a rule.” Remember that you can create your own performance counters. There is a whole API around System.Diagnostic.PerformanceCounter that allows you to create and increment counters. So if you need a counter that doesn’t exist to hook your debugging around, you can always create your own counters in your application that surface behavior to aid debugging. Just bear in mind that you have to deploy a new version of your code to introduce your own performance counters (not the registration of them, but your application code needs to increment them at appropriate times).
Tip You may be thinking, “I know when my issue occurs but I can’t work out a rule.” Remember that you can create your own performance counters. There is a whole API around System.Diagnostic.PerformanceCounter that allows you to create and increment counters. So if you need a counter that doesn’t exist to hook your debugging around, you can always create your own counters in your application that surface behavior to aid debugging. Just bear in mind that you have to deploy a new version of your code to introduce your own performance counters (not the registration of them, but your application code needs to increment them at appropriate times).
Native (non-.NET) Memory and Handle Leak
Despite the name of this rule, it is a useful rule type for .NET code when trying to track down a memory leak, as you can trigger the generation of a series of dump files as the memory of a process increases (in managed code you can assess which objects are growing in size and number and therefore the likely root of the leak). However, our focus is threading and so we will not go into detail on this option.
Executing Rules
Unless you state otherwise, rules are enabled once created. Rules will be active until they have generated the dump files they were designed to produce, at which time they deactivate. DebugDiag shows a list of configured rules in its main window. These rules have one of three statuses: Active means the rule is monitoring and potentially going to generate dump files; Completed means the rule has generated its required dumps and has deactivated; and Not Active means the rule has not yet been activated since being created. Not Active and Completed rules can be set to Active using the rule’s context menu.
Task Manager can generate a user dump of a running process on demand and DebugDiag can create user dumps based on a set of configurable rules. However, it can also be useful to be able to generate a dump file on an ad hoc basis when an application is terminating unexpectedly—either when certain actions are performed or on startup. This is the gap that a tool called ADPLUS fulfils.
ADPLUScomes as part of Debugging Tools for Windows which, at the time of writing, ships as part of the Windows SDK (previously it has been a stand-alone install). Its origins are based on issues experienced in Microsoft support when trying to explain to customers how to generate a dump file. The tool that actually does the work is the command line debugger (or cdb.exe), but the configuration of cdb.exe is nontrivial, and so Microsoft support created a VBScript file, ADPLUS.VBS, which presented a much simpler façade to enable dump file generation. These days the VBScript file has been turned into an executable, adplus.exe.
With all the tools in Debugging Tools for Windows, you need to ensure that you use the correct “bitness” of tool for the running executable. Fortunately, with the latest installations, both 32-bit and 64-bit versions are installed when you install the tools (assuming you are installing on a 64-bit machine). At the time of writing, Debugging Tools for Windows is installed in the Program Files(x86)Windows Kits<version>Debuggers directory and the 32-bit and 64-bit versions are in the x86 and x64 subdirectories, respectively.
There are three ways to run ADPLUS, depending on the circumstances in which you want the dump file generated.
Crash Mode
If you are trying to capture a dump file when an application is crashing, Task Manager cannot help. This is somewhere ADPLUS can really shine as you do not have to install DebugDiag and configure rules. You simply run the following command (obviously, as an executable, you will need to run this in a context where adplus.exe is on path).
adplus -crash -pn <name of executable> -o <directory in which to generate the dump files>
Here -pn identifies the process, although it is possible to use -p and provide the process ID, which is useful if you have more than one instance of the application running. At the point when the specified process exits unexpectedly, cbd.exe (which has spawned in the background) will create the crash dump.
Spawning Mode
Crash Mode works well when the process is already running. However, if the application crashes when you start it, then you will not get an opportunity to run ADPLUS in Crash Mode. This is the situation for which Spawning Mode (a refinement of Crash Mode) exists. You trigger Spawning Mode by adding the -SC flag to the preceding command line. In this case the executable needs to be on path or you need to provide the path to it.
adplus -crash -SC -pn <path to executable> -o <directory in which to generate the dump files>
Hang Mode
Although its name suggests it, hang mode is not about the application hanging as such (as it would if every thread was deadlocked), but rather that you need a snapshot of the process as it is at this point in time. For completeness the syntax is included, although if you are running on Windows Vista or later you can simply use Task Manager to achieve the same effect.
adplus -hang -pn <name of executable> -o <directory in which to generate the dump files>
IMPROVING DUMP QUALITY
The JIT compiler performs a number of optimizations that can obscure the information in the dump file (such as inlining and using registers instead of the stack for parameters in method calls). You can turn off optimization by creating an .INI file matching the application or DLL for which you want to disable optimization. Enter the following in the .INI file before starting the process.
[.NET Framework Debugging Control]
GenerateTrackingInfo=1
AllowOptimize=0
Obviously, here you are changing the executing code, and so there is always a chance that the behavior you are trying to debug suddenly no longer happens—especially with race conditions. However, it can be a useful technique to make analyzing the dump file easier.
Analyzing Memory Dumps
You have seen a number of ways to generate a memory dump, but what do you do with it once you have it? Since .NET 4.0 and Visual Studio 2010 (note that both are necessary), you can load a dump file into Visual Studio and use its visual tools (Call Stack, Threads, and Parallel Stacks windows) to gain insight. Also, if the PDB file was available when the dump was produced and you have access to the source code, you can synchronize the point in the source when the dump was produced. While Visual Studio can provide some insight, the main tool we tend to use for dump analysis is WinDbg (normally pronounced either “Win Debug” or “Wind Bag”).
WinDbg
WinDbg is part of the Debugging Tools for Windows tool set. As such there is are 32-bit and 64-bit versions and, again, the right one must be used. WinDbg is traditionally used with native code and especially device driver debugging. However, it can also provide powerful insight into bugs in managed applications.
To load a dump file, simply open WinDbg and select File ![]() Open Crash Dump (or press Ctrl-D). You will notice that WinDbg is, basically, a windowed view of command line output (Figure 14-10).
Open Crash Dump (or press Ctrl-D). You will notice that WinDbg is, basically, a windowed view of command line output (Figure 14-10).
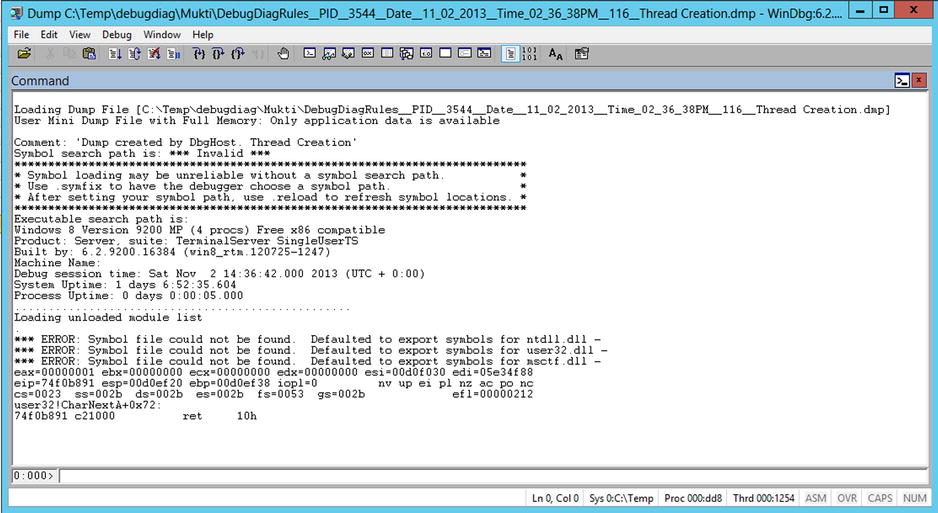
Figure 14-10. WinDbg with a loaded dump file
WinDbg has a fairly arcane syntax for entering commands which, at first, can seem very obscure. However, once learned, it provides a concise and powerful way to run commands showing information from the memory dump. To show all of the threads in the dumped process, use the ∼ command (the logic is that it looks a little like a stitch); you can see the output in Figure 14-11. However, there is a problem: much of what happens in the native world is not significant to managed code, and this is especially true in the case of threads. WinDbg on its own has a purely native view of the world. You need to provide WinDbg with a managed code “filter,” and this is the job of sos.dll.
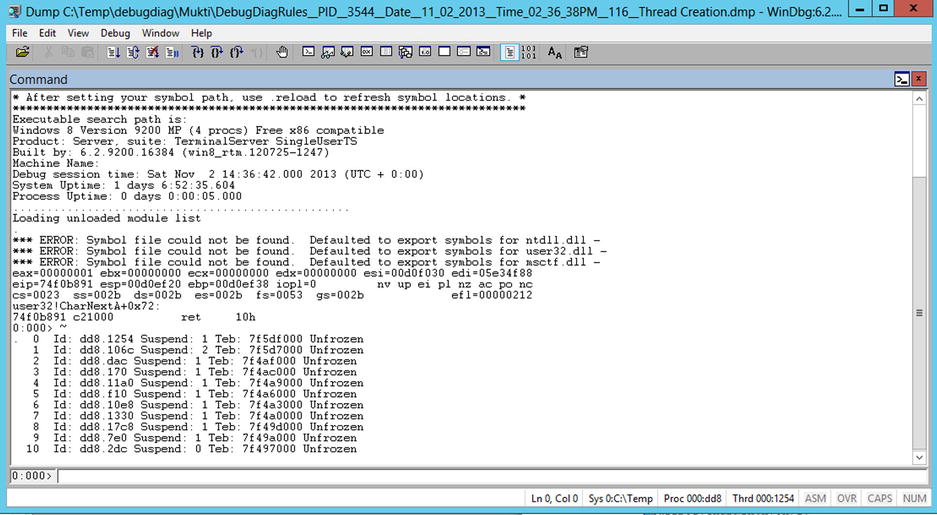
Figure 14-11. WinDbg showing all threads
SOS
During the development of .NET, Microsoft had an internal WinDbg extension called Strike. Realizing that this would be a generally useful tool, they created a derivative version that they called Son of Strike, which ships as sos.dll. SOS is a WinDbg extension that understands the internal data structures of the CLR and provides commands to interrogate those data structures to provide insight into managed execution within a memory dump.
Loading SOS
WinDbg has a .load command for loading extensions. However, SOS ships with the runtime and is installed in the same directory. It is critical that versions of SOS and the runtime match, as each runtime release can change the internal data structures. You therefore have to ensure that you load SOS from the same place as the runtime was loaded. To achieve this, use the .loadby command, which essentially says, “Load this DLL from the same location you got this other DLL.” The core parts of the runtime ship in a DLL called mscorwks.dll prior to .NET 4.0 and clr.dll from version 4.0 onward. It is important therefore to use the right command for the version of the runtime that was loaded when the dump file was generated.
To load SOS prior to .NET 4.0, issue the following command.
.loadby sos mscorwks
And for .NET 4.0 and later, issue this command.
.loadby sos clr
Fortunately, if you choose the wrong command WinDbg will simply say that it cannot find the module. If the .loadby command works, you will see no output as WinDbg only notifies you of failures. Now that you have SOS loaded, you have a new, richer set of commands that understand managed code. All of the SOS commands start with the symbol ! and can be listed using !help.
Examining Threads via SOS
You can see the difference between the native and managed views of the world by running the !threads command on the dump file from Figure 14-10. Figure 14-12 shows the !threads output.
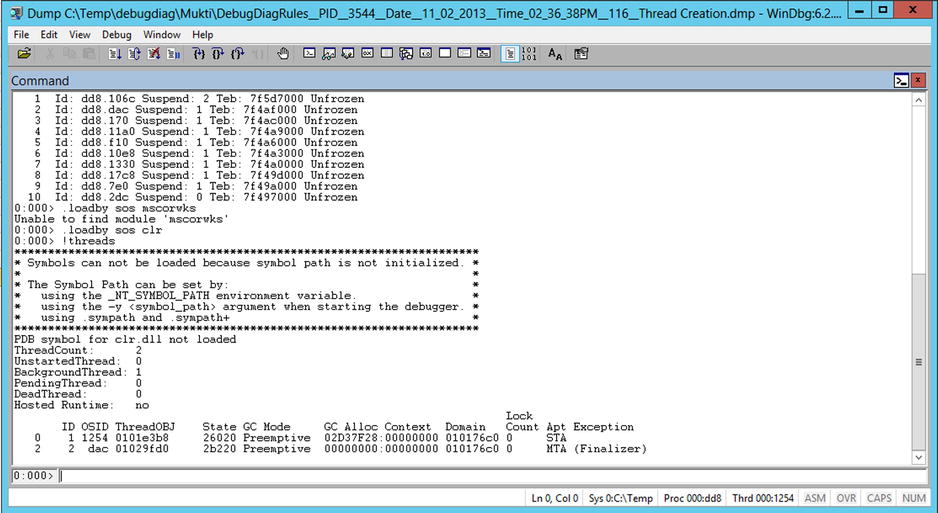
Figure 14-12. The output from !threads
!threads shows, among other things, the WinDbg thread identifier (the first column), which will be useful shortly; the managed thread ID; the operating system thread ID; the address of the associated thread object; a set of bit flags called State; the AppDomain in which the thread is executing (Domain); the number of Monitors owned (Lock Count); the COM apartment type of the thread (Apt); and any unhandled exception objects.
The State bit flags can be interpreted using the !threadstate command passing the State value (see Figure 14-13).
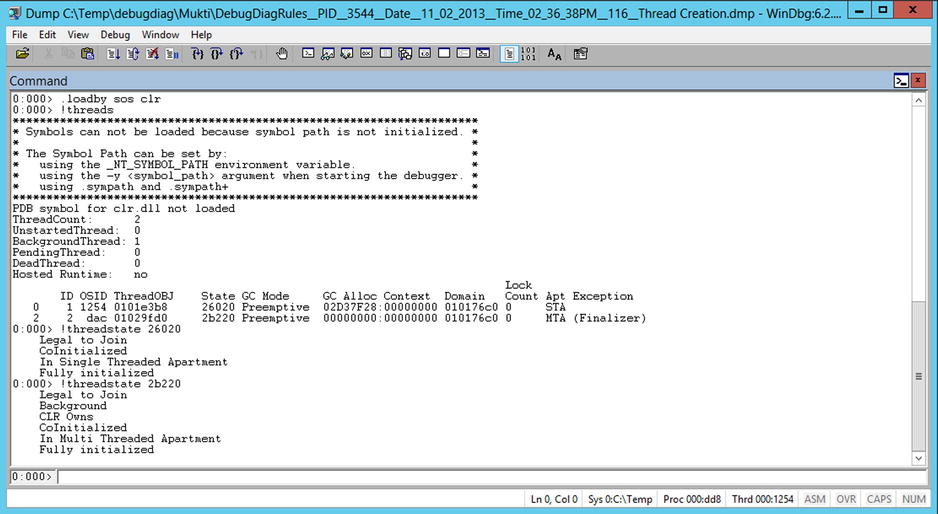
Figure 14-13. Using the !threadstate command
!threads is always a good place to start when analyzing a memory dump, whether the issue is thread related or not, as it provides a lot of context to the analysis very concisely.
Diagnosing Deadlocks with SOS
Finding a deadlock in a production system is one of the key reasons for understanding how to use the non-Visual Studio tool chain. As is often the case, you’ll start by using !threads. You can see the output in Figure 14-14 and you may notice that although there are a large number of threads, only two of them own monitors (the Lock Count column).
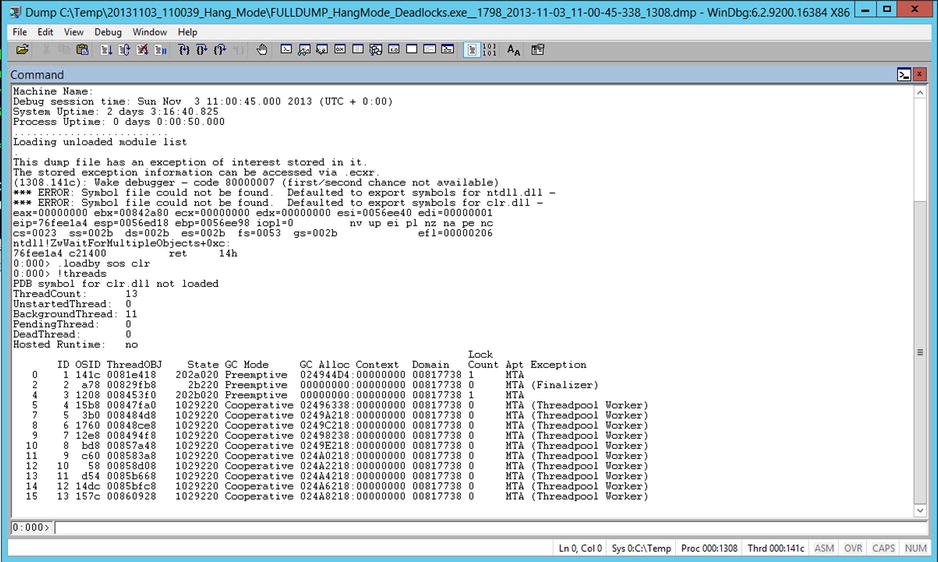
Figure 14-14. !threads when threads own monitors
Threads owning monitors, however, isn’t necessarily an issue, so you need to understand what monitors are being held. You can use the !syncblk command to show which threads own which monitors. You can see the output from !syncblk in Figure 14-15; it shows that thread 0 owns the monitor for the object at the address 024923ac and thread 4 owns the monitor for the object at address 024923b8.
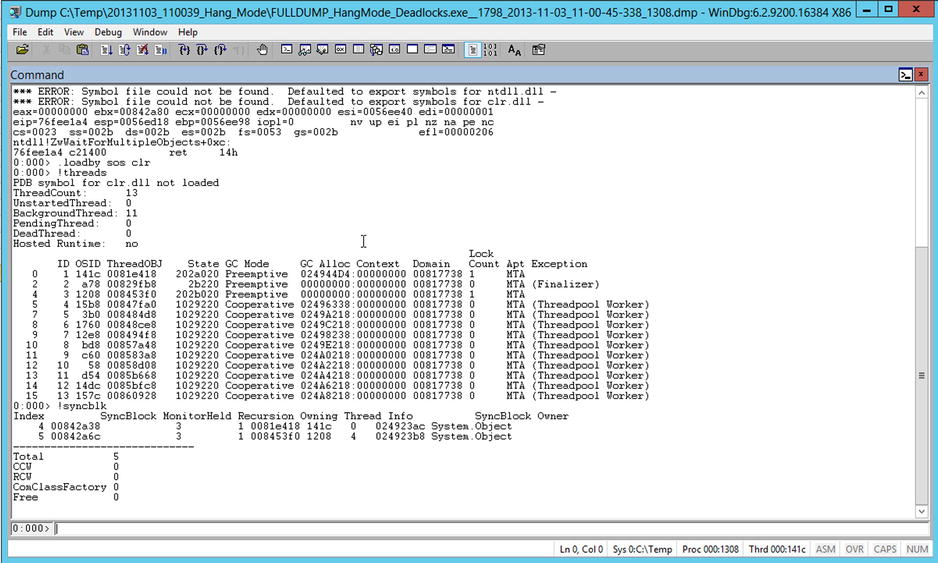
Figure 14-15. Output from !syncblk
Knowing which threads own which monitors is only half of the story; you also need to know if those threads are trying to acquire monitors and, if so, which ones. !clrstack shows the call stack for a thread and with the -a flag can also show parameters that were passed to the methods. However, the JIT compiler can introduce optimizations that hide the parameter information so using the .INI file as described in the “Improving Dump Quality” sidebar may be necessary to get full visibility.
The call stack is obviously thread specific, so how do you get the call stack from threads other than the main thread? If you look at the bottom left of the WinDbg display you will see, by default, the number 0. This is the thread the current commands are executing against. You can use the command ∼#s, where # is the thread number, to switch the current thread (the number in the bottom left changes as a result). You can also use ∼#e to execute a specific command against a specific thread (e.g. ∼3e !clrstack to run !clrstack against thread number 3).
Running !clrstack -a against both threads that own monitors shows that both threads are in the process of calling Monitor.Enter, so if you can verify that they are trying to acquire each other’s owned monitor, you have found your deadlock. However, if optimization is on, or depending on which version of the runtime is being used, !clrstack -a may not show which object was being passed to it. Fortunately those parameters will be at the top of the stack, and it turns out you can show the objects on the stack using !dso against the thread (Figure 14-16).
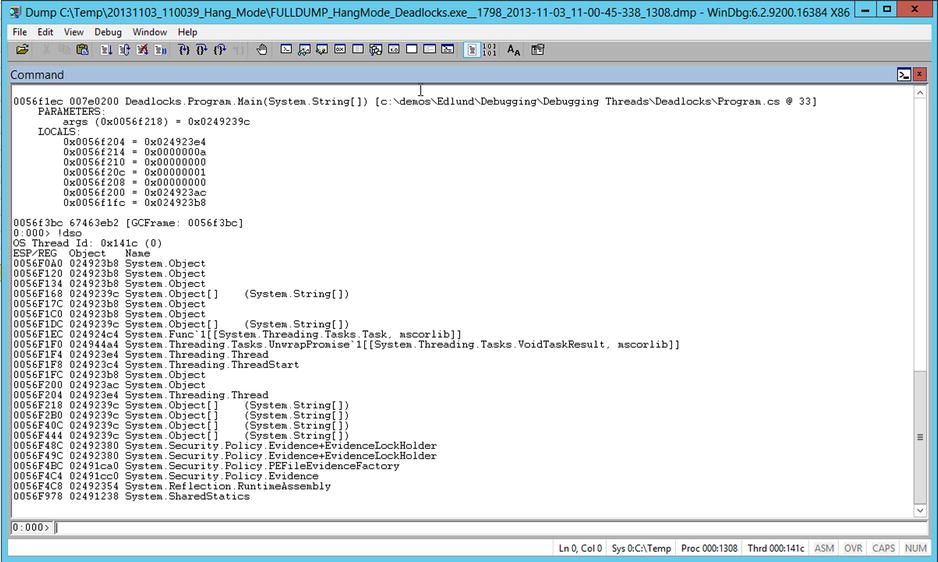
Figure 14-16. The output from !dso
By putting this information together you can see that the data in Figure 14-17 clearly show a thread deadlock.
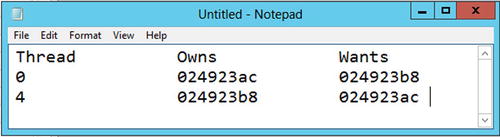
Figure 14-17. Diagnosing the deadlock
Finding Runaway Threads
A runaway thread is one that, for some reason, has started to consume a lot of CPU power on an unproductive task—normally from accidentally ending up spinning in a tight loop. The more cores you have, the harder it is to spot a runaway thread as the percentage of CPU consumed can look quite small. However, with SOS you can see the amount of CPU each thread in a process has used. But as your starting point, use !threads (Figure 14-18).
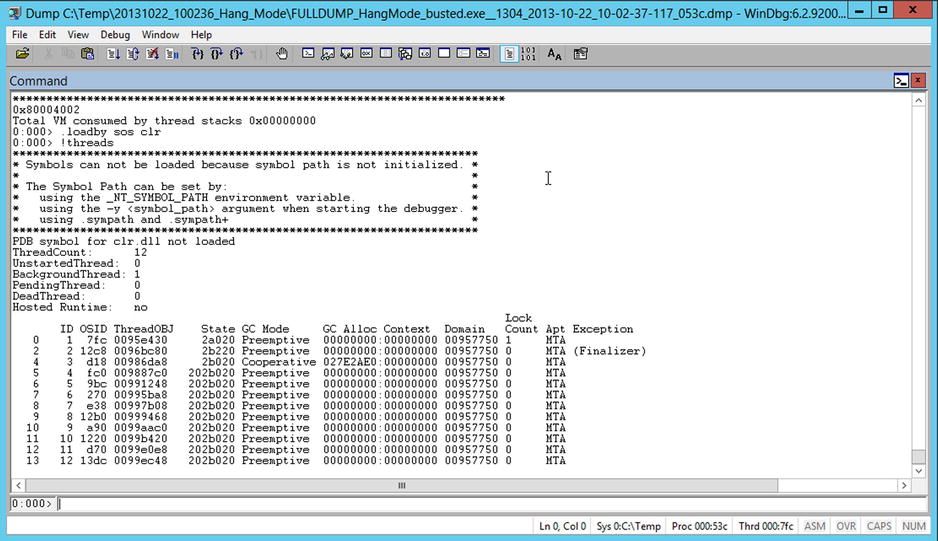
Figure 14-18. Looking for runaway threads
There are a lot of threads running, but Thread 4 does look a little different to the others. If you use the command !runaway you get the CPU usage statistics for each thread, as you can see in Figure 14-19—Thread 4 is definitely spinning in a tight loop. Now, by using !clrstack -a you can start to dig into the thread to work out why it is behaving as it is. Hopefully, with that context, you can look at the code and understand what went wrong.
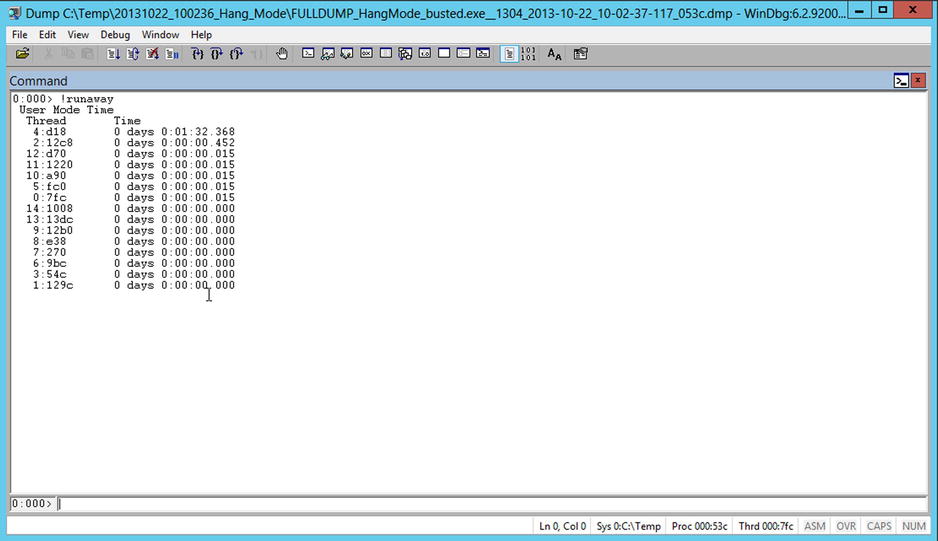
Figure 14-19. Output from !runaway
Other Useful SOS Commands
You’ve seen most of the SOS commands that are critical to analyzing threads. However, there are many more commands that provide useful information, and some of these can be seen in Table 14-1.
Table 14-1. Useful SOS Commands
Command |
Result |
|---|---|
!dumpheap -stat |
Shows all of the types of objects allocated on the managed heap, how many, and how much memory they jointly consume. Can be filtered with -type (!dumpheap -stat -type Exception to find all types with Exception in their name) |
!dumpheap -MT <address> |
Shows all instances of a type identified by the Method Table address shown in !dumpheap -stat |
!do <address> |
Shows all of the fields in specific object |
!objsize <address> |
Shows how much memory an object is directly and indirectly responsible for |
!pe |
Prints details of an unhandled exception object on the current thread |
!gcroot <address> |
Identifies the live roots that are keeping the object from being garbage |
!threadpool |
Shows the number of threads in the pool, the depth of the queue, and how many threadpool timers are running |
SOSEX
SOSEX is an extension on top of SOS that wraps up a series of low-level commands into higher-level operations to solve common problems. It is actively maintained at www.stevestechspot.com. SOSEX drives SOS behind the scenes so it is not bound directly to any version of .NET and, therefore, can be loaded using .load as opposed to .loadby. However, the correct version of SOS must also be loaded.
Using SOSEX
The most directly useful command in SOSEX for the use cases you have seen so far is !dlk, which detects deadlocks. This goes beyond just monitors and also considers reader/writer locks. You can see the deadlock depicted earlier being directly detected by !dlk in Figure 14-20.
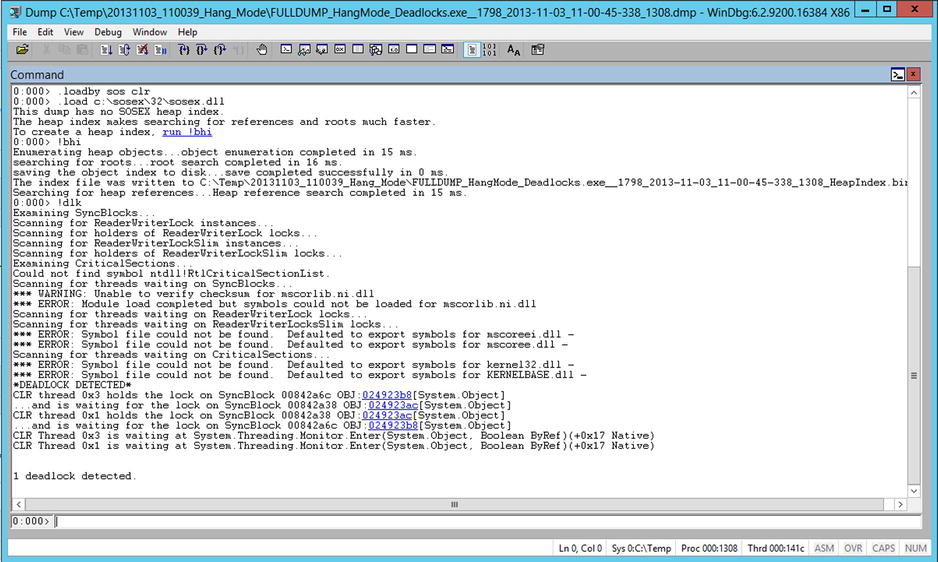
Figure 14-20. !dlk in action detecting a deadlock
Useful SOSEX Commands
There are a number of useful commands in SOSEX to aid in tracking down threading-related issues. Some useful SOSEX commands are listed in Table 14-2.
Table 14-2. Useful SOSEX Commands
Command |
Result |
|---|---|
!dlk |
Automates deadlock detection |
!mlocks |
Finds owned locks for monitors, ReaderWriterLock, ReaderWriterLockSlim, and native critical sections |
!mdso |
Does the same as !dso but provides extra options for filtering to make locating objects on the stack easier |
!rwlock |
Shows details of owned reader/writer locks |
!mk |
Shows stack frames, including transition to native code, which can help if debugging memory dumps that include interop |
!mwaits |
Lists all threads waiting for synchronization primitives and the object on which they are waiting |
PSSCOR
PSSCOR is an alternative to SOS. Its commands are a superset of SOS and some commands display extra useful information. In general it is a good idea to use PSSCOR in preference to SOS; however, its release always lags behind that of SOS, which ships with the runtime. You always know that you can use SOS regardless of whether the runtime version is in beta or just recently released. However, because the responsible team at Microsoft is not bound to the same release cycle as SOS, they can release fixes to bugs far more rapidly. In particular, PSSCOR has extra commands to assist with debugging ASP.NET applications.
Summary
Understanding how to capture memory dumps and then how to analyze them is an important skill for developers who spend a lot of time debugging multithreaded applications. After Visual Studio, this tool chain can seem primitive and obscure. However, there is a lot of power in working at this lower level, and memory dumps can highlight issues that interactive debugging cannot.