
![]()
Parallel Query
Unlike other areas of Exadata, parallel query execution uses the same Oracle Release 11.2 functionality as non-Exadata systems. Because Exadata is, at its heart, a data-warehousing system, and efficient handling and processing of data-warehouse workloads was a primary design goal, parallel query processing is an important feature. Remember that Smart Scans and offloading rely on direct-path reads, the same read functionality that is used by parallel query slaves. In Release 11.2, Oracle has provided three improvements to the earlier attempts at controlling parallel execution. These improvements, along with the processing power of Exadata, make this feature more manageable, more scalable, and less likely to saturate server resources, such as memory and CPU, than earlier releases of the database. The first of those improvements that we will discuss is parallel statement queuing.
Parallel query has been available in Oracle releases since version 7, and, when used with care, can significantly improve statement performance. On the other hand, when overused, it can bring the database server to its knees. Multiple users, all choosing parallel execution, can saturate CPU resources to the point that the benefits of parallel query become the curse of parallel query. Until Release 11.2, there was no way to control parallel execution by multiple users on the same system. That changed with parallel statement queuing. This was implemented because Exadata is a system designed to handle mixed workloads, allowing both data-warehouse and Online Transaction Processing applications to run and ensuring that neither suffers at the hands of the other. With parallel statement queuing, Exadata has a way to both separate the different types of workloads and also “rein in” parallel statements that otherwise would be too resource-intensive for a multiuser system.
Old School
To give some perspective on how parallel statement queuing has improved parallel query performance, it is necessary to examine the tool Oracle provided to manage this feature in earlier releases. The parallel_adaptive_multi_user parameter is quite a powerful tool, but it can create varying performance by deciding, at runtime, whether to parallelize a statement or not. It also determines how many slaves should be employed for a parallelized query. With this mechanism, the parallelism can go down dramatically, depending on the system resources in use at the moment the decision is made, which is the time the execution starts.
Statements can go from having 16 or more parallel slaves for one execution to having absolutely none the next time the same statement is executed. Remember that once the degree of parallelism (DOP) is set, it cannot be altered; the statement must run to completion at the assigned DOP, which may be one. The statement also cannot benefit from resources freed during its execution; if ten parallel query slaves become available during the serial execution of that statement, they cannot be repurposed to provide a higher DOP and, as a result, a shorter execution time.
As an example, you have a statement that was assigned 24 parallel query slaves the last time it was run, with a resulting execution time of 1 minute. A short spike in activity occurs at the time this statement starts its next execution, downgrading it to a serial operation. Several seconds later, this spike is over; the statement is stuck, executing serially for possibly 24 minutes or longer. With no apparent rhyme or reason for this seemingly erratic behavior (from the user’s perspective), such inconsistent performance can make for unhappy users and very confused, unhappy developers.
The New Method
Parallel adaptive multi user was a good start at controlling parallel execution, based on available resources, but version 11.2 introduces parallel statement queuing to the mix, allowing parallel execution to be placed on hold, until sufficient resources become available.
![]() Note It is best to set parallel_adaptive_multi_user to FALSE to prevent these two features from conflicting with each other. When both are enabled, we have seen parallel queries take much longer to execute.
Note It is best to set parallel_adaptive_multi_user to FALSE to prevent these two features from conflicting with each other. When both are enabled, we have seen parallel queries take much longer to execute.
How it works is simple, really. Enable the feature by setting parallel_degree_policy to AUTO. Next, set parallel_servers_target to the number of parallel slaves you want. The easy part is that you run your queries; Oracle takes care of the rest for you. In basic terms, a statement will be queued if it will require more parallel slaves than there are currently available. Once the required number of slaves are freed, the statement executes.
The V$SQL_MONITOR and GV$SQL_MONITOR views report on the execute status of submitted statements; basically, these views report that a statement is DONE (in some form), EXECUTING, or, if parallel statement queuing is enabled, QUEUED. Given that information, it isn’t difficult to see which statements are waiting in the parallel statement queue. The standard EMP table from the demobld.sql script was used, although it was loaded with a very large number of records:
SQL> select count(*)
  2  from emp;

     COUNT(*)
-------------
  15032385536

SQL>
We chose to select the average salary from our large version of the EMP table from 12 different sessions. We then queried V$SQL_MONITOR to see how many of those sessions ended up in the queue. The query produced the following output:
SQL> select sid, sql_id, sql_exec_id, sql_text
  2  from v$sql_monitot monitor
  3  where status = 'QUEUED'
  4  order by 3;

       SID SQL_ID        SQL_EXEC_ID SQL_TEXT
---------- ------------- ----------- ------------------------------------
      1532 5du23va3p3ad0    16777216 select avg(sal) from emp
      1059 5du23va3p3ad0    16777217 select avg(sal) from emp
      1628 5du23va3p3ad0    16777218 select avg(sal) from emp
       865 5du23va3p3ad0    16777219 select avg(sal) from emp
       205 5du23va3p3ad0    16777220 select avg(sal) from emp
      2199 5du23va3p3ad0    16777221 select avg(sal) from emp
      1542 5du23va3p3ad0    16777222 select avg(sal) from emp
       159 5du23va3p3ad0    16777223 select avg(sal) from emp
      1888 5du23va3p3ad0    16777224 select avg(sal) from emp
      1234 5du23va3p3ad0    16777225 select avg(sal) from emp
       705 5du23va3p3ad0    16777226 select avg(sal) from emp

11 rows selected.

SQL>
The sql_exec_id is, basically, a run number indicating the statement’s position in the queue. It is also possible for the sql_exec_id to be the same for all queued statements (indicating simultaneous execution), if the sum of the parallel resources required for execution doesn’t exceed the maximum available for the database.
There may be times when you want to have some control over parallel statement queuing behavior. If you simply turn it on and let it run, it’s a first-in, first-out (FIFO) queue. It’s possible to bypass the queue using a hint. It’s also possible to use parallel statement queuing, even if the feature isn’t enabled at the database level.
Two parameters are available that can affect parallel statement queuing, and the foremost of those is parallel_servers_target. The value for this parameter sets the number of parallel server processes Oracle can run before placing statements in the queue. There is a formula for computing the default value, as follows:
((4*cpu_count)*parallel_threads_per_cpu)*active number of instances
Given an Exadata X3-2 with the following settings:
cpu_count 24
parallel_threads_per_cpu 4
and two active instances, the default setting would be computed as follows:
((4*24)*4)*2 = 768
This is a value that is much higher than you’d ever want to set; the calculation, as written, will compute a value intended to utilize all of the available resources for parallel query processes. Also, a setting that high would seriously impact OLTP transactions, as they could possibly starve, should a long-running, resource-intensive parallel query commandeer the available CPU and memory.
Like pga_aggregate_target, this parameter sets a target value, not a limit. There can be more parallel server processes running than the parameter initially configures. This can occur because the number of parallel slaves assigned to a statement may be up to twice the DOP setting. As an example, a system has parallel_servers_target set to 4 and Auto DOP set a degree of parallelism of 4. The statement could have up to 8 parallel query processes attached to it, which is greater than the target setting. Parallel query processes are assigned, in part, based on available resources, so occasionally, exceeding the parallel_servers_target setting isn’t a problem. The statement may end up in the parallel statement queue, but it won’t fail to run, because it’s using more parallel query slaves than parallel_servers_target would lead you to believe are allowed.
The second parameter to affect parallel statement queuing is a hidden parameter, _parallel_statement_queuing. The values for this parameter are TRUE and FALSE, with TRUE being the default setting when parallel_degree_policy is set to AUTO. It can be set independently of parallel_degree_policy, to enable and disable this feature.
Even when parallel statement queuing is active it’s possible to bypass the queue entirely, with a hint. The NO_STATEMENT_QUEUING hint allows you to immediately execute parallel queries that otherwise would have been placed into the queue. Checking the queue for them is fruitless, as they do not appear with a status of “QUEUED.” Querying V$SQL/GV$SQL joined to V$SESSION/GV$SESSION will reveal that they are, indeed, running. Not only do they jump the queue, they also can spawn parallel query slaves in excess of the setting for parallel_servers_target.
If you don’t have parallel statement queuing enabled, you can still use it with another hint: STATEMENT_QUEING. This will queue statements, should parallel resoures be scarce at the time the statement starts execution.
In addition to parallel statement queuing (which we just covered), Oracle has provided automatic degree of parallelism (Auto DOP) and in-memory parallel execution. All three are enabled when parallel_degree_policy is set to AUTO. Auto DOP allows the database to calculate the degree of parallelism on a query-by-query basis; we will discuss this in more detail in a separate section. This is the one improvement that requires a bit of effort to get working, as Oracle won’t activate this feature, if the I/O system has not been calibrated.
We will discuss I/O calibration in more detail later on in this chapter. For now, you should know that it’s not a task to be executed during business hours.
I/O calibration is just one part of parallel query processing configuration; several database initialization parameters control some aspect of parallel query execution. These parameters, their settings, and which features or aspects of parallel query execution they affect are listed in Table 5-1.
Table 5-1. Parameters Affecting Parallel Query Execution
Name |
Default |
Description |
|---|---|---|
| parallel_adaptive_multi_user | TRUE | Enable adaptive setting of degree for multiple-user streams. |
| parallel_automatic_tuning | FALSE | Enable intelligent defaults for parallel execution parameters. |
| parallel_degree_limit | CPU | Limit placed on degree of parallelism. Values range from CPU, I/O, and an integer value of 2 or greater. |
| parallel_degree_policy | MANUAL | Policy used to compute the degree of parallelism (MANUAL/LIMITED/AUTO). |
| parallel_execution_message_size | 16384 | Message buffer size for parallel execution. |
| parallel_force_local | FALSE | Force single-instance execution. |
| parallel_instance_group | Instance group to use for all parallel operations. Can restrict parallel operations to a subset of the RAC instances available. | |
| parallel_io_cap_enabled | FALSE | Enable capping of DOP by I/O bandwidth. |
| parallel_max_servers | 240 | Maximum parallel query servers per instance. |
| parallel_min_percent | 0 | Minimum percent of threads required for parallel query. |
| parallel_min_servers | Minimum parallel query servers per instance. | |
| parallel_min_time_threshold | AUTO | Threshold above which a plan is a candidate for parallelization (in seconds). Can also be set to a numeric value, including 0. |
| parallel_servers_target | 240 | Instance target in terms of number of parallel servers. |
| parallel_threads_per_cpu | 2 | Number of parallel execution threads per CPU. Used in various parallel query computations. |
Parallel statement queuing and in-memory_parallel execution rely on the parallel_servers_target and the parallel_min_time_threshold parameter settings. We have discussed parallel statement queuing at the beginning of this chapter; in-memory parallel execution will be discussed in its own section.
My Friend Auto
Auto DOP is a change in parallel operations introduced in Oracle Release 11.2. In prior releases of the database, parallel operations relied on hints at the query level or on the DEGREE and INSTANCES settings for the object in use. It is an unfortunate reality that a single DOP setting is rarely appropriate for all queries, at all times, for a given object. Arriving at usable values for the DOP that makes the query execution more efficient than serial execution and doesn’t adversely impact other queries and statements is a time-consuming trial-and-error process. It requires the development team to understand the platform in use and the workload that the system will be experiencing when the statement is executed. Another issue with the DOP: it cannot change during statement execution. Auto DOP was designed to overcome such problems, and it’s done its job admirably.
Calibrate Me
Auto DOP, when enabled and activated, causes Oracle to evaluate each statement, to determine if it should run in parallel. The DOP is set once this decision has been made.
![]() Note It is important to note that simply enabling Auto DOP doesn’t get it working; it needs to be activated by running an I/O calibration in each database where you want Auto DOP available.
Note It is important to note that simply enabling Auto DOP doesn’t get it working; it needs to be activated by running an I/O calibration in each database where you want Auto DOP available.
The optimizer evaluates serial execution time and, in general, if that estimated time exceeds the setting for parallel_min_time_threshold , the statement will be executed in parallel. By default, this parameter is set to AUTO, providing a threshold value of 10 seconds. This parameter can be altered at the system level or at the session level, to implement a lower or higher parallel triggering threshold.
A supplied package, DBMS_RESOURCE_MANAGER, provides the CALIBRATE_IO procedure that is used to generate a random read-only workload across all RAC instances on the cluster. The procedure takes five parameters, two input values (number of disks and maximum estimated disk latency), and three output variables to receive the computed values for maximum I/Os per second, the maximum megabytes per second, and the calculated latency. An anonymous PL/SQL block can be used to call the procedure and return the computed metrics, as follows:
Set serveroutput on size 1000000
Declare
        Calc_lat        number;
        Calc_iops       number;
        Calc_mbps       number;
Begin
        Dbms_resource_manager.calibrate_io(&dsks,&maxlat, Calc_iops, Calc_mbps, Calc_lat);

        Dbms_output.put_line('Max IOPS          : '||Calc_iops);
        Dbms_output.put_line('Max mbytes-per-sec: '||Calc_mbps);
        Dbms_output.put_line('Calc. latency     : '||Calc_lat);
End;
/
As stated earlier in the chapter, before Auto DOP is activated, the I/O system has to be calibrated. This must be done for each different database running on the Exadata system.
![]() Note It cannot be stressed enough that I/O calibration is a resource-intensive operation and should not be run on a system experiencing heavy workloads. This is an “after-hours” operation that will take about 15 minutes or more to run. Your patience will be rewarded when Auto DOP is functional.
Note It cannot be stressed enough that I/O calibration is a resource-intensive operation and should not be run on a system experiencing heavy workloads. This is an “after-hours” operation that will take about 15 minutes or more to run. Your patience will be rewarded when Auto DOP is functional.
A view, V$IO_CALIBRATION_STATUS , reports whether or not this calibration has been run. A database in need of calibration will show these results when V$IO_CALIBRATION_STATUS is queried:
SQL> select *
  2  from v$io_calibration_status;

STATUS        CALIBRATION_TIME
------------- -----------------------------------------------------------
NOT AVAILABLE

SQL>
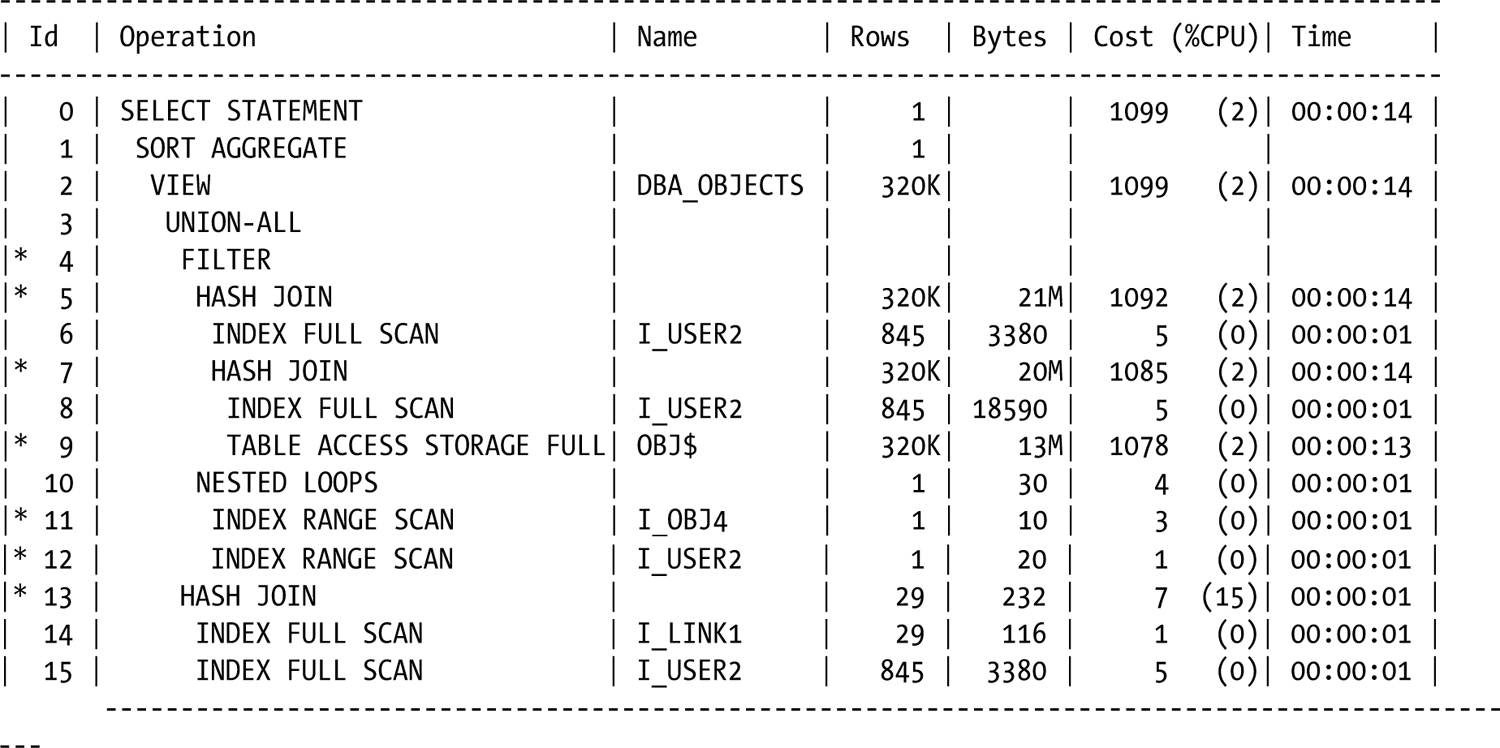
Queries that would be executed in parallel on calibrated systems run serially on databases that have not had I/O calibration run. The execution plan returns an informative message about the Auto DOP calculations, immediately visible after query execution when autotrace is enabled:
SQL> select count(*)
  2  from dba_objects
  3  /

  COUNT(*)
----------
    369952

Execution Plan
----------------------------------------------------------
Plan hash value: 3660875064


        Predicate Information (identified by operation id):
        ---------------------------------------------------

4 - filter("O"."TYPE#"<>4 AND "O"."TYPE#"<>5 AND "O"."TYPE#"<>7 AND "O"."TYPE#"<>8
           AND "O"."TYPE#"<>9 AND "O"."TYPE#"<>11 AND "O"."TYPE#"<>12 AND "O"."TYPE#"<>13 AND
           "O"."TYPE#"<>14 AND "O"."TYPE#"<>22 AND "O"."TYPE#"<>87 AND "O"."TYPE#"<>88 OR
           BITAND("U"."SPARE1",16)=0 OR ("O"."TYPE#"=4 OR "O"."TYPE#"=5 OR "O"."TYPE#"=7 OR
           "O"."TYPE#"=8 OR "O"."TYPE#"=9 OR "O"."TYPE#"=10 OR "O"."TYPE#"=11 OR "O"."TYPE#"=12
           OR "O"."TYPE#"=13 OR "O"."TYPE#"=14 OR "O"."TYPE#"=22 OR "O"."TYPE#"=87) AND
           ("U"."TYPE#"<>2 AND SYS_CONTEXT('userenv','current_edition_name')='ORA$BASE' OR
           "U"."TYPE#"=2 AND "U"."SPARE2"=TO_NUMBER(SYS_CONTEXT('userenv','current_edition_id'))
           OR  EXISTS (SELECT 0 FROM SYS."USER$" "U2",SYS."OBJ$" "O2" WHERE "O2"."TYPE#"=88 AND
           "O2"."DATAOBJ#"=:B1 AND "U2"."TYPE#"=2 AND "O2"."OWNER#"="U2"."USER#" AND
           "U2"."SPARE2"=TO_NUMBER(SYS_CONTEXT('userenv','current_edition_id')))))
5 - access("O"."SPARE3"="U"."USER#")
7 - access("O"."OWNER#"="U"."USER#")
9 - storage("O"."LINKNAME" IS NULL AND "O"."TYPE#"<>10 AND
           BITAND("O"."FLAGS",128)=0 AND "O"."NAME"<>'_NEXT_OBJECT' AND
           "O"."NAME"<>'_default_auditing_options_')
     filter("O"."LINKNAME" IS NULL AND "O"."TYPE#"<>10 AND BITAND("O"."FLAGS",128)=0
           AND "O"."NAME"<>'_NEXT_OBJECT' AND "O"."NAME"<>'_default_auditing_options_')
11 - access("O2"."DATAOBJ#"=:B1 AND "O2"."TYPE#"=88)
12 - access("O2"."OWNER#"="U2"."USER#" AND "U2"."TYPE#"=2 AND
           "U2"."SPARE2"=TO_NUMBER(SYS_CONTEXT('userenv','current_edition_id')))
      filter("U2"."SPARE2"=TO_NUMBER(SYS_CONTEXT('userenv','current_edition_id')))
13 - access("L"."OWNER#"="U"."USER#")

Note
-----
   - automatic DOP: skipped because of IO calibrate statistics are missing

Statistics
----------------------------------------------------------
         17  recursive calls
          2  db block gets
       4788  consistent gets
       4772  physical reads
          0  redo size
        528  bytes sent via SQL*Net to client
        524  bytes received via SQL*Net from client
          2  SQL*Net roundtrips to/from client
          0  sorts (memory)
          0  sorts (disk)
          1  rows processed

SQL>
Running the calibration process is simple and straightforward, and we pass to our script the number of disks and an expected latency of 10. The procedure returns the actual latency, along with the maximum IOPs and the maximum megabytes per second the storage system can support:
SQL> @calibrate_io
Enter value for dsks: 36
Enter value for maxlat: 10
old   7:    dbms_resource_manager.calibrate_io (&dsks, &maxlat, Calc_iops, Calc_mbps, Calc_lat);
new   7:    dbms_resource_manager.calibrate_io (36, 10, Calc_iops, Calc_mbps, Calc_lat);
Max IOPS          : 1022
Max mbytes-per-sec: 2885
Calc. latency     : 11

PL/SQL procedure successfully completed.

Elapsed: 00:07:10.57
SQL>
Once this calibration has completed, a query of V$IO_CALIBRATE_STATUS reports a different result than it did previously:
SQL> select *
  2  from v$io_calibration_status;

STATUS        CALIBRATION_TIME
------------- -----------------------------------------------------------
READY         08-APR-13 11.24.49.977 AM

SQL>
If you query V$IO_CALIBRATION_STATUS during an I/O calibration run, the view will report results similar to the following output:
SQL> select *
  2  from v$io_calibration_status;

STATUS        CALIBRATION_TIME
------------- -----------------------------------------------------------
IN PROGRESS   01-APR-12 09.34.13.083 AM

SQL>
The CALIBRATION_TIME value reported will be from the previous run; it’s the IN PROGRESS status that lets you know that I/O calibration is running.
Querying DBA_RSRC_IO_CALIBRATE reveals all the current calibration statistics recorded after a completed run:
SQL> select num_physical_disks, max_iops, max_mbps, max_pmbps, latency
  2  from dba_rsrc_io_calibrate;

NUM_PHYSICAL_DISKS   MAX_IOPS   MAX_MBPS  MAX_PMBPS    LATENCY
------------------ ---------- ---------- ---------- ----------
                36       1022       2885        289         11

SQL>
After I/O calibation has been successfully completed, if the query or statement in question meets or exceeds the serial execution time represented by the parallel_min_time_threshold parameter, then Auto DOP will set the degree of parallelism, regardless of whether any of the objects are explicitly set for parallel execution. You may find that once I/O calibration is completed, some tasks may take longer to complete because they are queued. This may occur because the parallel resources allocated may not be sufficient for all the queries and statements that qualify for parallel execution. There is a Metalink Note, document id 1393405.1, that explains how to delete the I/O calibration statistics. In summary, there is a single table, RESOURCE_IO_CALIBRATE$, that the two views are based on. Deleting the data from this table clears the I/O calibration statistics, so that Auto DOP will no longer function. Statements in the queue at the time the statistics are deleted will remain in the queue until executed; no additional statements will be queued after the I/O calibration statistics are deleted. This is not as drastic a measure as it may appear at first, because DBMS_RESOURCE_MANAGER.CALIBRATE_IO deletes any existing I/O calibration values before it generates the current statistics, using this same statement, as a portion of the tkprof output shows:
SQL ID: bzhku92rujah0 Plan Hash: 256968859

delete from resource_io_calibrate$


call     count       cpu    elapsed       disk      query    current        rows
------- ------  -------- ---------- ---------- ---------- ----------  ----------
Parse        1      0.01       0.00          0          0          0           0
Execute      1      0.00       0.00          0          1          0           0
Fetch        0      0.00       0.00          0          0          0           0
------- ------  -------- ---------- ---------- ---------- ----------  ----------
total        2      0.01       0.00          0          1          0           0

Misses in library cache during parse: 1
Optimizer mode: ALL_ROWS
Parsing user id: SYS   (recursive depth: 1)
Number of plan statistics captured: 1

Rows (1st) Rows (avg) Rows (max)  Row Source Operation
---------- ---------- ----------  ---------------------------------------------------
         0          0          0  DELETE  RESOURCE_IO_CALIBRATE$ (cr=1 pr=0 pw=0 time=26 us)
         0          0          0  TABLE ACCESS FULL RESOURCE_IO_CALIBRATE$ (cr=1 pr=0 pw=0 time=21
                                  us cost=2 size=0 card=1)
********************************************************************************
Make It So
I/O calibration isn’t the only factor in enabling Auto DOP, as the parameter parallel_degree_policy must be set to AUTO or LIMITED. By default, it is set to MANUAL, which disables the three parallel features of Oracle Release 11.2: Auto DOP, parallel statement queuing, and in-memory parallel execution. The three available settings, and their effects on these features, are listed in Table 5-2.
Table 5-2. How parallel_degree_policy Settings Affect Parallel Execution
Setting |
Effect |
|---|---|
| MANUAL | Disables all three new parallel query features. Causes parallel processing reverts to the behavior of prior releases, parallelizing statements only if they are hinted or the object being queried is created with or altered to have a DEGREE greater than the default of 1. |
| LIMITED | Only Auto DOP is enabled with this setting; the remaining two new parallel features are disabled. With this setting, only queries against objects associated with a DEGREE of DEFAULT will be considered. |
| AUTO | All three new parallel features are enabled. Queries and statements will be evaluated for parallel execution, regardless of the DEGREE setting on the object or objects accessed. |
Another parameter, this one “hidden,” that affects one of the new features is _parallel_statement_queueing . When set to TRUE (the default), queuing is enabled, which allows Oracle to decide if a parallel statement can be executed at runtime or if it needs to wait in the queue until sufficient resources are available. And yet another “hidden” parameter, _parallel_cluster_cache_policy, controls whether in-memory parallel execution is available or not. A setting of cached enables this feature. On Exadata, this feature can be less useful; when it is enabled, the Smart Scan optimizations will not be available when the buffer cache is scanned. It’s a choice of whether to use the full power of Smart Scans against the buffer cache or use in-memory parallel execution. This primarily applies to data warehouse workloads, as OLTP processes rarely require parallel processing. You should be aware, though, that Smart Scans accessing the buffer cache can be affected when in-memory parallel execution is configured.
With parallel_degree_policy set to AUTO, it doesn’t matter if objects are created with a DEGREE greater than one, as the database decides which statements to run in parallel, how many parallel slaves to execute, and even how many RAC nodes to involve in the process. This is the beauty and power of Auto DOP.
Do It in Memory
The third parallel feature, in-memory parallel execution , can improve query performance when Smart Scans are not used. It is designed to use the buffer cache, is cluster aware, and can utilize all available RAC nodes. It is enabled when parallel_degree_policy is set to AUTO. Other parameters that can affect In-memory parallel execution are parallel_servers_target, pzrallel_min_time_threshold, parallel_degree_limit, and parallel_degree_policy. Low values for parallel_servers_target, parallel_degree_limit, and parallel_min_time_threshold make it more likely for in-memory parallel execution to run. Additionally, the parallel_force_local parameter can be set to TRUE to reduce the available parallel resources to only those on the local server that can also favor in-memory parallel execution. Non-parallel parameters that affect this improvement are sga_max_size and sga_target, which control the buffer cache size, among other areas of the SGA. Larger cache sizes can accommodate larger tables in memory, which can also make it more likely for this feature to run. Setting these parameters to low values can’t guarantee that this feature will run, but you may have a better chance of using it, if you scale back these settings.
While it is true that memory is much faster than disk, a Smart Scan is designed to be fast and efficient when accessing data on disk. Column Projection and Predicate Filtering greatly reduce the volume of data processed by the database tier, speeding the query along. But if all of the data could be loaded and processed in memory, the execution time would be a fraction of the time it would take to process the same volume of data read from disk.
There are benefits to in-memory parallel execution.
- Physical I/O is essentially eliminated.
- Traffic between the database servers and the storage cells is eliminated.
- There is far lower latency for memory, as compared to either disk or flash storage.
These benefits cannot be taken alone, however, because the available resources of CPU and memory have to be considered. Functions that would be offloaded to the storage cells (data filtering and data decompression) during Smart Scan execution fall to the database servers to perform. This can increase the CPU cycles required to process data, and without the additional CPUs and memory of the storage servers, it can put a strain on database server performance. There is a chance that you will have these resources to spare, and an equally likely chance that you do not. Whether or not to use this feature is a decision only you can make, after carefully considering all the facts.
None of the Exadata systems we have worked on use in-memory parallel execution. This is likely a good thing, if the majority of queries use Smart Scans, because, as mentioned previously, none of the Smart Scan optimizations are available. Yes, it would eliminate disk I/O, but it also eliminates the extra CPUs the storage servers would provide for data filtering, decompression, and other operations. Even though it looks good in concept, on an Exadata system, using in-memory parallel execution could be less efficient than using a Smart Scan, because, in a Smart Scan, the storage servers share the workload and reduce the volume of data the database tier processes. In addition, queries that would see the greatest benefit would be those that normally wouldn’t use a Storage Index, placing the entire table into memory. On Exadata systems where a good number of queries and statements don’t use Smart Scans, and the tables are sized to fit entirely in the buffer cache, in-memory parallel execution could improve performance by eliminating disk I/O (in the form of physical reads), in favor of memory access (by using logical reads).
As noted earlier, when parallel_degree_policy is set to AUTO, all three of the parallel features are enabled. If you want to disable in-memory parallel execution, this can be done in one of two ways: either by setting parallel_degree_policy to MANUAL (a setting that disables all of the features) or by setting a hidden parameter, _parallel_cluster_cache_policy, to ADAPTIVE, which preserves availability of the Auto DOP and parallel statement queuing features. When Auto DOP is active, _parallel_cluster_cache_policy will be set to CACHED.
In-memory parallel execution is not the easiest feature to get to work on Exadata. We have yet to get it to function on our systems, even when setting unusually low thresholds for parallel_min_time_threshold, parallel_servers_target, and parallel_degree_limit. It also requires that an entire table fit into the buffer cache, which is not an easy accomplishment. Add to that the fact that the database servers are performing all the work, without the assistance of a Smart Scan to eliminate possibly large volumes of data, and it may be that a Smart Scan is really a better path to take. Again, the decision is one only you can make, after considering all aspects of both Smart Scan and in-memory parallel execution and the current workload on your system.
Things to Know
Parallel query processing is not exclusive to Exadata; it uses the same functionality available to any installation of Oracle 11.2. What makes it especially beneficial to Exadata is the fact that Exadata was designed, in the beginning, to support data warehousing, where parallel processing is utilized frequently.
There are three new features of parallel query processing that change how parallel queries perform. These are automatic degree of parallelism (Auto DOP), parallel statement queuing, and in-memory parallel processing. Of the three, the first two provide the greatest benefit to Exadata.
Auto DOP does just what its name suggests: it computes the degree of parallelism automatically based on available resources and system load. It is not enabled by default. An initialization parameter, parallel_degree_policy, must be set to AUTO or LIMITED to enable Auto DOP. By default, this parameter is set to MANUAL. When this parameter is set to AUTO, then all three new parallel query features are enabled.
I/O calibration is a must to get Auto DOP to function, and a provided procedure, DBMS_RESOURCE_MANAGER.CALIBRATE_IO, is used to generate and record the calibration data. Although it’s fairly simple to execute, it is a time-consuming and resource-intensive operation and should not be attempted on a heavily used system.
I/O calibration results are visible in the V$IO_CALIBRATION_STATUS and DBA_RSRC_IO_CALIBRATE views. The results are stored in the RESOURCE_IO_CALIBRATE$ table. When a query to V$IO_CALIBRATION_STATUS returns a status of NOT AVAILABLE, this indicates that I/O calibration has not been run. A status of COMPLETED, along with the completion date, proves the existence of valid calibration data.
There may be performance issues after enabling Auto DOP, such as queries taking a longer overall time to complete. It is possible to delete the I/O calibration statistics by deleting from the RESOURCE_IO_CALIBRATE$ table. This is not as drastic an action as it may first appear, as the DBMS_RESOURCE_MANAGER.CALIBRATE_IO procedure first executes this delete before generating new calibration data.
Parallel statement queuing is enabled through the following initialization parameters:
parallel_degree_policy
parallel_servers_target
Remember that setting parallel_degree_policy to AUTO enables all three new parallel query features, which is the only way to enable parallel statement queing. The parallel_servers_target should be set to the desired number of parallel slaves, which should be allowed. It is not, however, a hard limit, as this setting can be exceeded in some cases, because Auto DOP can set a number of parallel slaves, which is double the assigned DOP. It is not a common occurrence, so it’s not an issue, should it happen.
The V$SQL_MONITOR and GV$SQL_MONITOR views record which statements are in the parallel statement queue. A status of QUEUED indicates which statements are waiting in the statement queue. In addition to reporting which statements are in the queue, these views also record the SQL_EXEC_ID, which indicates the order in which the queued statements will be executed. Normally, this is sequentially assigned, but if several of the queued statements can be executed in parallel simultaneously, the SQL_EXEC_ID can show the same value for several entries.
It is possible to control parallel statement queuing. Changing the value for parallel_servers_target affects when statements will be queued. A low value for parallel_servers_target can cause more statements to be queued, as the available parallel query resources have been reduced. Increasing this value can allow more statements to process before the queue is populated. Another way to control queuing is through hints. Parallel statement queuing can be bypassed for a statement, if the NO_STATEMENT_QUEUING hint is used. The hinted statement will bypass the statement queue, if the available resources are low enough to have caused it to be placed there and run immediately at the computed DOP. This is one case when the value for parallel_servers_target can be exceeded.
If parallel statement queuing is not enabled, by setting parallel_degree_policy to LIMITED or MANUAL or by setting the hidden parameter _parallel_statement_queuing to FALSE, selected statements can still be queued, using the STATEMENT_QUEUING hint. Using this hint causes Oracle to behave as though parallel statement queuing is enabled, but only affects statements that utilize this hint. This is useful when you want parallel statement queuing enabled only for statements you choose to queue if their parallel execution would impede the processing of other statements that are more important to the business.
In-memory parallel execution is the third new feature, and it’s probably not one that most queries on Exadata would utilize. There is both good and bad to this feature. The good is the elimination of disk I/O, traffic between the database servers and the storage cells, and the fact that memory has a far lower latency than either disk or flash storage. The bad, on Exadata, is that because the disk I/O is eliminated, the Smart Scan optimizations are no longer available, the database servers must do all of the work of filtering and decompressing data, and the number of available CPUs diminishes as the storage servers are no longer involved in the query processing.
In-memory parallel execution can be disabled either by setting another hidden parameter, _parallel_cluster_cache_policy, to ADAPTIVE or by setting parallel_degree_policy to MANUAL, which turns off all of the new parallel query features.
In-memory parallel execution is rarely found on Exadata systems. It may be possible to have a query that would benefit more from in-memory parallel execution than by using a Smart Scan, but we haven’t seen that happen on Exadata systems we support.