
![]()
Monitoring Exadata
Exadata is a complex system of interrelated components; monitoring them effectively is both an art and a science. Throughout this book, we have discussed monitoring options for various areas of Exadata. In this chapter, we will take this topic further and provide ways to monitor Exadata across both the database nodes and the storage cells. We will see how V$SQL and V$SQLSTATS can be used to monitor SQL statement performance and provide information on Smart Scan activity. We’ll also look at the storage cells again, comparing the monitoring capabilities of the command-line interfaces and those of Oracle Enterprise Manager (OEM). We’re not promising to make you a combination of Einstein and Rembrandt, but we will help you understand the available tools and techniques, so you can intelligently monitor your system.
This is the layer the users will access, so we feel it’s a logical starting point for a discussion on monitoring. We’ve discussed the wait interface in Chapter 7 and performance in Chapter 8. Now it’s time to put them together and formulate a monitoring strategy.
Exadata’s big selling point is the Smart Scan, and knowing what queries will and won’t qualify for a Smart Scan is important. We covered these in Chapter 2, along with some monitoring steps, to see if Smart Scans were being executed. We will revisit that topic in the next section, using the V$SQL and V$SQLSTATS views.
Are We There Yet?
Exadata provides a wealth of metrics, counters, and statistics designed to report on what the system is doing for a given task. Simply because these metrics exist doesn’t mean you should report everything Exadata records. You need a purpose and a direction when monitoring Exadata. Without purpose and direction, it’s entirely possible you can be led down the wrong path, to solve the wrong “problem.” Remember that monitoring should be designed to set an initial baseline, so that there is a solid foundation for comparison. Subsequent monitoring data should provide a window, relative to that baseline, showing how performance fares over time and data changes. You don’t want to be chasing a moving target, if you can avoid it. Having no clear starting point only makes troubleshooting and problem resolution more difficult.
To design and implement an effective monitoring strategy, you need to step away from your normal role as DBA and look at the system from the user’s perspective. Yes, you can drill down into the various metrics and statistics, wait events, and timers, but the end users don’t care about that, really. Their main concern is how long their process or query takes to complete. If a process takes longer than the user thinks it should, the system is slow and needs tuning. Yes, it could very well be their query that needs attention, but to the user, it’s the database causing the problem, and the database is your area of expertise. Users don’t want to know that it’s the 58th bit in the 32nd row of the ORDERS table that’s at fault. They only want to see the problem corrected and response time reduced. Knowing that gives your monitoring process direction and purpose, the two items you need to effectively monitor the system.
Of course it’s not just the user’s claim of unsatisfactory performance that comes into play; it’s also a matter of what acceptable and unacceptable performance may be. Simply because a monitoring script or tool reported “overly high CPU usage” doesn’t mean the performance was unacceptable. You have to take into consideration how many sessions were active at the time and what those sessions were doing. Many tools set default thresholds for such alarms/reports, and those thresholds may not be appropriate for your system, so check these and set them to reasonable values, given your hardware, software, and user load. One size does not fit all, when it comes to monitoring.
Real-Time SQL Monitoring Reports
By far, the easiest way to monitor SQL performance is through Oracle Enterprise Manager 12c (OEM 12c), with the Diagnostic and Tuning Pack installed. Oracle will automatically monitor SQL statements run in parallel and serialized statements consuming five seconds or more of combined I/O and CPU time. It’s also possible to monitor SQL statements with the /*+ MONITOR */ hint. Looking at a screenshot of the Performance window in OEM 12c in Figure 10-1, you can see the level of information presented.
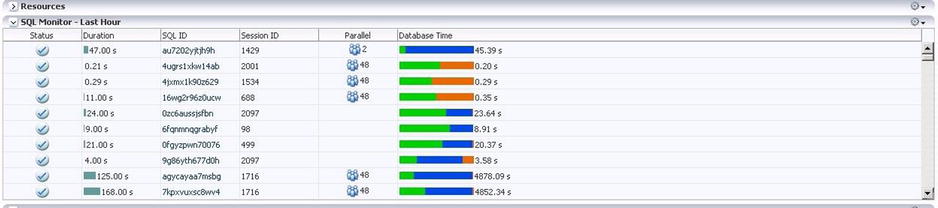
Figure 10-1. OEM 12c SQL monitoring pane
Among the details presented are the duration, the SQL ID, the session ID that ran the statement, the degree of parallelism for parallel execution, and a bar graph of the database time, broken down into the three categories for which time was recorded, CPU, User I/O, and Other. Green reports CPU time as a percentage of the total, blue the User I/O as a percentage, and orange the time (again as a percentage of the whole) recorded as Other. It’s possible to “drill down” into the details for a specific SQL ID from the report by simply clicking on that SQL ID, shown in Figure 10-2.
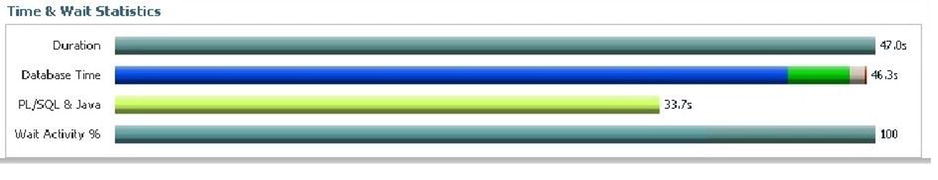
Figure 10-2. SQL ID Time & Wait window in OEM 12c
In addition to the enhanced execution plan (providing a time line, as well as the usual information), there are two sections above the plan providing time and wait statistics, along with I/O statistics. These are extremely helpful when diagnosing and troubleshooting performance issues on a per-statement basis. Not only is the “wall clock” time displayed (as the Duration bar), the time is broken down into its component pieces, so you can see where time was spent while executing the statement. Notice that Database Time, PL/SQL, and Java time, along with Wait Activity, are reported in the Time & Wait Statistics window. From the Database Time bar shown, the time is broken down into four wait categories: User I/O (blue), CPU (green), Cluster (white), and Application (red). Hovering the cursor over each of these areas reports what category is represented and the percentage of the total database time it represents. Such a breakdown is very helpful in determining where time is spent and, possibly, where improvements can be implemented. Likewise, hovering the cursor over the bars found in the I/O Statistics window reports the corresponding figures. Figure 10-3 illustrates this for the Time & Wait Statistics.
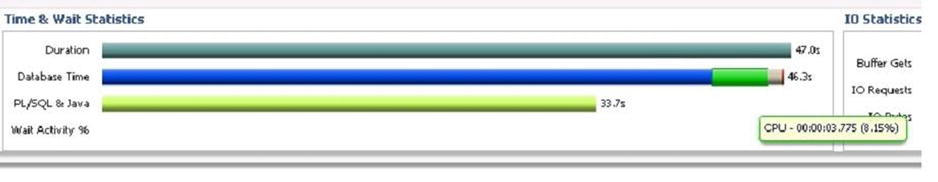
Figure 10-3. Time & Wait Statistics breakdown
Figure 10-4 shows this behavior for the I/O window.
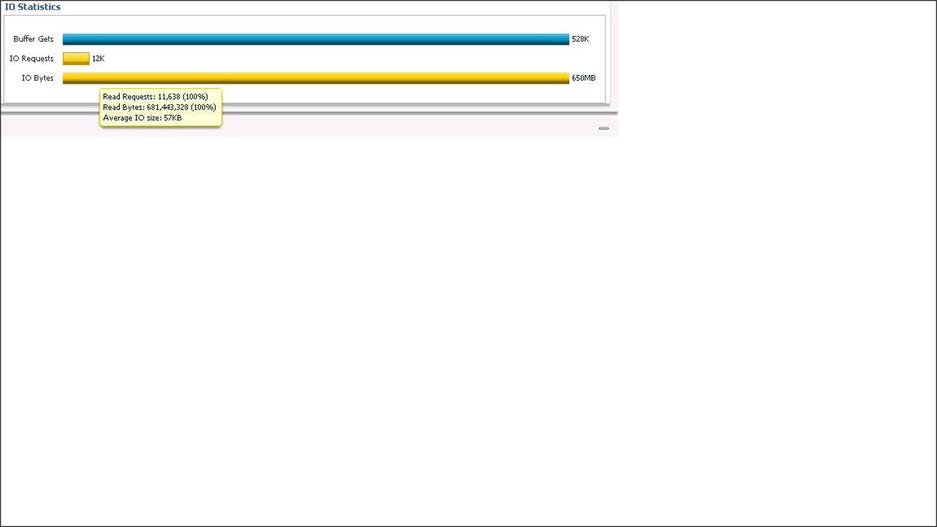
Figure 10-4. I/O Statistics breakdown
Through the tabs above the execution plan, you can see parallel wait statistics (for statements using parallel execution) as bar graphs and various other metrics as line graphs, the latter shown in Figure 10-5.
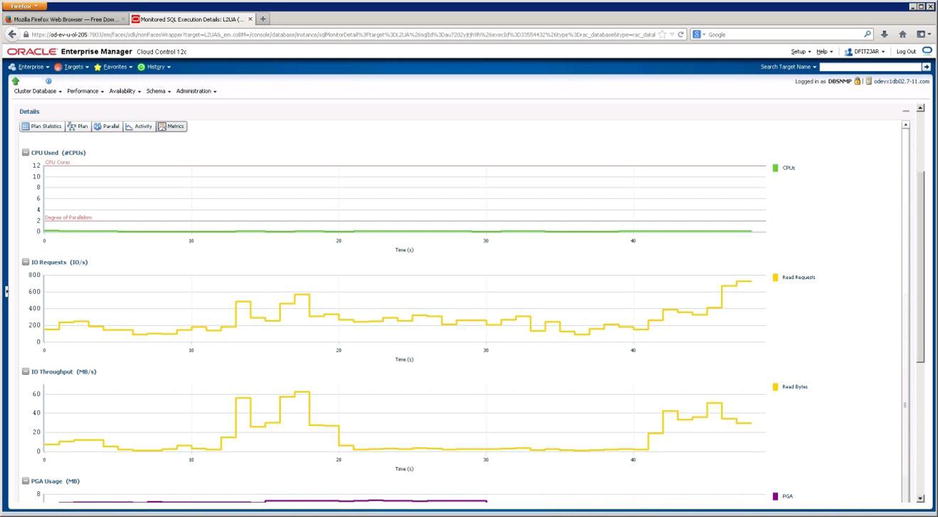
Figure 10-5. SQL ID metric graphs from OEM 12c
We use the Duration column to direct us to possible problem statements, which can be isolated and investigated to see if they are, indeed, a problem. If a statement has a duration of 993 seconds in the last hour, but had 1233 executions, the per-execution time is less than 1 second, which is not unacceptable performance. If, on the other hand, a statement has a duration of 79 seconds during the last hour, and only 1 execution, this SQL ID warrants further investigation. That the value reported in the Duration column is large bears little weight by itself. You must investigate further, in order to accurately determine if it is a problem.
Graphics are nice to have and fairly easy to use, but they aren’t absolutely necessary to monitor Exadata. If you don’t have access to OEM 12c, either because it isn’t installed or it has stopped working, all is not lost. You can generate real-time SQL monitoring reports from SQL*Plus.
Using GV$SQL and GV$SQLSTATS (But That’s Not All)
Generating real-time monitoring reports through SQL*Plus is not as difficult as it may seem, as Oracle provides several views, including GV$SQL and GV$SQLSTATS, and a packaged function (DBMS_SQLTUNE.REPORT_SQL_MONITOR), to provide this information.
Before we get to GV$SQL and GV$SQLSTATS, we will look at GV$SQL_MONITOR, which provides session-level execution monitoring data for all available instances in the cluster. Given that Exadata is a RAC environment, it’s possible that multiple connections from an application may connect “round-robin” between the available nodes. Thus, the same SQL ID may exist on two or more nodes at the same time. It is important when monitoring execution at the SQL ID level to ensure you are always looking at the same session you started monitoring. This is where the session SID, the instance id, and the status are helpful. The session SID and the instance id allow you to isolate a session on a node for further monitoring. If the goal is to examine a currently running statement, ensure that the STATUS is reported as EXECUTING, so that monitoring over time will provide information you may need to troubleshoot a problem. Another view worth noting is GV$SQL_PLAN_MONITOR. This view is updated with plan-level monitoring data, updated in real time.
Looking at some examples using GV$SQL_MONITOR, GV$SQL_PLAN_MONITOR, GV$SQL, and GV$SQLSTATS should help you understand the power of these views and the information they can provide. We begin with GV$SQL_MONITOR and search for a specific SQL_ID, as follows:
SQL> select inst_id inst, sid, sql_plan_hash_value plan_hash, elapsed_time elapsed, cpu_time cpu_tm, fetches fetch, io_interconnect_bytes io_icon_byt, physical_read_bytes + physical_write_bytes tl_byt_proc, ((physical_read_bytes+physical_write_bytes)/io_interconnect_bytes)*100 offld_pct, status
  2  from gv$sql_monitor
  3  where status <> 'DONE'
  4  and sql_id = 'b1x37zg5a1ygr'
  5  and io_interconnect_bytes > 0
  6  /

INST   SID  PLAN_HASH ELAPSED   CPU_TM FETCH IO_ICON_BYT TL_BYT_PRC OFFLD_PCT STATUS
---- ----- ---------- ------- -------- ----- ----------- ---------- --------- ---------------
   1     2 1747818060  329685    76988     0     8183808    8183808       100 DONE (ALL ROWS)
   1  2222 1747818060  283095   100984     0     9199616    9199616       100 DONE (ALL ROWS)
   1  1062 1747818060  240687    86987     0     9502720    9502720       100 DONE (ALL ROWS)
   1  1810 1747818060  246776    85987     0     6201344    6201344       100 DONE (ALL ROWS)
   1   201 1747818060  258911    46992     0     5505024    5505024       100 DONE (ALL ROWS)
   1  1343 1747818060  232887    68989     0     7061504    7061504       100 DONE (ALL ROWS)
   1   777 1747818060  280657    63990     0     6152192    6152192       100 DONE (ALL ROWS)
   1  2094 1747818060  332745    54992     0     6520832    6520832       100 DONE (ALL ROWS)
   1   966 1747818060  245549    79987     0     8028160    8028160       100 DONE (ALL ROWS)
   1  1631 1747818060  273636    74988     0     9216000    9216000       100 DONE (ALL ROWS)
   1  1530 1747818060  330327    89986     0     7454720    7454720       100 DONE (ALL ROWS)
   1  1245 1747818060  239035    95985     0     8773632    8773632       100 DONE (ALL ROWS)
   1   863 1747818060  288678    51992     0     6995968    6995968       100 DONE (ALL ROWS)
   1  2004 1747818060  270000    41993     0     5562368    5562368       100 DONE (ALL ROWS)
   1  1911 1747818060  258966    51992     0     6823936    6823936       100 DONE (ALL ROWS)
   1   393 1747818060  323315    37993     0     4874240    4874240       100 DONE (ALL ROWS)
   1  1724 1747818060  249028    72989     0     7421952    7421952       100 DONE (ALL ROWS)
   1  1241 1747818060   36000    15998     1       40960      40960       100 DONE (ALL ROWS)
   1   290 1747818060  234694    73989     0     6356992    6356992       100 DONE (ALL ROWS)
   1   387 1747818060  264108    75988     0     8454144    8454144       100 DONE (ALL ROWS)
   1  1431 1747818060  246059    75989     0     8011776    8011776       100 DONE (ALL ROWS)
   1   482 1747818060  279164    51991     0     6692864    6692864       100 DONE (ALL ROWS)
   1   493 1747818060  272336    69990     0     8347648    8347648       100 DONE (ALL ROWS)
   1  1156 1747818060  274823    97985     0    11042816   11042816       100 DONE (ALL ROWS)
   1   110 1747818060  261317    61991     0     7708672    7708672       100 DONE (ALL ROWS)

25 rows selected.
SQL>
There are 25 sessions running that same statement, all with different monitoring information. For Exadata, one of the key pieces of information is the IO_INTERCONNECT_BYTES, which indirectly reports the offload efficiency. If the sum of PHYSICAL_READ_BYTES and PHYSICAL_WRITE_BYTES equals the value in IO_INTERCONNECT_BYTES, the query or statement reaped the benefits of offloading with an efficiency of 100 percent. As we’ve pointed out before, ratios and efficiencies are relative numbers. But this ratio does give you a reasonable idea how much of the data was handled by offloading, which saves the database layer processing time. Notice that for every row in the results, the offload_pct is 100. You won’t always see 100 percent offload efficiency, as multipart queries may have sections that will offload and sections that won’t, as the following output illustrates.
INST   SID  PLAN_HASH ELAPSED   CPU_TM FETCH IO_ICON_BYT TL_BYT_PRC OFFLD_PCT STATUS
---- ----- ---------- ------- -------- ----- ----------- ---------- --------- ---------------
   2   476 3140350437 7065006  2202665   142    85155840   83320832 97.845118 DONE (ALL ROWS)
   1   869  484955222 6136552  5940097   127      147456     106496 72.222222 DONE (ALL ROWS)
Much of the output for statements from these two sessions was offloaded, but there was some output that wasn’t, possibly because it needed traditional consistent-read processing at the database level. It’s also possible to get percentages higher than 100.
INST   SID SQL_ID         PLAN_HASH  ELAPSED   CPU_TM FETCH IO_ICON_BYT TL_BYT_PRC OFFLD_PCT STATUS
---- ----- -------------  --------- -------- -------- ----- ----------- ---------- --------- ------
   2  1619 192t67rtdqrf8 4217233900 23380518   795879     2    61626560  127926272 207.58302 DONE (FIRST N ROWS)
   2  1333 6m6y2y82sjpjx  627564094  4416403  1176820     1    57162056   77930496 136.33256 DONE (ALL ROWS)
   2  1619 192t67rtdqrf8 4217233900 13716144   853870     2    63322304  129622016 204.70199 DONE (FIRST N ROWS)
An ORDER BY clause can cause this behavior, as it can up to double the read bytes processed by the query.
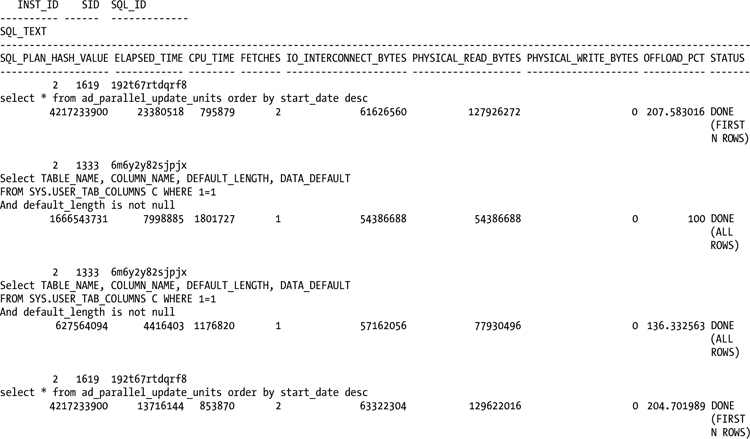
Index access can also increase the value for PHYSICAL_READ_BYTES above the value of IO_INTERCONNECT_BYTES. This is the case for SQL_ID 6m6y2y82sjpjx, as the plan shows.
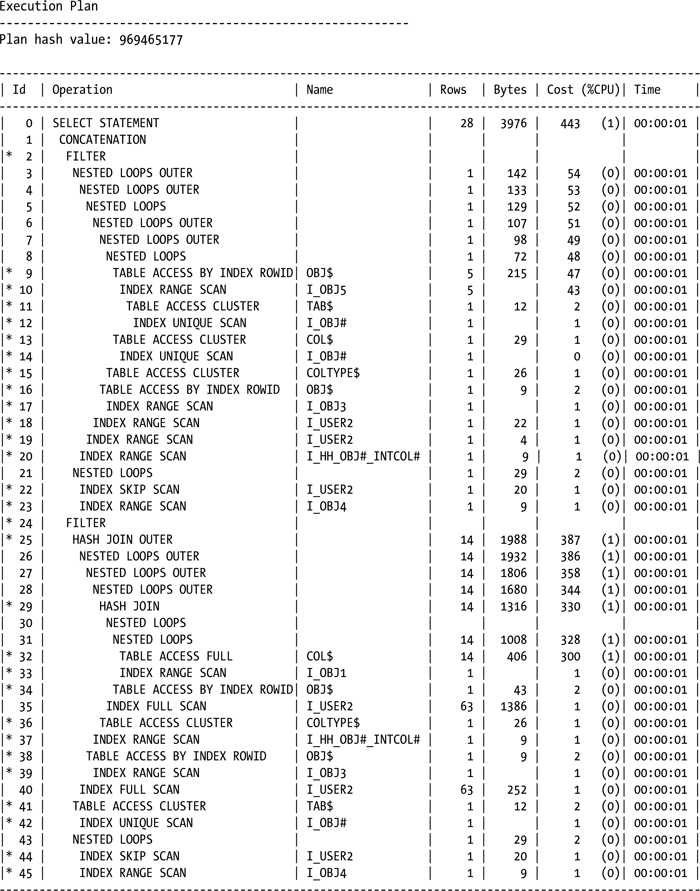
Since the index access paths didn’t qualify for a Smart Scan, they increased the PHYSICAL_READ_BYTES without adding the same amount to IO_INTERCONNECT_BYTES.
Another way to generate monitoring data with Oracle 11.2 is the DBMS_SQLTUNE.REPORT_SQL_MONITOR function.
select dbms_sqltune.report_sql_monitor(session_id=>&sessid, report_level=>'ALL',type=>'HTML') from dual;
The TYPE parameter can be either TEXT or HTML. We usually generate HTML reports, because they are easier to navigate and read in a web browser, as they preserve contextual (drill-down) information you can access with a right-click on the data item. Sample output for one of these HTML reports is shown in Figures 10-6a, 10-6b, and 10-6c.
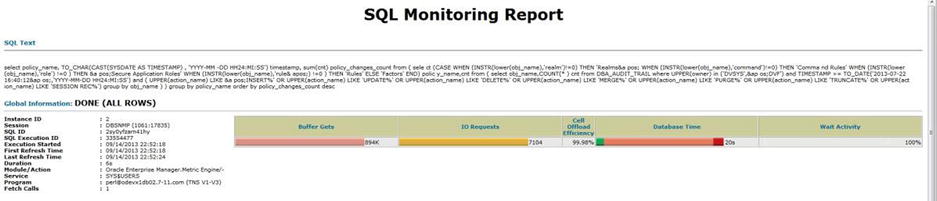
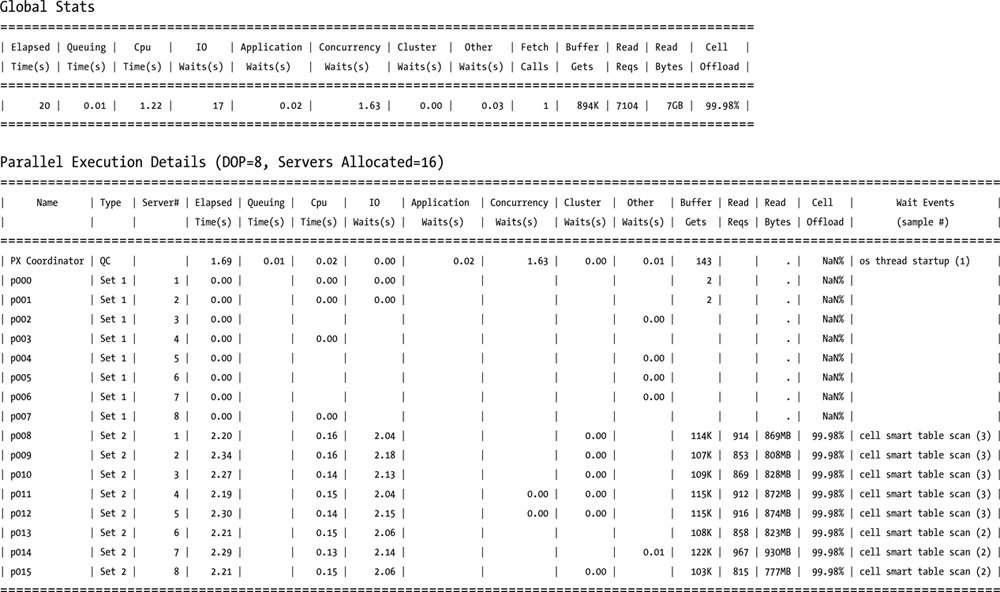
Figure 10-6a. Global information output from DBMS_SQLTUNE.REPORT_SQL_MONITOR
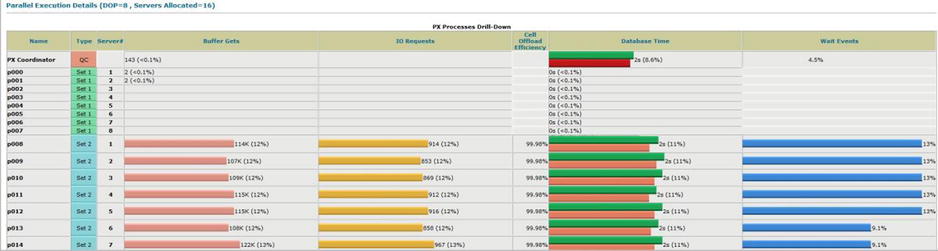
Figure 10-6b. Parallel execution from HTML report
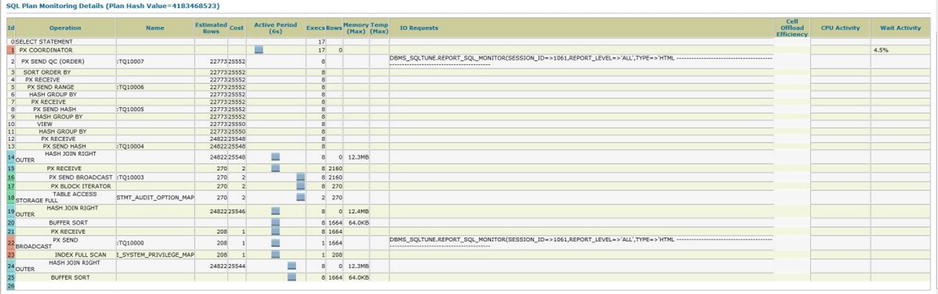
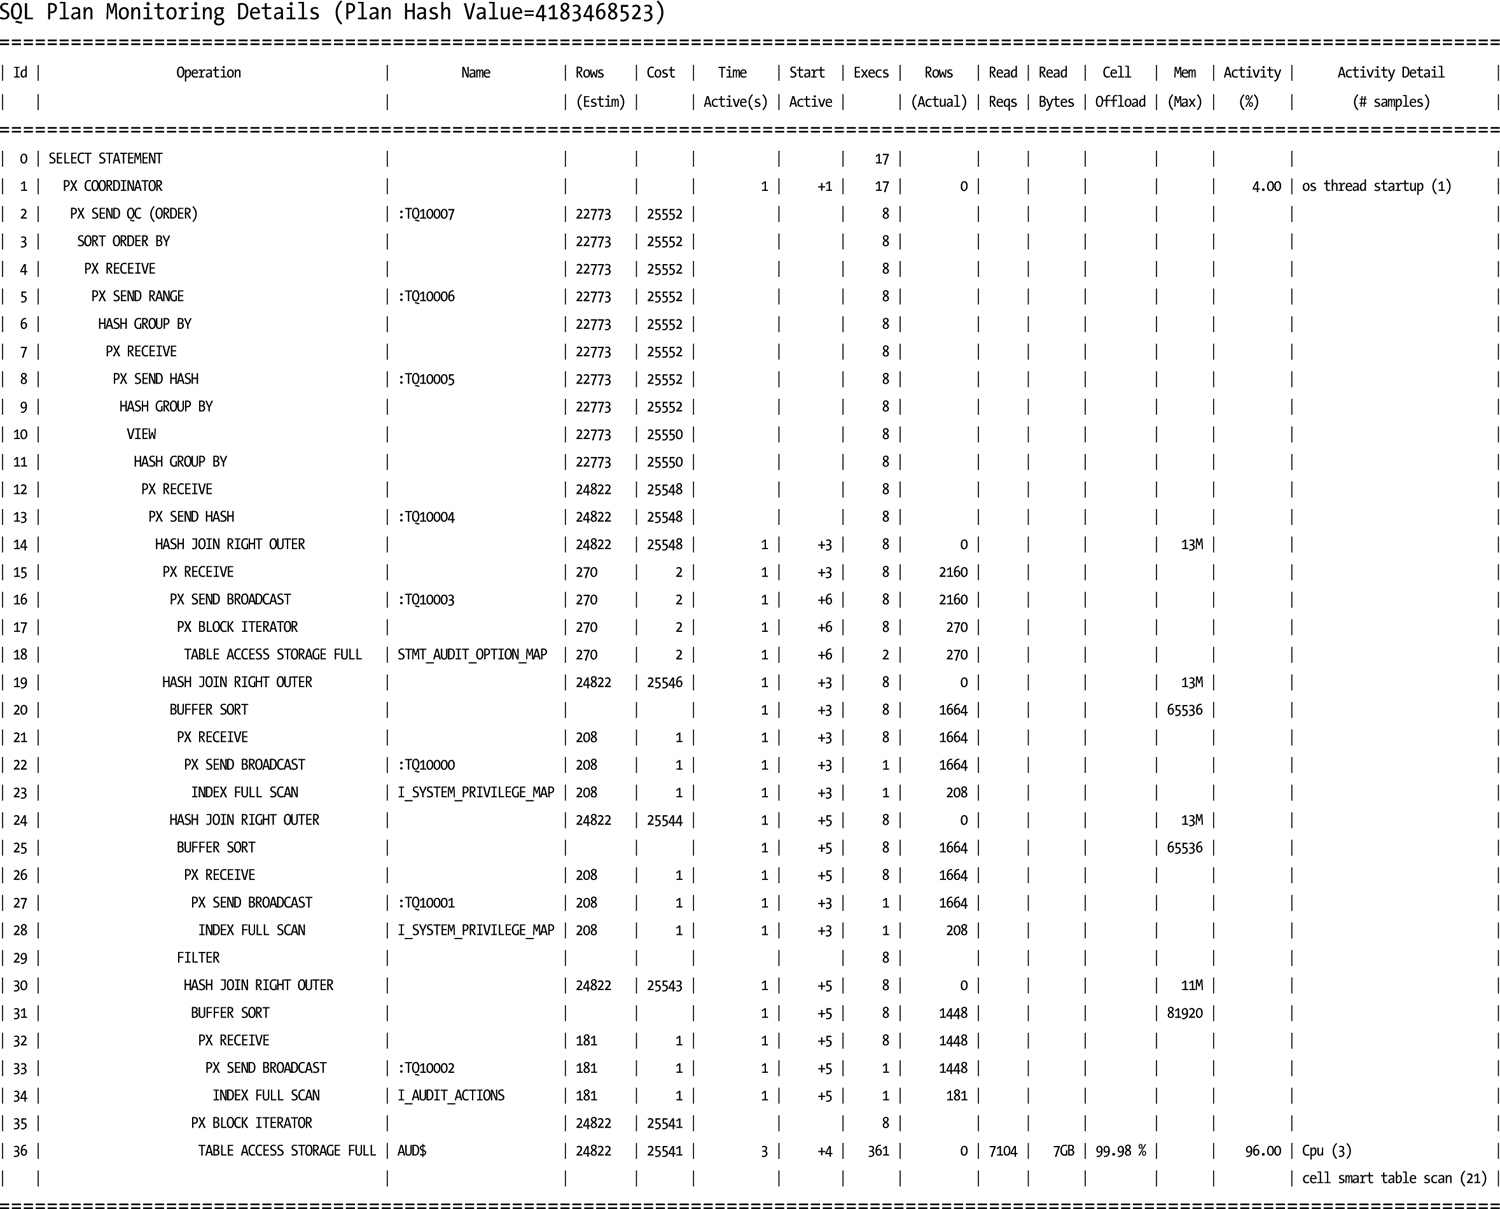
Figure 10-6c. SQL Plan window from HTML report
A text report for the same SID gives the same information.
--------------------------------------------------------------------------------
SQL Monitoring Report

SQL Text
------------------------------
select policy_name, TO_CHAR(CAST(SYSDATE AS TIMESTAMP) , 'YYYY-MM-DD HH24:MI:SS'
) timestamp, sum(cnt) policy_changes_count from ( select (CASE WHEN (INSTR(lower
(obj_name),'realm')!=0) THEN 'Realms' WHEN (INSTR(lower(obj_name),'command')!=0)
 THEN 'Command Rules' WHEN (INSTR(lower(obj_name),'role') !=0 ) THEN 'Secure App
lication Roles' WHEN (INSTR(lower(obj_name),'rule') !=0 ) THEN 'Rules' ELSE 'Fac
tors' END) policy_name,cnt from ( select obj_name,COUNT(*) cnt from DBA_AUDIT_TR
AIL where
UPPER(owner) in ('DVSYS','DVF') and TIMESTAMP >= TO_DATE('2013-07-22 16:40:12','
YYYY-MM-DD HH24:MI:SS') and ( UPPER(action_name) LIKE 'INSERT%' OR UPPER(action_
name) LIKE 'UPDATE%' OR UPPER(action_name) LIKE 'DELETE%' OR UPPER(action_name)
LIKE 'MERGE%' OR UPPER(action_name) LIKE 'PURGE%' OR UPPER(action_name) LIKE 'TR
UNCATE%' OR UPPER(action_name) LIKE 'SESSION REC%') group by obj_name ) ) group
by policy_name order by policy_changes_count desc

Global Information
------------------------------
 Status              :  DONE (ALL ROWS)
 Instance ID         :  2
 Session             :  DBSNMP (1061:17835)
 SQL ID              :  2sy0yfzam41hy
 SQL Execution ID    :  33554477
 Execution Started   :  09/14/2013 22:52:18
 First Refresh Time  :  09/14/2013 22:52:18
 Last Refresh Time   :  09/14/2013 22:52:24
 Duration            :  6s
 Module/Action       :  Oracle Enterprise Manager.Metric Engine/-
 Service             :  SYS$USERS
 Program             :  [email protected] (TNS V1-V3)
 Fetch Calls         :  1
Like the OEM reports we discussed earlier, the HTML version allows you to hover the cursor over a data bar and see the breakdown of I/O requests, database time, and wait activity, as shown in Figure 10-7.
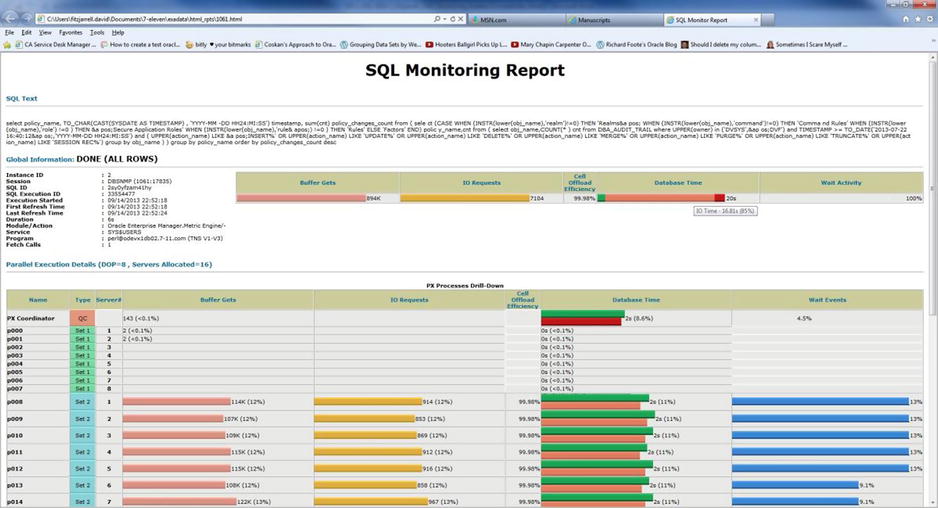
Figure 10-7. Time breakdown from DBMS_SQLTUNE.REPORT_SQL_MONITOR HTML report
If your Exadata system has Internet access and you are running Oracle 11.2.0.x, you can use a third option for the type parameter, 'ACTIVE', which generates an HTML-type report with active content that looks like the screens from OEM. Figure 10-8 illustrates how this type of report appears.

Figure 10-8. Active DBMS_SQLTUNE.REPORT_SQL_MONITOR report
As good as the reports generated with SQL Monitoring, AWR, ASH (Active Session History), and DBMS_SQLTUNE are, there is a limit to their effectiveness. By design, SQL Monitoring starts recording data after the I/O time, CPU time, or both combined exceed a five second limit; this usually means that only the longer-running queries and statements get monitored, even when you use the /*+ MONITOR */ hint. This leads back to the monitoring scripts and actions for databases, where AWR, Statspack, and ASH are not available. Those scripts and queries can still be useful with Exadata, especially when short-running queries are being examined, and those queries usually use V$SQL and, in more recent implementations, V$SQLSTATS.
For years, DBAs have relied on V$SQL to report data such as number of executions, buffer gets, disk reads, or parse calls. Looking at the definition of V$SQL, we find a wealth of data available.
SQL> desc v$sql
 Name                                    Null?    Type
 --------------------------------------- -------- -----------------------
 SQL_TEXT                                         VARCHAR2(1000)
 SQL_FULLTEXT                                     CLOB
 SQL_ID                                           VARCHAR2(13)
 SHARABLE_MEM                                     NUMBER
 PERSISTENT_MEM                                   NUMBER
 RUNTIME_MEM                                      NUMBER
 SORTS                                            NUMBER
 LOADED_VERSIONS                                  NUMBER
 OPEN_VERSIONS                                    NUMBER
 USERS_OPENING                                    NUMBER
 FETCHES                                          NUMBER
 EXECUTIONS                                       NUMBER
 PX_SERVERS_EXECUTIONS                            NUMBER
 END_OF_FETCH_COUNT                               NUMBER
 USERS_EXECUTING                                  NUMBER
 LOADS                                            NUMBER
 FIRST_LOAD_TIME                                  VARCHAR2(76)
 INVALIDATIONS                                    NUMBER
 PARSE_CALLS                                      NUMBER
 DISK_READS                                       NUMBER
 DIRECT_WRITES                                    NUMBER
 BUFFER_GETS                                      NUMBER
 APPLICATION_WAIT_TIME                            NUMBER
 CONCURRENCY_WAIT_TIME                            NUMBER
 CLUSTER_WAIT_TIME                                NUMBER
 USER_IO_WAIT_TIME                                NUMBER
 PLSQL_EXEC_TIME                                  NUMBER
 JAVA_EXEC_TIME                                   NUMBER
 ROWS_PROCESSED                                   NUMBER
 COMMAND_TYPE                                     NUMBER
 OPTIMIZER_MODE                                   VARCHAR2(10)
 OPTIMIZER_COST                                   NUMBER
 OPTIMIZER_ENV                                    RAW(2000)
 OPTIMIZER_ENV_HASH_VALUE                         NUMBER
 PARSING_USER_ID                                  NUMBER
 PARSING_SCHEMA_ID                                NUMBER
 PARSING_SCHEMA_NAME                              VARCHAR2(30)
 KEPT_VERSIONS                                    NUMBER
 ADDRESS                                          RAW(8)
 TYPE_CHK_HEAP                                    RAW(8)
 HASH_VALUE                                       NUMBER
 OLD_HASH_VALUE                                   NUMBER
 PLAN_HASH_VALUE                                  NUMBER
 CHILD_NUMBER                                     NUMBER
 SERVICE                                          VARCHAR2(64)
 SERVICE_HASH                                     NUMBER
 MODULE                                           VARCHAR2(64)
 MODULE_HASH                                      NUMBER
 ACTION                                           VARCHAR2(64)
 ACTION_HASH                                      NUMBER
 SERIALIZABLE_ABORTS                              NUMBER
 OUTLINE_CATEGORY                                 VARCHAR2(64)
 CPU_TIME                                         NUMBER
 ELAPSED_TIME                                     NUMBER
 OUTLINE_SID                                      NUMBER
 CHILD_ADDRESS                                    RAW(8)
 SQLTYPE                                          NUMBER
 REMOTE                                           VARCHAR2(1)
 OBJECT_STATUS                                    VARCHAR2(19)
 LITERAL_HASH_VALUE                               NUMBER
 LAST_LOAD_TIME                                   VARCHAR2(76)
 IS_OBSOLETE                                      VARCHAR2(1)
 IS_BIND_SENSITIVE                                VARCHAR2(1)
 IS_BIND_AWARE                                    VARCHAR2(1)
 IS_SHAREABLE                                     VARCHAR2(1)
 CHILD_LATCH                                      NUMBER
 SQL_PROFILE                                      VARCHAR2(64)
 SQL_PATCH                                        VARCHAR2(30)
 SQL_PLAN_BASELINE                                VARCHAR2(30)
 PROGRAM_ID                                       NUMBER
 PROGRAM_LINE#                                    NUMBER
 EXACT_MATCHING_SIGNATURE                         NUMBER
 FORCE_MATCHING_SIGNATURE                         NUMBER
 LAST_ACTIVE_TIME                                 DATE
 BIND_DATA                                        RAW(2000)
 TYPECHECK_MEM                                    NUMBER
 IO_CELL_OFFLOAD_ELIGIBLE_BYTES                   NUMBER
 IO_INTERCONNECT_BYTES                            NUMBER
 PHYSICAL_READ_REQUESTS                           NUMBER
 PHYSICAL_READ_BYTES                              NUMBER
 PHYSICAL_WRITE_REQUESTS                          NUMBER
 PHYSICAL_WRITE_BYTES                             NUMBER
 OPTIMIZED_PHY_READ_REQUESTS                      NUMBER
 LOCKED_TOTAL                                     NUMBER
 PINNED_TOTAL                                     NUMBER
 IO_CELL_UNCOMPRESSED_BYTES                       NUMBER
 IO_CELL_OFFLOAD_RETURNED_BYTES                   NUMBER

SQL>
Unfortunately, V$SQL suffers from latch contention when queried without providing a SQL_ID, so if there are several queries active against this view, performance can be slow. In 10gR2, the V$SQLSTATS view was introduced, recording much of the same information as V$SQL but in a memory location and format that doesn’t create latch contention with unqualified queries. Since V$SQLSTATS is, in our opinion, the view to use, we will discuss that here. Remember that the same basic type of queries used against V$SQLSTATS can also be used against V$SQL.
In Chapter 2, we discussed Smart Scans and how to prove they are working, and we used V$SQL to do that. We’ll now use V$SQLSTATS to return similar information.
Looking at the definition for V$SQLSTATS, we see much of the same information that is available in V$SQL.
SQL> desc v$sqlstats
 Name                                    Null?    Type
 --------------------------------------- -------- ------------------
 SQL_TEXT                                         VARCHAR2(1000)
 SQL_FULLTEXT                                     CLOB
 SQL_ID                                           VARCHAR2(13)
 LAST_ACTIVE_TIME                                 DATE
 LAST_ACTIVE_CHILD_ADDRESS                        RAW(8)
 PLAN_HASH_VALUE                                  NUMBER
 PARSE_CALLS                                      NUMBER
 DISK_READS                                       NUMBER
 DIRECT_WRITES                                    NUMBER
 BUFFER_GETS                                      NUMBER
 ROWS_PROCESSED                                   NUMBER
 SERIALIZABLE_ABORTS                              NUMBER
 FETCHES                                          NUMBER
 EXECUTIONS                                       NUMBER
 END_OF_FETCH_COUNT                               NUMBER
 LOADS                                            NUMBER
 VERSION_COUNT                                    NUMBER
 INVALIDATIONS                                    NUMBER
 PX_SERVERS_EXECUTIONS                            NUMBER
 CPU_TIME                                         NUMBER
 ELAPSED_TIME                                     NUMBER
 AVG_HARD_PARSE_TIME                              NUMBER
 APPLICATION_WAIT_TIME                            NUMBER
 CONCURRENCY_WAIT_TIME                            NUMBER
 CLUSTER_WAIT_TIME                                NUMBER
 USER_IO_WAIT_TIME                                NUMBER
 PLSQL_EXEC_TIME                                  NUMBER
 JAVA_EXEC_TIME                                   NUMBER
 SORTS                                            NUMBER
 SHARABLE_MEM                                     NUMBER
 TOTAL_SHARABLE_MEM                               NUMBER
 TYPECHECK_MEM                                    NUMBER
 IO_CELL_OFFLOAD_ELIGIBLE_BYTES                   NUMBER
 IO_INTERCONNECT_BYTES                            NUMBER
 PHYSICAL_READ_REQUESTS                           NUMBER
 PHYSICAL_READ_BYTES                              NUMBER
 PHYSICAL_WRITE_REQUESTS                          NUMBER
 PHYSICAL_WRITE_BYTES                             NUMBER
 EXACT_MATCHING_SIGNATURE                         NUMBER
 FORCE_MATCHING_SIGNATURE                         NUMBER
 IO_CELL_UNCOMPRESSED_BYTES                       NUMBER
 IO_CELL_OFFLOAD_RETURNED_BYTES                   NUMBER

SQL>
V$SQLSTATS doesn’t include the parsing user id, so you will need to use another method to isolate information you want to see. A possible rewrite of the V$SQL query used in Chapter 2 follows.
SQL> select       sql_id,
  2          io_cell_offload_eligible_bytes qualifying,
  3          io_cell_offload_eligible_bytes -
io_cell_offload_returned_bytes actual,
  4          round(((io_cell_offload_eligible_bytes - io_cell_offload_returned_bytes)/io_cell_offload_eligible_bytes)*100, 2) io_saved_pct,
  5          sql_text
  6          from v$sqlstats
  7          where io_cell_offload_returned_bytes > 0
  8          and io_cell_offload_eligible_bytes > 0
  9          and instr(sql_text, 'emp') > 0;

SQL_ID        QUALIFYING     ACTUAL IO_SAVED_PCT SQL_TEXT
------------- ---------- ---------- ------------ ---------------------------------------------
gfjb8dpxvpuv6  185081856  185053096        99.98 select * from emp where empid = 7934
dayy30naa1z2p  184819712     948048          .51 select /*+ cache */ * from emp

SQL>
Since there could be a number of queries with “emp” as a substring, some of which don’t qualify for a Smart Scan, it was necessary to include a condition that the io_cell_offload_eligible_bytes be greater than 0. Without that condition, the query generates a “divisor is equal to 0” error, which doesn’t occur with the V$SQL version of the query.
There are some pieces of information not available in V$SQLSTATS.
COLUMN_NAME                    DATA_TYPE                        DATA_LENGTH
------------------------------ -------------------------------- -----------
PERSISTENT_MEM                 NUMBER                                    22
RUNTIME_MEM                    NUMBER                                    22
LOADED_VERSIONS                NUMBER                                    22
OPEN_VERSIONS                  NUMBER                                    22
USERS_OPENING                  NUMBER                                    22
USERS_EXECUTING                NUMBER                                    22
FIRST_LOAD_TIME                VARCHAR2                                  76
COMMAND_TYPE                   NUMBER                                    22
OPTIMIZER_MODE                 VARCHAR2                                  10
OPTIMIZER_COST                 NUMBER                                    22
OPTIMIZER_ENV                  RAW                                     2000
OPTIMIZER_ENV_HASH_VALUE       NUMBER                                    22
PARSING_USER_ID                NUMBER                                    22
PARSING_SCHEMA_ID              NUMBER                                    22
PARSING_SCHEMA_NAME            VARCHAR2                                  30
KEPT_VERSIONS                  NUMBER                                    22
ADDRESS                        RAW                                        8
TYPE_CHK_HEAP                  RAW                                        8
HASH_VALUE                     NUMBER                                    22
OLD_HASH_VALUE                 NUMBER                                    22
CHILD_NUMBER                   NUMBER                                    22
SERVICE                        VARCHAR2                                  64
SERVICE_HASH                   NUMBER                                    22
MODULE                         VARCHAR2                                  64
MODULE_HASH                    NUMBER                                    22
ACTION                         VARCHAR2                                  64
ACTION_HASH                    NUMBER                                    22
OUTLINE_CATEGORY               VARCHAR2                                  64
OUTLINE_SID                    NUMBER                                    22
CHILD_ADDRESS                  RAW                                        8
SQLTYPE                        NUMBER                                    22
REMOTE                         VARCHAR2                                   1
OBJECT_STATUS                  VARCHAR2                                  19
LITERAL_HASH_VALUE             NUMBER                                    22
LAST_LOAD_TIME                 VARCHAR2                                  76
IS_OBSOLETE                    VARCHAR2                                   1
IS_BIND_SENSITIVE              VARCHAR2                                   1
IS_BIND_AWARE                  VARCHAR2                                   1
IS_SHAREABLE                   VARCHAR2                                   1
CHILD_LATCH                    NUMBER                                    22
SQL_PROFILE                    VARCHAR2                                  64
SQL_PATCH                      VARCHAR2                                  30
SQL_PLAN_BASELINE              VARCHAR2                                  30
PROGRAM_ID                     NUMBER                                    22
PROGRAM_LINE#                  NUMBER                                    22
BIND_DATA                      RAW                                     2000
OPTIMIZED_PHY_READ_REQUESTS    NUMBER                                    22
LOCKED_TOTAL                   NUMBER                                    22
PINNED_TOTAL                   NUMBER                                    22
For general monitoring tasks, those columns aren’t necessary. If you do need to dig deeper into a problem, then you may need to use V$SQL to access memory, latch, or optimizer data for the query in question. We find that V$SQLSTATS does a good job for basic, routine monitoring of SQL statements and that it provides a lower overhead during busy periods of database activity.
Storage cell management was covered in Chapter 9, but we’ll review some of that information here.
The Command Line
We feel that it’s a good idea to review the command-line interfaces here. Remember that the storage cells offer both CellCLI and cellsrvstat to monitor the storage cells, and two accounts, cellmonitor and celladmin, to perform those tasks. For general monitoring, the cellmonitor account should provide the information you need through the CellCLI interface.
A common monitoring area for Exadata is the Smart Flash Cache. To fully monitor this area, it is necessary to connect to every available storage cell and generate a report. It’s possible to send this to the storage cells via a script and have the output logged to the database server, which was illustrated in Chapter 9. An example of such a report, for storage cell 4, follows.
CellCLI> list flashlog detail
         name:                   myexa1cel04_FLASHLOG
         cellDisk:               FD_14_myexa1cel04,FD_05_myexa1cel04,FD_00_myexa1cel04,FD_01_myexa1cel04,FD_04_myexa1cel04,
FD_07_myexa1cel04,FD_09_ode vx1cel04,FD_02_myexa1cel04,FD_08_myexa1cel04,FD_03_myexa1cel04,
FD_15_myexa1cel04,FD_12_myexa1cel04,FD_11_myexa1cel04,FD_06_myexa1cel04,FD_10_myexa1cel 04,
FD_13_myexa1cel04
         creationTime:           2013-07-09T17:33:31-05:00
         degradedCelldisks:
         effectiveSize:          512M
         efficiency:             100.0
         id:                     7eb480f9-b94a-4493-bfca-3ba00b6618bb
         size:                   512M
         status:                 normal

CellCLI>
A command-line example, run on the storage cell, lists the same output but avoids using the command-line interface.
[celladmin@myexa1cel05 ∼]$ cellcli -e "list flashcache detail"
         name:                   myexa1cel05_FLASHCACHE
         cellDisk:               FD_11_myexa1cel05,FD_03_myexa1cel05,FD_15_myexa1cel05,FD_13_myexa1cel05,FD_08_myexa1cel05,
FD_10_myexa1cel05,FD_00_myexa1cel05,FD_14_myexa1cel05,FD_04_myexa1cel05,FD_06_myexa1cel05,
FD_07_myexa1cel05,FD_05_myexa1cel05,FD_12_myexa1cel05,FD_09_myexa1cel05,FD_02_myexa1cel05,
FD_01_myexa1cel05
         creationTime:           2013-07-09T17:33:53-05:00
         degradedCelldisks:
         effectiveCacheSize:     1488.75G
         id:                     8a380bf9-06c3-445e-8081-cff72d49bfe6
         size:                   1488.75G
         status:                 normal
[celladmin@myexa1cel05 ∼]$
As stated in Chapter 9, if you set up passwordless ssh connectivity between the database servers and the storage cells, you can run these commands from the database server command prompt and write a local logfile of the results.
One good CellCLI command worth noting is LIST METRICHISTORY. This command does just what you would think, listing the metric history for all known metrics in the storage cell, along with the time stamp indicating when the values were collected. The output will likely be a very long list, as you can see in the following abbreviated output:
 CellCLI>  list metrichistory attributes name, collectionTime, metricType, metricValue, metricValueAvg where metricObjectName = 'DBFS_DG_CD_02_myexa1cel04'
...
         GD_BY_FC_DIRTY          2013-08-24T19:50:42-05:00       Instantaneous   0.000 MB
         GD_IO_BY_R_LG           2013-08-24T19:50:42-05:00       Cumulative      2,656 MB
         GD_IO_BY_R_LG_SEC       2013-08-24T19:50:42-05:00       Rate            0.000 MB/sec
         GD_IO_BY_R_SM           2013-08-24T19:50:42-05:00       Cumulative      207 MB
         GD_IO_BY_R_SM_SEC       2013-08-24T19:50:42-05:00       Rate            0.000 MB/sec
         GD_IO_BY_W_LG           2013-08-24T19:50:42-05:00       Cumulative      8,378 MB
         GD_IO_BY_W_LG_SEC       2013-08-24T19:50:42-05:00       Rate            0.000 MB/sec
         GD_IO_BY_W_SM           2013-08-24T19:50:42-05:00       Cumulative      60.191 MB
         GD_IO_BY_W_SM_SEC       2013-08-24T19:50:42-05:00       Rate            0.000 MB/sec
         GD_IO_ERRS              2013-08-24T19:50:42-05:00       Cumulative      0
         GD_IO_ERRS_MIN          2013-08-24T19:50:42-05:00       Rate            0.0 /min
         GD_IO_RQ_R_LG           2013-08-24T19:50:42-05:00       Cumulative      2,656 IO requests
         GD_IO_RQ_R_LG_SEC       2013-08-24T19:50:42-05:00       Rate            0.0 IO/sec
         GD_IO_RQ_R_SM           2013-08-24T19:50:42-05:00       Cumulative      4,086 IO requests
         GD_IO_RQ_R_SM_SEC       2013-08-24T19:50:42-05:00       Rate            0.0 IO/sec
         GD_IO_RQ_W_LG           2013-08-24T19:50:42-05:00       Cumulative      8,781 IO requests
         GD_IO_RQ_W_LG_SEC       2013-08-24T19:50:42-05:00       Rate            0.0 IO/sec
         GD_IO_RQ_W_SM           2013-08-24T19:50:42-05:00       Cumulative      1,326 IO requests
         GD_IO_RQ_W_SM_SEC       2013-08-24T19:50:42-05:00       Rate            0.0 IO/sec
...
The metrics listed may not be entirely clear from the abbreviations used in the names. A listing of each name and its meaning follows.
GD_BY_FC_DIRTY          Number of dirty MB cached for the griddisk
GD_IO_BY_R_LG                   Griddisk I/O from large reads, in MB
GD_IO_BY_R_LG_SEC               Griddisk I/O from large reads per second, MB
GD_IO_BY_R_SM                   Griddisk I/O from small reads, in MB
GD_IO_BY_R_SM_SEC               Griddisk I/O from small reads per second, MB
GD_IO_BY W_LG                   Griddisk I/O from large writes, in MB
GD_IO_BY_W_LG_SEC               Griddisk I/O from large writes per second, MB
GD_IO_BY_W_SM                   Griddisk I/O from small writes, in MB
GD_IO_BY_W_SM_SEC               Griddisk I/O from small writes per second, MB
GD_IO_ERRS                      Griddisk I/O errors
GD_IO_ERRS_MIN          Griddisk I/O errors per minute
GD_IO_RQ_R_LG                   Griddisk large I/O read requests
GD_IO_RQ_R_LG_SEC               Griddisk large I/O read requests per second
GD_IO_RQ_R_SM           Griddisk small I/O read requests
GD_IO_RQ_R_SM_SEC               Griddisk small I/O read requests per second
GD_IO_RQ_W_LG                   Griddisk large I/O write requests
GD_IO_RQ_W_LG_SEC               Griddisk large I/O write requests per second
GD_IO_RQ_W_SM                   Griddisk small I/O write requests
GD_IO_RQ_W_SM_SEC               Griddisk small I/O write requests, per second
The only metric in that list reported as instantaneous is GD_BY_FC_DIRTY, which reports the current value for the MB of dirty cache blocks for the grid disk. The following metrics report cumulative values since cellsrv was started:
GD_IO_BY_R_LG
GD_IO_BY_R_SM
GD_IO_BY W_LG
GD_IO_BY_W_SM
GD_IO_ERRS
GD_IO_RQ_R_LG
GD_IO_RQ_R_SM
GD_IO_RQ_W_LG
GD_IO_RQ_W_SM
The first four metrics are reported in MB; the remaining metrics are simply cumulative counts for the listed metrics. Additionally, there are rate metrics reported, as follows:
GD_IO_BY_R_LG   _SEC
GD_IO_BY_R_SM   _SEC
GD_IO_BY W_LG_SEC
GD_IO_BY_W_SM_SEC
GD_IO_ERRS_MIN
GD_IO_RQ_R_LG   _SEC
GD_IO_RQ_R_SM_SEC
GD_IO_RQ_W_LG_SEC
GD_IO_RQ_W_SM_SEC
With the exception of GD_IO_ERRS_MIN, which reports the rate per minute for I/O error generation, these metrics report rates per second. These are current rates, updated at the time the metrics are reported. Read and write requests, as well as the actual I/O generated, will occur on a per-second basis. It should be unusual to generate I/O errors if the system is functioning properly. Notice the error metrics for this particular cell report 0 errors in total and 0.0 errors per minute. Impending disk failures or firmware mismatches can create I/O errors, but you should be informed of such impending failures by monitoring the alert history, which we covered in Chapter 9.
The collection interval is one minute, making the data volume very large after a prolonged period of uptime. Wildcard syntax does not work on the collectionTime attribute, so you won’t be able to generate a report for a specific window of time. You can, however, restrict output to a specific minute if you wish, as follows:
CellCLI> list metrichistory attributes name, collectionTime, metricType, metricValue, metricValueAvg where metricObjectName = 'DBFS_DG_CD_02_myexa1cel04' and collectionTime like
'2013-08-24T19:57:42-05:00'
         GD_BY_FC_DIRTY          2013-08-24T19:57:42-05:00       Instantaneous   0.000 MB
         GD_IO_BY_R_LG           2013-08-24T19:57:42-05:00       Cumulative      2,656 MB
         GD_IO_BY_R_LG_SEC       2013-08-24T19:57:42-05:00       Rate            0.000 MB/sec
         GD_IO_BY_R_SM           2013-08-24T19:57:42-05:00       Cumulative      207 MB
         GD_IO_BY_R_SM_SEC       2013-08-24T19:57:42-05:00       Rate            0.000 MB/sec
         GD_IO_BY_W_LG           2013-08-24T19:57:42-05:00       Cumulative      8,378 MB
         GD_IO_BY_W_LG_SEC       2013-08-24T19:57:42-05:00       Rate            0.000 MB/sec
         GD_IO_BY_W_SM           2013-08-24T19:57:42-05:00       Cumulative      60.191 MB
         GD_IO_BY_W_SM_SEC       2013-08-24T19:57:42-05:00       Rate            0.000 MB/sec
         GD_IO_ERRS              2013-08-24T19:57:42-05:00       Cumulative      0
         GD_IO_ERRS_MIN          2013-08-24T19:57:42-05:00       Rate            0.0 /min
         GD_IO_RQ_R_LG           2013-08-24T19:57:42-05:00       Cumulative      2,656 IO requests
         GD_IO_RQ_R_LG_SEC       2013-08-24T19:57:42-05:00       Rate            0.0 IO/sec
         GD_IO_RQ_R_SM           2013-08-24T19:57:42-05:00       Cumulative      4,086 IO requests
         GD_IO_RQ_R_SM_SEC       2013-08-24T19:57:42-05:00       Rate            0.0 IO/sec
         GD_IO_RQ_W_LG           2013-08-24T19:57:42-05:00       Cumulative      8,781 IO requests
         GD_IO_RQ_W_LG_SEC       2013-08-24T19:57:42-05:00       Rate            0.0 IO/sec
         GD_IO_RQ_W_SM           2013-08-24T19:57:42-05:00       Cumulative      1,326 IO requests
         GD_IO_RQ_W_SM_SEC       2013-08-24T19:57:42-05:00       Rate            0.0 IO/sec

CellCLI>
You can write a script to generate a window of time, one minute at a time, as follows:
[oracle@myexa1db01 dbm1 bin]$ cellcli_metrichistory_window.sh
=========================================================================================="
======================================= Cell 4 ==========================================="
=========================================================================================="
GD_BY_FC_DIRTY 2013-08-24T19:50:42-05:00 Instantaneous 0.000 MB
GD_IO_BY_R_LG 2013-08-24T19:50:42-05:00 Cumulative 2,656 MB
GD_IO_BY_R_LG_SEC 2013-08-24T19:50:42-05:00 Rate 0.000 MB/sec
GD_IO_BY_R_SM 2013-08-24T19:50:42-05:00 Cumulative 207 MB
GD_IO_BY_R_SM_SEC 2013-08-24T19:50:42-05:00 Rate 0.000 MB/sec
GD_IO_BY_W_LG 2013-08-24T19:50:42-05:00 Cumulative 8,378 MB
GD_IO_BY_W_LG_SEC 2013-08-24T19:50:42-05:00 Rate 0.000 MB/sec
GD_IO_BY_W_SM 2013-08-24T19:50:42-05:00 Cumulative 60.191 MB
GD_IO_BY_W_SM_SEC 2013-08-24T19:50:42-05:00 Rate 0.000 MB/sec
GD_IO_ERRS 2013-08-24T19:50:42-05:00 Cumulative 0
GD_IO_ERRS_MIN 2013-08-24T19:50:42-05:00 Rate 0.0 /min
GD_IO_RQ_R_LG 2013-08-24T19:50:42-05:00 Cumulative 2,656 IO requests
GD_IO_RQ_R_LG_SEC 2013-08-24T19:50:42-05:00 Rate 0.0 IO/sec
GD_IO_RQ_R_SM 2013-08-24T19:50:42-05:00 Cumulative 4,086 IO requests
GD_IO_RQ_R_SM_SEC 2013-08-24T19:50:42-05:00 Rate 0.0 IO/sec
GD_IO_RQ_W_LG 2013-08-24T19:50:42-05:00 Cumulative 8,781 IO requests
GD_IO_RQ_W_LG_SEC 2013-08-24T19:50:42-05:00 Rate 0.0 IO/sec
GD_IO_RQ_W_SM 2013-08-24T19:50:42-05:00 Cumulative 1,326 IO requests
GD_IO_RQ_W_SM_SEC 2013-08-24T19:50:42-05:00 Rate 0.0 IO/sec
GD_BY_FC_DIRTY 2013-08-24T19:51:42-05:00 Instantaneous 0.000 MB
GD_IO_BY_R_LG 2013-08-24T19:51:42-05:00 Cumulative 2,656 MB
GD_IO_BY_R_LG_SEC 2013-08-24T19:51:42-05:00 Rate 0.000 MB/sec
GD_IO_BY_R_SM 2013-08-24T19:51:42-05:00 Cumulative 207 MB
GD_IO_BY_R_SM_SEC 2013-08-24T19:51:42-05:00 Rate 0.000 MB/sec
GD_IO_BY_W_LG 2013-08-24T19:51:42-05:00 Cumulative 8,378 MB
GD_IO_BY_W_LG_SEC 2013-08-24T19:51:42-05:00 Rate 0.000 MB/sec
GD_IO_BY_W_SM 2013-08-24T19:51:42-05:00 Cumulative 60.191 MB
GD_IO_BY_W_SM_SEC 2013-08-24T19:51:42-05:00 Rate 0.000 MB/sec
GD_IO_ERRS 2013-08-24T19:51:42-05:00 Cumulative 0
GD_IO_ERRS_MIN 2013-08-24T19:51:42-05:00 Rate 0.0 /min
GD_IO_RQ_R_LG 2013-08-24T19:51:42-05:00 Cumulative 2,656 IO requests
GD_IO_RQ_R_LG_SEC 2013-08-24T19:51:42-05:00 Rate 0.0 IO/sec
GD_IO_RQ_R_SM 2013-08-24T19:51:42-05:00 Cumulative 4,086 IO requests
GD_IO_RQ_R_SM_SEC 2013-08-24T19:51:42-05:00 Rate 0.0 IO/sec
GD_IO_RQ_W_LG 2013-08-24T19:51:42-05:00 Cumulative 8,781 IO requests
GD_IO_RQ_W_LG_SEC 2013-08-24T19:51:42-05:00 Rate 0.0 IO/sec
GD_IO_RQ_W_SM 2013-08-24T19:51:42-05:00 Cumulative 1,326 IO requests
GD_IO_RQ_W_SM_SEC 2013-08-24T19:51:42-05:00 Rate 0.0 IO/sec
GD_BY_FC_DIRTY 2013-08-24T19:52:42-05:00 Instantaneous 0.000 MB
GD_IO_BY_R_LG 2013-08-24T19:52:42-05:00 Cumulative 2,656 MB
GD_IO_BY_R_LG_SEC 2013-08-24T19:52:42-05:00 Rate 0.000 MB/sec
GD_IO_BY_R_SM 2013-08-24T19:52:42-05:00 Cumulative 207 MB
GD_IO_BY_R_SM_SEC 2013-08-24T19:52:42-05:00 Rate 0.000 MB/sec
GD_IO_BY_W_LG 2013-08-24T19:52:42-05:00 Cumulative 8,378 MB
GD_IO_BY_W_LG_SEC 2013-08-24T19:52:42-05:00 Rate 0.000 MB/sec
GD_IO_BY_W_SM 2013-08-24T19:52:42-05:00 Cumulative 60.191 MB
GD_IO_BY_W_SM_SEC 2013-08-24T19:52:42-05:00 Rate 0.000 MB/sec
GD_IO_ERRS 2013-08-24T19:52:42-05:00 Cumulative 0
GD_IO_ERRS_MIN 2013-08-24T19:52:42-05:00 Rate 0.0 /min
GD_IO_RQ_R_LG 2013-08-24T19:52:42-05:00 Cumulative 2,656 IO requests
GD_IO_RQ_R_LG_SEC 2013-08-24T19:52:42-05:00 Rate 0.0 IO/sec
GD_IO_RQ_R_SM 2013-08-24T19:52:42-05:00 Cumulative 4,086 IO requests
GD_IO_RQ_R_SM_SEC 2013-08-24T19:52:42-05:00 Rate 0.0 IO/sec
GD_IO_RQ_W_LG 2013-08-24T19:52:42-05:00 Cumulative 8,781 IO requests
GD_IO_RQ_W_LG_SEC 2013-08-24T19:52:42-05:00 Rate 0.0 IO/sec
GD_IO_RQ_W_SM 2013-08-24T19:52:42-05:00 Cumulative 1,326 IO requests
GD_IO_RQ_W_SM_SEC 2013-08-24T19:52:42-05:00 Rate 0.0 IO/sec
GD_BY_FC_DIRTY 2013-08-24T19:53:42-05:00 Instantaneous 0.000 MB
GD_IO_BY_R_LG 2013-08-24T19:53:42-05:00 Cumulative 2,656 MB
GD_IO_BY_R_LG_SEC 2013-08-24T19:53:42-05:00 Rate 0.000 MB/sec
GD_IO_BY_R_SM 2013-08-24T19:53:42-05:00 Cumulative 207 MB
GD_IO_BY_R_SM_SEC 2013-08-24T19:53:42-05:00 Rate 0.000 MB/sec
GD_IO_BY_W_LG 2013-08-24T19:53:42-05:00 Cumulative 8,378 MB
GD_IO_BY_W_LG_SEC 2013-08-24T19:53:42-05:00 Rate 0.000 MB/sec
GD_IO_BY_W_SM 2013-08-24T19:53:42-05:00 Cumulative 60.191 MB
GD_IO_BY_W_SM_SEC 2013-08-24T19:53:42-05:00 Rate 0.000 MB/sec
GD_IO_ERRS 2013-08-24T19:53:42-05:00 Cumulative 0
GD_IO_ERRS_MIN 2013-08-24T19:53:42-05:00 Rate 0.0 /min
GD_IO_RQ_R_LG 2013-08-24T19:53:42-05:00 Cumulative 2,656 IO requests
GD_IO_RQ_R_LG_SEC 2013-08-24T19:53:42-05:00 Rate 0.0 IO/sec
GD_IO_RQ_R_SM 2013-08-24T19:53:42-05:00 Cumulative 4,086 IO requests
GD_IO_RQ_R_SM_SEC 2013-08-24T19:53:42-05:00 Rate 0.0 IO/sec
GD_IO_RQ_W_LG 2013-08-24T19:53:42-05:00 Cumulative 8,781 IO requests
GD_IO_RQ_W_LG_SEC 2013-08-24T19:53:42-05:00 Rate 0.0 IO/sec
GD_IO_RQ_W_SM 2013-08-24T19:53:42-05:00 Cumulative 1,326 IO requests
GD_IO_RQ_W_SM_SEC 2013-08-24T19:53:42-05:00 Rate 0.0 IO/sec
GD_BY_FC_DIRTY 2013-08-24T19:54:42-05:00 Instantaneous 0.000 MB
GD_IO_BY_R_LG 2013-08-24T19:54:42-05:00 Cumulative 2,656 MB
GD_IO_BY_R_LG_SEC 2013-08-24T19:54:42-05:00 Rate 0.000 MB/sec
GD_IO_BY_R_SM 2013-08-24T19:54:42-05:00 Cumulative 207 MB
GD_IO_BY_R_SM_SEC 2013-08-24T19:54:42-05:00 Rate 0.000 MB/sec
GD_IO_BY_W_LG 2013-08-24T19:54:42-05:00 Cumulative 8,378 MB
GD_IO_BY_W_LG_SEC 2013-08-24T19:54:42-05:00 Rate 0.000 MB/sec
GD_IO_BY_W_SM 2013-08-24T19:54:42-05:00 Cumulative 60.191 MB
GD_IO_BY_W_SM_SEC 2013-08-24T19:54:42-05:00 Rate 0.000 MB/sec
GD_IO_ERRS 2013-08-24T19:54:42-05:00 Cumulative 0
GD_IO_ERRS_MIN 2013-08-24T19:54:42-05:00 Rate 0.0 /min
GD_IO_RQ_R_LG 2013-08-24T19:54:42-05:00 Cumulative 2,656 IO requests
GD_IO_RQ_R_LG_SEC 2013-08-24T19:54:42-05:00 Rate 0.0 IO/sec
GD_IO_RQ_R_SM 2013-08-24T19:54:42-05:00 Cumulative 4,086 IO requests
GD_IO_RQ_R_SM_SEC 2013-08-24T19:54:42-05:00 Rate 0.0 IO/sec
GD_IO_RQ_W_LG 2013-08-24T19:54:42-05:00 Cumulative 8,781 IO requests
GD_IO_RQ_W_LG_SEC 2013-08-24T19:54:42-05:00 Rate 0.0 IO/sec
GD_IO_RQ_W_SM 2013-08-24T19:54:42-05:00 Cumulative 1,326 IO requests
GD_IO_RQ_W_SM_SEC 2013-08-24T19:54:42-05:00 Rate 0.0 IO/sec
GD_BY_FC_DIRTY 2013-08-24T19:55:42-05:00 Instantaneous 0.000 MB
GD_IO_BY_R_LG 2013-08-24T19:55:42-05:00 Cumulative 2,656 MB
GD_IO_BY_R_LG_SEC 2013-08-24T19:55:42-05:00 Rate 0.000 MB/sec
GD_IO_BY_R_SM 2013-08-24T19:55:42-05:00 Cumulative 207 MB
GD_IO_BY_R_SM_SEC 2013-08-24T19:55:42-05:00 Rate 0.000 MB/sec
GD_IO_BY_W_LG 2013-08-24T19:55:42-05:00 Cumulative 8,378 MB
GD_IO_BY_W_LG_SEC 2013-08-24T19:55:42-05:00 Rate 0.000 MB/sec
GD_IO_BY_W_SM 2013-08-24T19:55:42-05:00 Cumulative 60.191 MB
GD_IO_BY_W_SM_SEC 2013-08-24T19:55:42-05:00 Rate 0.000 MB/sec
GD_IO_ERRS 2013-08-24T19:55:42-05:00 Cumulative 0
GD_IO_ERRS_MIN 2013-08-24T19:55:42-05:00 Rate 0.0 /min
GD_IO_RQ_R_LG 2013-08-24T19:55:42-05:00 Cumulative 2,656 IO requests
GD_IO_RQ_R_LG_SEC 2013-08-24T19:55:42-05:00 Rate 0.0 IO/sec
GD_IO_RQ_R_SM 2013-08-24T19:55:42-05:00 Cumulative 4,086 IO requests
GD_IO_RQ_R_SM_SEC 2013-08-24T19:55:42-05:00 Rate 0.0 IO/sec
GD_IO_RQ_W_LG 2013-08-24T19:55:42-05:00 Cumulative 8,781 IO requests
GD_IO_RQ_W_LG_SEC 2013-08-24T19:55:42-05:00 Rate 0.0 IO/sec
GD_IO_RQ_W_SM 2013-08-24T19:55:42-05:00 Cumulative 1,326 IO requests
GD_IO_RQ_W_SM_SEC 2013-08-24T19:55:42-05:00 Rate 0.0 IO/sec
GD_BY_FC_DIRTY 2013-08-24T19:56:42-05:00 Instantaneous 0.000 MB
GD_IO_BY_R_LG 2013-08-24T19:56:42-05:00 Cumulative 2,656 MB
GD_IO_BY_R_LG_SEC 2013-08-24T19:56:42-05:00 Rate 0.000 MB/sec
GD_IO_BY_R_SM 2013-08-24T19:56:42-05:00 Cumulative 207 MB
GD_IO_BY_R_SM_SEC 2013-08-24T19:56:42-05:00 Rate 0.000 MB/sec
GD_IO_BY_W_LG 2013-08-24T19:56:42-05:00 Cumulative 8,378 MB
GD_IO_BY_W_LG_SEC 2013-08-24T19:56:42-05:00 Rate 0.000 MB/sec
GD_IO_BY_W_SM 2013-08-24T19:56:42-05:00 Cumulative 60.191 MB
GD_IO_BY_W_SM_SEC 2013-08-24T19:56:42-05:00 Rate 0.000 MB/sec
GD_IO_ERRS 2013-08-24T19:56:42-05:00 Cumulative 0
GD_IO_ERRS_MIN 2013-08-24T19:56:42-05:00 Rate 0.0 /min
GD_IO_RQ_R_LG 2013-08-24T19:56:42-05:00 Cumulative 2,656 IO requests
GD_IO_RQ_R_LG_SEC 2013-08-24T19:56:42-05:00 Rate 0.0 IO/sec
GD_IO_RQ_R_SM 2013-08-24T19:56:42-05:00 Cumulative 4,086 IO requests
GD_IO_RQ_R_SM_SEC 2013-08-24T19:56:42-05:00 Rate 0.0 IO/sec
GD_IO_RQ_W_LG 2013-08-24T19:56:42-05:00 Cumulative 8,781 IO requests
GD_IO_RQ_W_LG_SEC 2013-08-24T19:56:42-05:00 Rate 0.0 IO/sec
GD_IO_RQ_W_SM 2013-08-24T19:56:42-05:00 Cumulative 1,326 IO requests
GD_IO_RQ_W_SM_SEC 2013-08-24T19:56:42-05:00 Rate 0.0 IO/sec
GD_BY_FC_DIRTY 2013-08-24T19:57:42-05:00 Instantaneous 0.000 MB
GD_IO_BY_R_LG 2013-08-24T19:57:42-05:00 Cumulative 2,656 MB
GD_IO_BY_R_LG_SEC 2013-08-24T19:57:42-05:00 Rate 0.000 MB/sec
GD_IO_BY_R_SM 2013-08-24T19:57:42-05:00 Cumulative 207 MB
GD_IO_BY_R_SM_SEC 2013-08-24T19:57:42-05:00 Rate 0.000 MB/sec
GD_IO_BY_W_LG 2013-08-24T19:57:42-05:00 Cumulative 8,378 MB
GD_IO_BY_W_LG_SEC 2013-08-24T19:57:42-05:00 Rate 0.000 MB/sec
GD_IO_BY_W_SM 2013-08-24T19:57:42-05:00 Cumulative 60.191 MB
GD_IO_BY_W_SM_SEC 2013-08-24T19:57:42-05:00 Rate 0.000 MB/sec
GD_IO_ERRS 2013-08-24T19:57:42-05:00 Cumulative 0
GD_IO_ERRS_MIN 2013-08-24T19:57:42-05:00 Rate 0.0 /min
GD_IO_RQ_R_LG 2013-08-24T19:57:42-05:00 Cumulative 2,656 IO requests
GD_IO_RQ_R_LG_SEC 2013-08-24T19:57:42-05:00 Rate 0.0 IO/sec
GD_IO_RQ_R_SM 2013-08-24T19:57:42-05:00 Cumulative 4,086 IO requests
GD_IO_RQ_R_SM_SEC 2013-08-24T19:57:42-05:00 Rate 0.0 IO/sec
GD_IO_RQ_W_LG 2013-08-24T19:57:42-05:00 Cumulative 8,781 IO requests
GD_IO_RQ_W_LG_SEC 2013-08-24T19:57:42-05:00 Rate 0.0 IO/sec
GD_IO_RQ_W_SM 2013-08-24T19:57:42-05:00 Cumulative 1,326 IO requests
GD_IO_RQ_W_SM_SEC 2013-08-24T19:57:42-05:00 Rate 0.0 IO/sec
GD_BY_FC_DIRTY 2013-08-24T19:58:42-05:00 Instantaneous 0.000 MB
GD_IO_BY_R_LG 2013-08-24T19:58:42-05:00 Cumulative 2,656 MB
GD_IO_BY_R_LG_SEC 2013-08-24T19:58:42-05:00 Rate 0.000 MB/sec
GD_IO_BY_R_SM 2013-08-24T19:58:42-05:00 Cumulative 207 MB
GD_IO_BY_R_SM_SEC 2013-08-24T19:58:42-05:00 Rate 0.000 MB/sec
GD_IO_BY_W_LG 2013-08-24T19:58:42-05:00 Cumulative 8,378 MB
GD_IO_BY_W_LG_SEC 2013-08-24T19:58:42-05:00 Rate 0.000 MB/sec
GD_IO_BY_W_SM 2013-08-24T19:58:42-05:00 Cumulative 60.191 MB
GD_IO_BY_W_SM_SEC 2013-08-24T19:58:42-05:00 Rate 0.000 MB/sec
GD_IO_ERRS 2013-08-24T19:58:42-05:00 Cumulative 0
GD_IO_ERRS_MIN 2013-08-24T19:58:42-05:00 Rate 0.0 /min
GD_IO_RQ_R_LG 2013-08-24T19:58:42-05:00 Cumulative 2,656 IO requests
GD_IO_RQ_R_LG_SEC 2013-08-24T19:58:42-05:00 Rate 0.0 IO/sec
GD_IO_RQ_R_SM 2013-08-24T19:58:42-05:00 Cumulative 4,086 IO requests
GD_IO_RQ_R_SM_SEC 2013-08-24T19:58:42-05:00 Rate 0.0 IO/sec
GD_IO_RQ_W_LG 2013-08-24T19:58:42-05:00 Cumulative 8,781 IO requests
GD_IO_RQ_W_LG_SEC 2013-08-24T19:58:42-05:00 Rate 0.0 IO/sec
GD_IO_RQ_W_SM 2013-08-24T19:58:42-05:00 Cumulative 1,326 IO requests
GD_IO_RQ_W_SM_SEC 2013-08-24T19:58:42-05:00 Rate 0.0 IO/sec
GD_BY_FC_DIRTY 2013-08-24T19:59:42-05:00 Instantaneous 0.000 MB
GD_IO_BY_R_LG 2013-08-24T19:59:42-05:00 Cumulative 2,656 MB
GD_IO_BY_R_LG_SEC 2013-08-24T19:59:42-05:00 Rate 0.000 MB/sec
GD_IO_BY_R_SM 2013-08-24T19:59:42-05:00 Cumulative 207 MB
GD_IO_BY_R_SM_SEC 2013-08-24T19:59:42-05:00 Rate 0.000 MB/sec
GD_IO_BY_W_LG 2013-08-24T19:59:42-05:00 Cumulative 8,378 MB
GD_IO_BY_W_LG_SEC 2013-08-24T19:59:42-05:00 Rate 0.000 MB/sec
GD_IO_BY_W_SM 2013-08-24T19:59:42-05:00 Cumulative 60.191 MB
GD_IO_BY_W_SM_SEC 2013-08-24T19:59:42-05:00 Rate 0.000 MB/sec
GD_IO_ERRS 2013-08-24T19:59:42-05:00 Cumulative 0
GD_IO_ERRS_MIN 2013-08-24T19:59:42-05:00 Rate 0.0 /min
GD_IO_RQ_R_LG 2013-08-24T19:59:42-05:00 Cumulative 2,656 IO requests
GD_IO_RQ_R_LG_SEC 2013-08-24T19:59:42-05:00 Rate 0.0 IO/sec
GD_IO_RQ_R_SM 2013-08-24T19:59:42-05:00 Cumulative 4,086 IO requests
GD_IO_RQ_R_SM_SEC 2013-08-24T19:59:42-05:00 Rate 0.0 IO/sec
GD_IO_RQ_W_LG 2013-08-24T19:59:42-05:00 Cumulative 8,781 IO requests
GD_IO_RQ_W_LG_SEC 2013-08-24T19:59:42-05:00 Rate 0.0 IO/sec
GD_IO_RQ_W_SM 2013-08-24T19:59:42-05:00 Cumulative 1,326 IO requests
GD_IO_RQ_W_SM_SEC 2013-08-24T19:59:42-05:00 Rate 0.0 IO/sec
[oracle@myexa1db01 dbm1 bin]$
OEM
OEM 12c can also be used to monitor the storage cells, provided you have the System Monitoring plug-in for Exadata Storage Server installed. Although it may not provide all of the metrics reported by the command-line interface, it can give graphical representation of how the metric values change over time. Unfortunately, we do not have access to an OEM installation with this plug-in installed.
![]() Note As we don’t have access to the plug-in, our “choice” is the command-line interface. Others may choose OEM for the graphical representations it provides. The choice, ultimately, is yours to make. We, being old-school DBAs, prefer scripting to “flashy” graphic tools.
Note As we don’t have access to the plug-in, our “choice” is the command-line interface. Others may choose OEM for the graphical representations it provides. The choice, ultimately, is yours to make. We, being old-school DBAs, prefer scripting to “flashy” graphic tools.