
![]()
Storage Cell Monitoring
By now, we’ve covered Exadata architecture enough for you to know that the storage cells are independent of the database servers and provide their own metrics and counters. Since the database servers don’t directly communicate with the storage, it’s up to the storage cells to provide the database servers with the requested data. To help with that task, the storage cells have their own CPUs and memory, which provide additional resources to assist in the processing of data. They also have their own O/S-level user accounts, two of which we will concern ourselves with in this chapter.
The accounts of interest are celladmin and cellmonitor, and the nature of the task determines which of the two accounts you will use. As you could probably guess, the cellmonitor account can access the counters and metrics but cannot perform any administrative tasks. The celladmin account, too, can access the metrics and counters but also has administrative privileges to start and stop all cell services. Accessing the storage cells is the only way to truly monitor cell performance and diagnose cell-related performance issues.
Talking to the Storage Cells
Communicating with the storage cells will require logging in to the storage cells, and Exadata provides two specialized accounts for that purpose. The first account we will discuss is the cellmonitor account, an account capable of accessing cells’ performance metrics and counters. The cellmonitor account is a restricted account on the storage servers, having access only to its home directory and limited executable commands. The second account we will cover is celladmin , an administrative account with far more privilege and access to the storage cells at the operating-system level. Although the database servers do not directly communicate with the storage devices, it is possible to use ssh to log in to each available storage cell from any database server in the Exadata system, to check performance metrics.
![]() Note As the storage servers are running a Linux kernel, the “root” account also exists on each available storage cell, and user equivalence (the ability to log in without a password) is configured for all servers in the Exadata system for that account. Unless you are a database machine administrator (DMA), you won’t likely be granted “root” privileges. For enterprises where “root” access is associated with the system administrator (SA), the DBA will usually have access to both the celladmin and cellmonitor user accounts and their passwords. We will proceed with this chapter using the basic SA/DBA separation of duties.
Note As the storage servers are running a Linux kernel, the “root” account also exists on each available storage cell, and user equivalence (the ability to log in without a password) is configured for all servers in the Exadata system for that account. Unless you are a database machine administrator (DMA), you won’t likely be granted “root” privileges. For enterprises where “root” access is associated with the system administrator (SA), the DBA will usually have access to both the celladmin and cellmonitor user accounts and their passwords. We will proceed with this chapter using the basic SA/DBA separation of duties.
Where Shall I Go?
The names and IP addresses of the available storage servers can be found in the /etc/hosts file on any of the database servers in the Exadata system. An example of how these entries would appear in the /etc/hosts file follows.
### CELL Node Private Interface details
123.456.789.3    myexa1cel01-priv.mydomain.com       myexa1cel01-priv
123.456.789.4    myexa1cel02-priv.mydomain.com       myexa1cel02-priv
123.456.789.5    myexa1cel03-priv.mydomain.com       myexa1cel03-priv
123.456.789.6    myexa1cel04-priv.mydomain.com       myexa1cel04-priv
123.456.789.7    myexa1cel05-priv.mydomain.com       myexa1cel05-priv
123.456.789.8    myexa1cel06-priv.mydomain.com       myexa1cel06-priv
123.456.789.9    myexa1cel07-priv.mydomain.com       myexa1cel07-priv
A simple ssh command connects you to one of the available storage cells as cellmonitor.
ssh [email protected]
Unless you have passwordless ssh configured, a password will be required.
[email protected]'s password:
[cellmonitor@myexa1cel04 ∼]$
You are now connected to storage cell 4, using the cellmonitor account. Connecting to the remaining storage cells uses the same procedure, just a different cell name. The available commands are the same on all storage cells, but we will provide examples from only one cell, to avoid possible confusion.
What Shall I Do?
The goal is to monitor and manage the storage cells, so that areas such as the Smart Flash Cache and Smart Scans are functioning normally. Examining the metrics available to both accounts is necessary, to ensure that Exadata is performing at its peak and no hardware/firmware/configuration errors are causing problems for the end users.
What’s in a Name?
The cell metric names reported by cellsrvstat are fairly verbose, so they should not be difficult to understand. For example, the Smart I/O metrics have, in our estimation, clear and descriptive names.
Number of active smart IO sessions
High water mark of smart IO sessions
Number of completed smart IO sessions
Smart IO offload efficiency (percentage)
Size of IO avoided due to storage index (KB)
Current smart IO to be issued (KB)
Total smart IO to be issued (KB)
Current smart IO in IO (KB)
Total smart IO in IO (KB)
Current smart IO being cached in flash (KB)
Total smart IO being cached in flash (KB)
Current smart IO with IO completed (KB)
Total smart IO with IO completed (KB)
Current smart IO being filtered (KB)
Total smart IO being filtered (KB)
Current smart IO filtering completed (KB)
Total smart IO filtering completed (KB)
Current smart IO filtered size (KB)
Total smart IO filtered (KB)
Total cpu passthru output IO size (KB)
Total passthru output IO size (KB)
Current smart IO with results in send (KB)
Total smart IO with results in send (KB)
Current smart IO filtered in send (KB)
Total smart IO filtered in send (KB)
Total smart IO read from flash (KB)
Total smart IO initiated flash population (KB)
Total smart IO read from hard disk (KB)
Total smart IO writes (fcre) to hard disk (KB)
Number of smart IO requests < 512KB
Number of smart IO requests >= 512KB and < 1MB
Number of smart IO requests >= 1MB and < 2MB
Number of smart IO requests >= 2MB and < 4MB
Number of smart IO requests >= 4MB and < 8MB
Number of smart IO requests >= 8MB
Number of times smart IO buffer reserve failures
Number of times smart IO request misses
Number of times IO for smart IO not allowed to be issued
Number of times smart IO prefetch limit was reached
Number of times smart scan used unoptimized mode
Number of times smart fcre used unoptimized mode
Number of times smart backup used unoptimized mode
Such metrics make it an easy task to evaluate, for example, Smart I/O performance, as none of the metrics uses unclear abbreviations or names that may not accurately reflect the nature of the statistics reported.
Output from the cellcli interface can be difficult to read without the DETAIL keyword. This is why we prefer to use DETAIL, unless we are looking for specific metrics and want an abbreviated list of attributes. Both versions of the output produced from cellcli are provided in the next section.
Monitoring Basics
As cellmonitor
Available to you when connected as cellmonitor is CellCLI, the command-line interface to monitor the storage cell. A complete list of commands can be generated by typing help at the CellCLI> prompt.
[cellmonitor@myexa1cel04 ∼]$ cellcli
CellCLI: Release 11.2.3.2.1 - Production on Wed Aug 07 13:19:59 CDT 2013

Copyright (c) 2007, 2012, Oracle.  All rights reserved.
Cell Efficiency Ratio: 234

CellCLI> help

 HELP [topic]
   Available Topics:
        ALTER
        ALTER ALERTHISTORY
        ALTER CELL
        ALTER CELLDISK
        ALTER GRIDDISK
        ALTER IBPORT
        ALTER IORMPLAN
        ALTER LUN
        ALTER PHYSICALDISK
        ALTER QUARANTINE
        ALTER THRESHOLD
        ASSIGN KEY
        CALIBRATE
        CREATE
        CREATE CELL
        CREATE CELLDISK
        CREATE FLASHCACHE
        CREATE FLASHLOG
        CREATE GRIDDISK
        CREATE KEY
        CREATE QUARANTINE
        CREATE THRESHOLD
        DESCRIBE
        DROP
        DROP ALERTHISTORY
        DROP CELL
        DROP CELLDISK
        DROP FLASHCACHE
        DROP FLASHLOG
        DROP GRIDDISK
        DROP QUARANTINE
        DROP THRESHOLD
        EXPORT CELLDISK
        IMPORT CELLDISK
        LIST
        LIST ACTIVEREQUEST
        LIST ALERTDEFINITION
        LIST ALERTHISTORY
        LIST CELL
        LIST CELLDISK
        LIST FLASHCACHE
        LIST FLASHCACHECONTENT
        LIST FLASHLOG
        LIST GRIDDISK
        LIST IBPORT
        LIST IORMPLAN
        LIST KEY
        LIST LUN
        LIST METRICCURRENT
        LIST METRICDEFINITION
        LIST METRICHISTORY
        LIST PHYSICALDISK
        LIST QUARANTINE
        LIST THRESHOLD
        SET
        SPOOL
        START

CellCLI>
Because you are connected as cellmonitor, administrative commands such as ALTER, ASSIGN, CALIBRATE, DROP, EXPORT, and IMPORT are not available. These are reserved for the celladmin user account. DESCRIBE, LIST, and SET are available, as well as SPOOL, to send output to a file.
So what can you do as cellmonitor? You can perform monitoring tasks to ensure the cell is functioning properly. Note the long list of LIST commands. They are there to report on the important areas of storage cell operation, including the Smart Flash Cache. We’ll start out by looking at the Smart Flash Cache.
CellCLI> list flashcache attributes all
         myexa1cel04_FLASHCACHE  FD_08_myexa1cel04,FD_10_myexa1cel04,FD_00_myexa1cel04,FD_12_myexa1cel04,FD_03_myexa1cel04,FD_02_
myexa1cel04,FD_05_myexa1cel04,FD_01_myexa1cel04,FD_13_myexa1cel04,FD_04_myexa1cel04,FD_11_myexa1
cel04,FD_15_myexa1cel04,FD_07_myexa1cel04,FD_14_myexa1cel04,FD_09_myexa1cel04,FD_06_myexa1cel04     2013-07-09T17:33:53-05:00               1488.75G        7af2354f-1e3b-4932-b2be-4c57a1c03f33
1488.75G        normal

CellCLI>
The LIST FLASHCACHE ATTRIBUTES ALL command returns values for all of the available attributes but puts the output in a form that can be difficult to read. You can narrow down the list and only report on selected attributes.
CellCLI> list flashcache attributes name, degradedCelldisks, effectiveCacheSize
         myexa1cel04_FLASHCACHE          1488.75G

CellCLI>
Notice that the attribute names are not included in the output for any of the LIST FLASHCACHE ATTRIBUTES statements. You can use the DESCRIBE command to provide the attribute names, as follows:
CellCLI> describe flashcache
        name
        cellDisk
        creationTime
        degradedCelldisks
        effectiveCacheSize
        id
        size
        status

CellCLI>
You can also get a more user-friendly output by using the LIST FLASHCACHE DETAIL command, as follows:
CellCLI> list flashcache detail
         name:                   myexa1cel04_FLASHCACHE
         cellDisk:               FD_08_myexa1cel04,FD_10_myexa1cel04,FD_00_myexa1cel04,FD_12_myexa1cel04,FD_03_myexa1cel04,FD_02_
myexa1cel04,FD_05_myexa1cel04,FD_01_myexa1cel04,FD_13_myexa1cel04,FD_04_myexa1cel04,FD_11_myexa1
cel04,FD_15_myexa1cel04,FD_07_myexa1cel04,FD_14_myexa1cel04,FD_09_myexa1cel04,FD_06_myexa1cel04
         creationTime:           2013-07-09T17:33:53-05:00
         degradedCelldisks:
         effectiveCacheSize:     1488.75G
         id:                     7af2354f-1e3b-4932-b2be-4c57a1c03f33
         size:                   1488.75G
         status:                 normal
CellCLI>
The output is formatted at one line per attribute, with the names provided, so you know which attribute has what value. Looking at the attributes, the size is reported, and it’s less than the 1600GB the Smart Flash Cache has in total. This is not a problem, since Flash Log is also configured from the Smart Flash Cache storage and consumes 512MB of the total cache size. Flash Log enables Oracle to write redo to both the redo logfiles and the flash storage, to speed up transaction processing. The writes that complete first signal Oracle that the transaction has been successfully recorded in the redo stream. This allows for faster transaction time and higher throughput, because Oracle isn’t waiting on the redo log writes. You can report on the Flash Log just as you can the flash cache.
CellCLI> list flashlog detail
         name:                   myexa1cel04_FLASHLOG
         cellDisk:               FD_14_myexa1cel04,FD_05_myexa1cel04,FD_00_myexa1cel04,FD_01_myexa1cel04,FD_04_myexa1cel04,FD_07_
myexa1cel04,FD_09_odevx1cel04,FD_02_myexa1cel04,FD_08_myexa1cel04,FD_03_myexa1cel04,FD_15_
myexa1cel04,FD_12_myexa1cel04,FD_11_myexa1cel04,FD_06_myexa1cel04,FD_10_myexa1cel 04,FD_13_
myexa1cel04
         creationTime:           2013-07-09T17:33:31-05:00
         degradedCelldisks:
         effectiveSize:          512M
         efficiency:             100.0
         id:                     7eb480f9-b94a-4493-bfca-3ba00b6618bb
         size:                   512M
         status:                 normal

CellCLI>
The total size reported between the Smart Flash Cache and the Flash Log for this cell is 1489.25GB, which is still less than the 1600GB allocated to the cache. Like physical disks, the “disks” used in the Smart Flash Cache also have to reserve space for operating-system management tasks, such as inode lists and the like. There is no need to worry, as the allocated space is more than enough to provide excellent performance from the Smart Flash Cache. Should the size be less than 1488.75GB, this is an indication that one or more of the flash disks have problems. We will cover that issue in a later section using the celladmin account.
You can also list details about the grid disks, the physical drives configured in the storage tier. LIST GRIDDISK ATTRIBUTES name, size reports the following output:
CellCLI> list griddisk attributes name, size;
         DATA_MYEXA1_CD_00_Myexa1cel04   2208G
         DATA_MYEXA1_CD_01_Myexa1cel04   2208G
         DATA_MYEXA1_CD_02_Myexa1cel04   2208G
...
         DBFS_DG_CD_02_Myexa1cel04       33.796875G
         DBFS_DG_CD_03_Myexa1cel04       33.796875G
         DBFS_DG_CD_04_Myexa1cel04       33.796875G
...
         RECO_MYEXA1_CD_00_Myexa1cel04   552.109375G
         RECO_MYEXA1_CD_01_Myexa1cel04   552.109375G
         RECO_MYEXA1_CD_02_Myexa1cel04   552.109375G
...
         RECO_MYEXA1_CD_11_Myexa1cel04   552.109375G

CellCLI>
The disk group name is part of the disk name, making it fairly easy to see the space, per disk, for each of the disk groups. More detailed information is available using LIST GRIDDISK DETAIL; a partial report follows:
CellCLI> list griddisk detail
         name:                   DATA_MYEXA1_CD_00_Myexa1cel04
         asmDiskgroupName:       DATA_MYEXA1
         asmDiskName:            DATA_MYEXA1_CD_00_MYEXA1CEL04
         asmFailGroupName:       MYEXA1CEL04
         availableTo:
         cachingPolicy:          default
         cellDisk:               CD_00_Myexa1cel04
         comment:
         creationTime:           2013-07-09T17:36:41-05:00
         diskType:               HardDisk
         errorCount:             0
         id:                     aa946f1e-f7c4-4fee-8660-4c69c830ef59
         offset:                 32M
         size:                   2208G
         status:                 active

Myexa1celMYEXA1CELMYEXA1CELMyexa1celMyexa1celMYEXA1CELMYEXA1CELMyexa1celMyexa1celMYEXA1CELMYEXA1
CELMyexa1celMyexa1celMYEXA1CELMYEXA1CELMyexa1celMyexa1celMYEXA1CELMYEXA1CELMyexa1celMyexa1celMYE
XA1CELMYEXA1CELMyexa1cel...

CellCLI>
This is a lot of information to process, and you don’t really need all of it to monitor the grid disks. One benefit to using the DETAIL option to any of the LIST commands is that the entire attribute list is provided in an attribute: value output format. Some of the LIST commands produce a long list of output (like the LIST GRIDDISK DETAIL example), so you might want to wait until the output stops scrolling to take note of the available attributes. With an attribute list in hand, you can then report on attributes that interest you. For example, looking at the output from LIST GRIDDISK ATTRIBUTES name, celldisk, offset, size, status, a much more manageable and readable report is generated.
CellCLI> LIST GRIDDISK ATTRIBUTES name, celldisk, offset, size, status
         DATA_MYEXA1_CD_00_myexa1celMyexa1cel04   CD_00_myexa1celMyexa1cel04       32M             2208G           active
         DATA_MYEXA1_CD_01_myexa1celMyexa1cel04   CD_01_myexa1celMyexa1cel04       32M             2208G           active
myexa1celmyexa1celmyexa1celmyexa1celmyexa1celmyexa1celmyexa1celmyexa1celmyexa1celmyexa1celmyexa1celmyexa1celmyexa1celmyexa1celmyexa1celmyexa1celmyexa1celmyexa1celmyexa1celmyexa1celmyexa1celmyexa1cel...
         DBFS_DG_CD_03_myexa1celMyexa1cel04       CD_03_myexa1celMyexa1cel04       2760.15625G     33.796875G      active
         DBFS_DG_CD_04_myexa1celMyexa1cel04       CD_04_myexa1celMyexa1cel04       2760.15625G     33.796875G      active
         DBFS_DG_CD_05_myexa1celMyexa1cel04       CD_05_myexa1celMyexa1cel04       2760.15625G     33.796875G      active
myexa1celmyexa1celmyexa1celmyexa1celmyexa1celmyexa1celmyexa1celmyexa1celmyexa1celmyexa1celmyexa1celmyexa1cel...
         RECO_MYEXA1_CD_00_myexa1celMyexa1cel04   CD_00_myexa1celMyexa1cel04       2208.046875G    552.109375G     active
         RECO_MYEXA1_CD_01_myexa1celMyexa1cel04   CD_01_myexa1celMyexa1cel04       2208.046875G    552.109375G     active
         RECO_MYEXA1_CD_02_myexa1celMyexa1cel04   CD_02_myexa1celMyexa1cel04       2208.046875G    552.109375G     active
myexa1celmyexa1celmyexa1celmyexa1celmyexa1celmyexa1celmyexa1celmyexa1celmyexa1celmyexa1celmyexa1celmyexa1celmyexa1celmyexa1celmyexa1celmyexa1celmyexa1celmyexa1cel...

CellCLI>
During Exadata configuration, the disks are divided into slices, based on data found in the /opt/oracle.SupportTools/onecommand/onecommand.params file. By default, the SizeArr variable is set to 2208GB, which is the size for the slice allocated for the data disk group. Other slice sizes are derived from that initial setting. (It is possible to change the disk allocations; that process will be discussed in Chapter 11.) Each disk has 32MB configured for management processes and data, which explains the offset for the first available disk slice ASM can use. In the posted example, that first slice is allocated for the DATA_MYEXA1 disk group, and it’s 2208GB in size. The next available slice is for the recovery disk group, and it’s 565360MB in size. The final slice is for the DBFS disk group and provides 34608MB of storage. Each offset after the initial 32MB is the 32MB plus the size of the configured slice; it provides the “starting point” for each area of ASM configured storage on the disk.
The cellmonitor account is a good starting point for looking at the storage cells at the server level, but it’s restricted, in that it’s simply a monitoring account and provides no access to managing the cells. To dig deeper into the cells and provide additional statistics and metrics, you will have to use the celladmin account.
Connecting to the cells as celladmin is no different from connecting as cellmonitor; however, celladmin provides much more access to functionality and metrics. In addition to cellcli, the celladmin account can also access cellsrvstat , which can provide additional statistics and metrics not reported by cellcli.
When connected as celladmin, the cellcli interface provides the full list of functions provided earlier in this chapter. Since it is an administrative account, you can perform the following actions that cellmonitor cannot:
ALTER ALERTHISTORY
ALTER CELL
ALTER CELLDISK
ALTER GRIDDISK
ALTER IBPORT
ALTER IORMPLAN
ALTER LUN
ALTER PHYSICALDISK
ALTER QUARANTINE
ALTER THRESHOLD
ASSIGN KEY
CREATE CELL
CREATE CELLDISK
CREATE FLASHCACHE
CREATE FLASHLOG
CREATE GRIDDISK
CREATE KEY
CREATE QUARANTINE
CREATE THRESHOLD
DESCRIBE
DROP ALERTHISTORY
DROP CELL
DROP CELLDISK
DROP FLASHCACHE
DROP FLASHLOG
DROP GRIDDISK
DROP QUARANTINE
DROP THRESHOLD
EXPORT CELLDISK
IMPORT CELLDISK
Of the available metrics on the storage cells, the alert history is a good place to start looking for possible problems. Looking at the output from LIST ALERTHISTORY DETAIL, we see the following:
CellCLI> list alerthistory detail
         name:                   1_1
         alertMessage:           "Cell configuration checkdiscovered the following problems:
Check Exadata configuration via ipconf utility Verifying of Exadata configuration file /opt/oracle.cellos/cell.conf Error. Exadata configuration file not found /opt/oracle.cellos/cell.conf [INFO] The ipconf check may generate a failure for temporary inability to reach NTP or DNS server. You may ignore this alert, if the NTP or DNS servers are valid and available. [INFO] You may ignore this alert, if the NTP or DNS servers are valid and available. [INFO] As root user run /usr/local/bin/ipconf -verify -semantic to verify consistent network configurations."
         alertSequenceID:        1
         alertShortName:         Software
         alertType:              Stateful
         beginTime:              2013-05-14T22:31:59-05:00
         endTime:                2013-06-20T11:36:18-05:00
         examinedBy:
         metricObjectName:       checkconfig
         notificationState:      0
         sequenceBeginTime:      2013-05-14T22:31:59-05:00
         severity:               critical
         alertAction:            "Correct the configuration problems. Then run cellcli command:
ALTER CELL VALIDATE CONFIGURATION   Verify that the new configuration is correct."

myexa1celmyexa1cel....

         name:                   4_1
         alertMessage:           "The disk controller battery is executing a learn cycle and may
temporarily enter WriteThrough Caching mode as part of the learn cycle. Disk write throughput
might be temporarily lower during this time. The flash drives are not affected. The battery
learn cycle is a normal maintenance activity that occurs quarterly and runs for approximately 1
to 12 hours.  Note that many learn cycles do not require entering WriteThrough caching mode.
When the disk controller cache returns to the normal WriteBack caching mode, an additional
informational alert will be sent.  Battery Serial Number : 6360  Battery Type          : iBBU08
Battery Temperature   : 35 C  Full Charge Capacity  : 1342 mAh  Relative Charge       : 97 %
Ambient Temperature   : 22 C"
         alertSequenceID:        4
         alertShortName:         Hardware
         alertType:              Stateful
         beginTime:              2013-07-17T04:00:56-05:00
         endTime:                2013-07-17T10:09:16-05:00
         examinedBy:
         metricObjectName:       LUN_LEARN_CYCLE_ALERT
         notificationState:      0
         sequenceBeginTime:      2013-07-17T04:00:56-05:00
         severity:               info
         alertAction:            Informational.

         name:                   4_2
         alertMessage:           "All disk drives are in WriteBack caching mode.  Battery Serial
Number : 6360  Battery Type          : iBBU08  Battery Temperature   : 39 C  Full Charge
Capacity  : 1345 mAh  Relative Charge       : 52 %  Ambient Temperature   : 21 C"
         alertSequenceID:        4
         alertShortName:         Hardware
         alertType:              Stateful
         beginTime:              2013-07-17T10:09:16-05:00
         endTime:                2013-07-17T10:09:16-05:00
         examinedBy:
         metricObjectName:       LUN_LEARN_CYCLE_ALERT
         notificationState:      0
         sequenceBeginTime:      2013-07-17T04:00:56-05:00
         severity:               clear
         alertAction:            Informational.

CellCLI>
Here you can see the alert name, the message, the time frame for the alert, the severity, and the action, among other attributes. Notice, also, the examinedBy attribute. This reports the user id or alias of the DBA or DMA who examined the alert. Setting this attribute is a good idea, once the alert history has been read, as it allows other DBAs or DMAs active on the system to know these alerts have been read. This is a fairly easy task to complete, as it can be done for all alerts in the history or only on those that meet certain criteria, such as alertType=‘Stateful’ or alertShortName=‘Software’. You can set examinedBy for all alerts in the history, by using the following command:
CellCLI> alter alerthistory all examinedBy=dfitzj01
Alert 1_1 successfully altered
Alert 1_2 successfully altered
Alert 2 successfully altered
Alert 3_1 successfully altered
Alert 3_2 successfully altered
Alert 4_1 successfully altered
Alert 4_2 successfully altered

CellCL>
If there are acknowledged and unacknowledged alerts, you will have to set examinedBy for the unacknowledged alerts by name; the WHERE clause is only available for the LIST command. You can find the unacknowledged alerts using the following command:
CellCLI> list alerthistory attributes name where examinedBy = ''
         1_1
         1_2
         2
         3_1
         3_2
         4_1
         4_2

CellCLI>
This gives you the names of all unacknowledged alerts. You can now update these by name, as follows:
CellCLI> alter alerthistory 1_1,1_2,2,3_1,3_2,4_1,4_2 examinedBy=dfitzj01
Alert 1_1 successfully altered
Alert 1_2 successfully altered
Alert 2 successfully altered
Alert 3_1 successfully altered
Alert 3_2 successfully altered
Alert 4_1 successfully altered
Alert 4_2 successfully altered

CellCLI>
In this case, all alerts were unacknowledged, but using ALL will cause you to lose any examinedBy values already set for acknowledged alerts. You should get into the habit of setting examinedBy for alerts as you read them, because exachk, the Exadata system validation utility, checks for unexamined alerts.
Some alerts notify you of actions you must take, such as firmware revisions for the storage servers. Others notify you of support issues Oracle has to address, such as faulty disks and PCIe cards. These alerts are informative and let you know what needs to be done, so you can decide who is to do the work. Actual hardware issues fall into the realm of Oracle Customer Support (OCS), and issues such as firmware upgrades can be done on-site by the DBA and/or SA.
Other metrics available to the celladmin user are generated by the cellsrvstat utility. Five categories of statistics are reported, with both cumulative and current delta values. Simply running the utility from the command prompt, without any additional parameters or qualifiers, produces the following output:
[celladmin@myexa1celMyexa1cel05 ∼]$ cellsrvstat
===Current Time=== Mon Aug 12 22:57:41 2013
== Input/Output related stats ==
Number of hard disk block IO read requests 0 670402182
Number of hard disk block IO write requests 0 682463432
Hard disk block IO reads (KB) 0 330820733723
Hard disk block IO writes (KB) 0 43747895151
Number of flash disk block IO read requests 0 1195284486
Number of flash disk block IO write requests 0 369512940
Flash disk block IO reads (KB) 0 10211102636
Flash disk block IO writes (KB) 0 6340334020
Number of disk IO errors 0 0
Number of reads from flash cache 0 1191640708
Number of writes to flash cache 0 67271278
Flash cache reads (KB) 0 10209174920
Flash cache writes (KB) 0 0
Number of flash cache IO errors 0 0
Size of eviction from flash cache (KB) 0 0
Number of outstanding large flash IOs 0 0
Number of latency threshold warnings during job 0 87255
Number of latency threshold warnings by checker 0 0
Number of latency threshold warnings for smart IO 0 0
Number of latency threshold warnings for redo log writes 0 1625
Current read block IO to be issued (KB) 0 0
Total read block IO to be issued (KB) 0 31352009247
Current write block IO to be issued (KB) 0 0
Total write block IO to be issued (KB) 0 42382773866
Current read blocks in IO (KB) 0 0
Total read block IO issued (KB) 0 31352009247
Current write blocks in IO (KB) 0 560
Total write block IO issued (KB) 0 42382773866
Current read block IO in network send (KB) 0 0
Total read block IO in network send (KB) 0 31352009247
Current write block IO in network send (KB) 0 0
Total write block IO in network send (KB) 0 42382773306
Current block IO being populated in flash (KB) 0 0
Total block IO KB populated in flash (KB) 0 1012902872
== Memory related stats ==
SGA heap used - kgh statistics (KB) 0 1050259
SGA heap free - cellsrv statistics (KB) 0 209261
OS memory allocated to SGA (KB) 0 1259525
SGA heap used - cellsrv statistics - KB 0 1050264
OS memory allocated to PGA (KB) 0 21784
PGA heap used - cellsrv statistics (KB) 0 8723
OS memory allocated to cellsrv (KB) 0 22726298
Top 5 SGA consumers (KB)
storidx:arrayRIDX 0 267676
storidx::arraySeqRIDX 0 267676
FlashCacheCtx 0 101609
Thread IO Lat Stats 0 98440
SUBHEAP Networ 0 81937
Top 5 SGA subheap consumers (KB)
oracle_fp_init_scan:fplibCtx 0 206406797
oracle_fp_init_scan:fplibmd 0 170654364
SageCacheInitScan : ctx 0 13481725
SageTxnInitScan : ctx 0 8523711
oracle_fp_reinit_md:fplibfmd 0 2537710
Number of allocation failures in 512 bytes pool 0 0
Number of allocation failures in 2KB pool 0 0
Number of allocation failures in 4KB pool 0 0
Number of allocation failures in 8KB pool 0 0
Number of allocation failures in 16KB pool 0 0
Number of allocation failures in 32KB pool 0 0
Number of allocation failures in 64KB pool 0 0
Number of allocation failures in 1MB pool 0 0
Allocation hwm in 512 bytes pool 0 1955
Allocation hwm in 2KB pool 0 1091
Allocation hwm in 4KB pool 0 2244
Allocation hwm in 8KB pool 0 2048
Allocation hwm in 16KB pool 0 963
Allocation hwm in 32KB pool 0 1068
Allocation hwm in 64KB pool 0 1621
Allocation hwm in 1MB pool 0 1725
Number of low memory threshold failures 0 0
Number of no memory threshold failures 0 0
Dynamic buffer allocation requests 0 0
Dynamic buffer allocation failures 0 0
Dynamic buffer allocation failures due to low mem 0 0
Dynamic buffer allocated size (KB) 0 0
Dynamic buffer allocation hwm (KB) 0 0
== Execution related stats ==
Incarnation number 0 6
Number of module version failures 0 0
Number of threads working 0 1
Number of threads waiting for network 0 19
Number of threads waiting for resource 0 1
Number of threads waiting for a mutex 0 0
Number of Jobs executed for each job type
CacheGet 0 1485087768
CachePut 0 680448625
CloseDisk 0 9210374
OpenDisk 0 11546018
ProcessIoctl 0 4581873
PredicateDiskRead 0 12992231
PredicateDiskWrite 0 27125
PredicateFilter 0 13896087
PredicateCacheGet 0 139408284
PredicateCachePut 0 79265728
FlashCacheMetadataWrite 0 0
RemoteListenerJob 0 0
FlashCacheResilveringTableUpdate 0 0
CellDiskMetadataPrepare 0 0
SQL ids consuming the most CPU
MYDB 0000000000000 82
MYDB2 0000000000000 1
OKRA 1g3c5u9p6fpwr 15
MYDB bnrjgybpsu009 2
MYDB3 0000000000000 1
END SQL ids consuming the most CPU
== Network related stats ==
Total bytes received from the network 0 969635109657
Total bytes transmitted to the network 0 122811940168
Total bytes retransmitted to the network 0 0
Number of active sendports 0 168
Hwm of active sendports 0 1678
Number of active remote open infos 0 1975
HWM of remote open infos 0 6472
== SmartIO related stats ==
Number of active smart IO sessions 0 3
High water mark of smart IO sessions 0 186
Number of completed smart IO sessions 0 9006624
Smart IO offload efficiency (percentage) 0 8
Size of IO avoided due to storage index (KB) 0 55764980592
Current smart IO to be issued (KB) 0 3072
Total smart IO to be issued (KB) 0 366554357584
Current smart IO in IO (KB) 0 0
Total smart IO in IO (KB) 0 365924276816
Current smart IO being cached in flash (KB) 0 0
Total smart IO being cached in flash (KB) 0 0
Current smart IO with IO completed (KB) 0 7776
Total smart IO with IO completed (KB) 0 375182446096
Current smart IO being filtered (KB) 0 0
Total smart IO being filtered (KB) 0 375150215792
Current smart IO filtering completed (KB) 0 58848
Total smart IO filtering completed (KB) 0 365818995944
Current smart IO filtered size (KB) 0 10187
Total smart IO filtered (KB) 0 29376577170
Total cpu passthru output IO size (KB) 0 0
Total passthru output IO size (KB) 0 0
Current smart IO with results in send (KB) 0 0
Total smart IO with results in send (KB) 0 365498643760
Current smart IO filtered in send (KB) 0 0
Total smart IO filtered in send (KB) 0 29283529373
Total smart IO read from flash (KB) 0 0
Total smart IO initiated flash population (KB) 0 0
Total smart IO read from hard disk (KB) 0 617450473088
Total smart IO writes (fcre) to hard disk (KB) 0 1365452520
Number of smart IO requests < 512KB 0 73658951
Number of smart IO requests >= 512KB and < 1MB 0 15965416
Number of smart IO requests >= 1MB and < 2MB 0 1146863
Number of smart IO requests >= 2MB and < 4MB 0 12189413
Number of smart IO requests >= 4MB and < 8MB 0 73111527
Number of smart IO requests >= 8MB 0 0
Number of times smart IO buffer reserve failures 0 0
Number of times smart IO request misses 0 473544
Number of times IO for smart IO not allowed to be issued 0 30383972
Number of times smart IO prefetch limit was reached 0 5041176
Number of times smart scan used unoptimized mode 0 0
Number of times smart fcre used unoptimized mode 0 0
Number of times smart backup used unoptimized mode 0 0
[celladmin@myexa1celMyexa1cel05 ∼]$
It’s unnecessary to return all of that output if you’re only monitoring the Smart I/O metrics. It’s possible to monitor a single stat group, if you wish. As an example, we’ll monitor the smartio stat group.
[celladmin@myexa1celMyexa1cel05 ∼]$ cellsrvstat -stat_group=smartio

===Current Time===                                      Sat Mar 16 15:29:33 2013

== SmartIO related stats ==
Number of active smart IO sessions                              0              2
High water mark of smart IO sessions                            0              3
Number of completed smart IO sessions                           0             18
Smart IO offload efficiency (percentage)                        0              0
Size of IO avoided due to storage index (KB)                    0      123950808
Current smart IO to be issued (KB)                          10208          28576
Total smart IO to be issued (KB)                          2652520     6416726632
Current smart IO in IO (KB)                                 -4096          10176
Total smart IO in IO (KB)                                 2642312     6416698056
Current smart IO being cached in flash (KB)                     0              0
Total smart IO being cached in flash (KB)                       0              0
Current smart IO with IO completed (KB)                         0              0
Total smart IO with IO completed (KB)                     2646408     6416688024
Current smart IO being filtered (KB)                        -1024              0
Total smart IO being filtered (KB)                        2646408     6416688024
Current smart IO filtering completed (KB)                    1024           1024
Total smart IO filtering completed (KB)                   2647432     6416687880
Current smart IO filtered size (KB)                             1              1
Total smart IO filtered (KB)                                  394         966771
Total cpu passthru output IO size (KB)                          0              0
Total passthru output IO size (KB)                              0              0
Current smart IO with results in send (KB)                      0              0
Total smart IO with results in send (KB)                  2646408     6416675592
Current smart IO filtered in send (KB)                          0              0
Total smart IO filtered in send (KB)                          393         966769
Total smart IO read from flash (KB)                             0              0
Total smart IO initiated flash population (KB)                  0              0
Total smart IO read from hard disk (KB)                   2642312     6292747248
Total smart IO writes (fcre) to hard disk (KB)                  0              0
Number of smart IO requests < 512KB                            52         128995
Number of smart IO requests >= 512KB and < 1MB                260         604218
Number of smart IO requests >= 1MB and < 2MB                    0             35
Number of smart IO requests >= 2MB and < 4MB                  286         697848
Number of smart IO requests >= 4MB and < 8MB                  299         723438
Number of smart IO requests >= 8MB                              0              0
Number of times smart IO buffer reserve failures                0              0
Number of times smart IO request misses                        18          55773
Number of times IO for smart IO not allowed to be issued        0          10072
Number of times smart IO prefetch limit was reached             0              0
Number of times smart scan used unoptimized mode                0              0
Number of times smart fcre used unoptimized mode                0              0
Number of times smart backup used unoptimized mode              0              0

[celladmin@myexa1celMyexa1cel05 ∼]$
The current statistics deltas are the first numbers displayed, and the cumulative statistics, from the cell start to the current time, are in the last numeric column. Because the first numbers listed are deltas, they can be negative between runs.
Seeing negative numbers shouldn’t be a concern, but seeing several runs of 0’s in the deltas should be a flag to check the queries, to see if they qualify for Smart Scans, and the storage cells, for alerts that could affect Smart Scan performance. We have seen systems where firmware mismatches caused Smart Scan issues when the affected disks were accessed. Upgrading the firmware solved the Smart Scan problems.
We use the following metrics when monitoring Smart I/O at the storage cell level:
Size of IO avoided due to storage index (KB)                    0      123950808
Current smart IO to be issued (KB)                          10208          28576
Total smart IO read from hard disk (KB)                   2642312     6292747248
Number of smart IO requests < 512KB                            52         128995
Number of smart IO requests >= 512KB and < 1MB                260         604218
Number of smart IO requests >= 1MB and < 2MB                    0             35
Number of smart IO requests >= 2MB and < 4MB                  286         697848
Number of smart IO requests >= 4MB and < 8MB                  299         723438
Number of smart IO requests >= 8MB                              0              0
The size of IO avoided due to storage index (KB) provides you with another way to check for use of a storage index during a Smart Scan. You can see the current delta from the last two snapshots and the cumulative savings reported. current smart IO to be issued (KB) reports on the KB of data that qualify for Smart Scan processing as of the current snapshot, indicating that Smart Scans are active. The total smart IO read from hard disk metric reports the amount of data processed by Smart Scans that was read from the disks rather than from the cache. The number of smart IO requests metrics allow us to know the size ranges of the data requested by those scans and how many requests are generated for a given range, providing another measure of Smart Scan performance.
Sometimes execution plans get quarantined by Exadata. Usually, this is a result of an ORA-07445 error reported for O/S level failures. Additionally, the affected disk-storage region can be quarantined, which disables Smart Scans for that region, as well as for any queries using the quarantined plan or plans. The alert history will report such errors, and an example of such an alertMessage follows:
alertMessage: "ORA-7445: exception encountered: core dump
[kdzsBufferCUPiece()+35] [11] [0x000000000] [] [] []"
The following entry in the alert history shows an entry similar to the following:
alertMessage: "A SQL PLAN quarantine has been added. As a result,
Smart Scan is disabled for SQL statements with the quarantined SQL plan.
Quarantine id : 1 Quarantine type : SQL PLAN Quarantine reason :
  : 1dx1zzf5bwd07 SQL Plan details : {SQL_PLAN_HASH_VALUE=2181142203,
PLAN_LINE_ID=19} In addition, the following disk region has been
quarantined, and Smart Scan will be disabled for this region: Disk Region :
Such errors need to be addressed, but after they are corrected, the affected plans are still quarantined. To see which plans are quarantined, use the LIST QUARANTINE statement from cellcli. The command will display the following attributes for each quarantined plan:
name
cellsrvChecksum
clientPID
comment                 modifiable
crashReason
creationTime
dbUniqueID
dbUniqueName
incidentID
ioBytes
ioGridDisk
ioOffset
planLineID
quarantineReason
quarantineType
remoteHostName
rpmVersion
sqlID
sqlPlanHashValue
To clear the quarantine, use the drop quarantine command. If all issues that created quarantined plans have not been addressed, it is also possible to drop only the quarantined plans where the cause has been corrected. This uses the drop quarantine [name, name, name, name, ...] syntax and drops only the listed named quarantines. Once the quarantines are dropped, you should see Smart Scan performance restored for the once-affected plans.
It’s best to use both accounts to monitor the storage cells on a regular basis, using cellmonitor for daily tasks and celladmin for those times when the output provided by the cellmonitor scripts indicate possible problems. It’s a simple task to submit both cellcli and cellsrvstat commands to the storage servers from scripts on the database servers. For cellcli:
cellcli -e "command"
As an example:
[celladmin@myexa1celMyexa1cel05 ∼]$ cellcli -e "list flashcache detail"
         name:                   myexa1celMyexa1cel05_FLASHCACHE
         cellDisk:               FD_11_myexa1celMyexa1cel05,FD_03_myexa1celMyexa1cel05,FD_15_myexa1celMyexa1cel05,FD_13_myexa1cel
Myexa1cel05,FD_08_myexa1celMyexa1cel05,FD_10_myexa1celMyexa1cel05,FD_00_myexa1celMyexa1cel05,FD_
14_myexa1celMyexa1cel05,FD_04_myexa1celMyexa1cel05,FD_06_myexa1celMyexa1cel05,FD_07_myexa1celMy
exa1cel05,FD_05_myexa1celMyexa1cel05,FD_12_myexa1celMyexa1cel05,FD_09_myexa1celMyexa1cel05,FD_02_
myexa1celMyexa1cel05,FD_01_myexa1celMyexa1cel05
         creationTime:           2013-07-09T17:33:53-05:00
         degradedCelldisks:
         effectiveCacheSize:     1488.75G
         id:                     8a380bf9-06c3-445e-8081-cff72d49bfe6
         size:                   1488.75G
         status:                 normal
[celladmin@myexa1celMyexa1cel05 ∼]$
You need not enter the cellcli interactive interface to return data from cellcli. The cellsrvstat utility operates in a similar way, as the following example shows:
[celladmin@myexa1celMyexa1cel05 ∼]$ cellsrvstat -stat_group=smartio -interval=1 -count=10

...
== SmartIO related stats ==
Number of active smart IO sessions                              0              2
High water mark of smart IO sessions                            0              3
Number of completed smart IO sessions                           0             44
Smart IO offload efficiency (percentage)                        0              0
Size of IO avoided due to storage index (KB)                    0      139751400
Current smart IO to be issued (KB)                          10208          18368
Total smart IO to be issued (KB)                          2652520    13375858840
Current smart IO in IO (KB)                                  -992          10240
Total smart IO in IO (KB)                                 2642312    13375840472
Current smart IO being cached in flash (KB)                     0              0
Total smart IO being cached in flash (KB)                       0              0
Current smart IO with IO completed (KB)                         0              0
Total smart IO with IO completed (KB)                     2643304    13375830376
Current smart IO being filtered (KB)                            0              0
Total smart IO being filtered (KB)                        2643304    13375830376
Current smart IO filtering completed (KB)                    1024           1024
Total smart IO filtering completed (KB)                   2643304    13375830232
Current smart IO filtered size (KB)                             1              1
Total smart IO filtered (KB)                                  393        1999243
Total cpu passthru output IO size (KB)                          0              0
Total passthru output IO size (KB)                              0              0
Current smart IO with results in send (KB)                      0              0
Total smart IO with results in send (KB)                  2642280    13375817944
Current smart IO filtered in send (KB)                          0              0
Total smart IO filtered in send (KB)                          392        1999241
Total smart IO read from flash (KB)                             0              0
Total smart IO initiated flash population (KB)                  0              0
Total smart IO read from hard disk (KB)                   2642312    13236089072
Total smart IO writes (fcre) to hard disk (KB)                  0              0
Number of smart IO requests < 512KB                            52         265049
Number of smart IO requests >= 512KB and < 1MB                260        1284245
Number of smart IO requests >= 1MB and < 2MB                    0             82
Number of smart IO requests >= 2MB and < 4MB                  286        1446473
Number of smart IO requests >= 4MB and < 8MB                  299        1510123
Number of smart IO requests >= 8MB                              0              0
...
This example also illustrates that cellsrvstat can in seconds automatically generate data for a specified number of runs at a specified interval. Automating these commands from the database servers uses ssh to log in to the storage cell and pass the desired command to the command prompt. An example for cellsrvstat follows:
echo "=========================================================================================="
echo "======================================= Cell 1 ==========================================="
echo "=========================================================================================="
/usr/bin/ssh [email protected]   "cellsrvstat -stat_group=smartio -interval=$1 -count=$2"
echo "=========================================================================================="
echo "======================================= Cell 2" ===========================================
echo "=========================================================================================="
/usr/bin/ssh [email protected]  "cellsrvstat -stat_group=smartio -interval=$1 -count=$2"
echo "=========================================================================================="
echo "======================================= Cell 3" ===========================================
echo "=========================================================================================="
/usr/bin/ssh [email protected]  "cellsrvstat -stat_group=smartio -interval=$1 -count=$2"
![]() Note This script relies on passwordless login for celladmin to the various storage cells and, because of this, can run from cron. If passwordless login is not configured, the script can be run manually from the command prompt, and it will ask for the password before continuing. Since there are numerous resources describing how to set up passwordless access across servers, we won’t discuss that here.
Note This script relies on passwordless login for celladmin to the various storage cells and, because of this, can run from cron. If passwordless login is not configured, the script can be run manually from the command prompt, and it will ask for the password before continuing. Since there are numerous resources describing how to set up passwordless access across servers, we won’t discuss that here.
Once you have such a script written, it’s another easy task to generate a logfile of the output on the database server. Simply create another script which calls this one, providing the desired parameters, and redirect the output to a local file, as follows:
/home/oracle/bin/cellsrvstat_smartio.sh 5 100 > /home/oracle/mydb/logs/cellsrvstat_smartio_`date '+%m%d%Y%H%M%S'`.log
The output will be directed to the specified logfile on the database server, so you can examine the output without having to visit the storage cells directly.
You can also perform a similar operation using the dcli utility from the database server. Using the –c option allows you to specify a comma-delimited list of storage cell names dcli is to connect to. The entire command you want executed, including any supplied parameters, must be enclosed in single quotes. An example of generating a similar report on storage cells 4 and 5 follows.
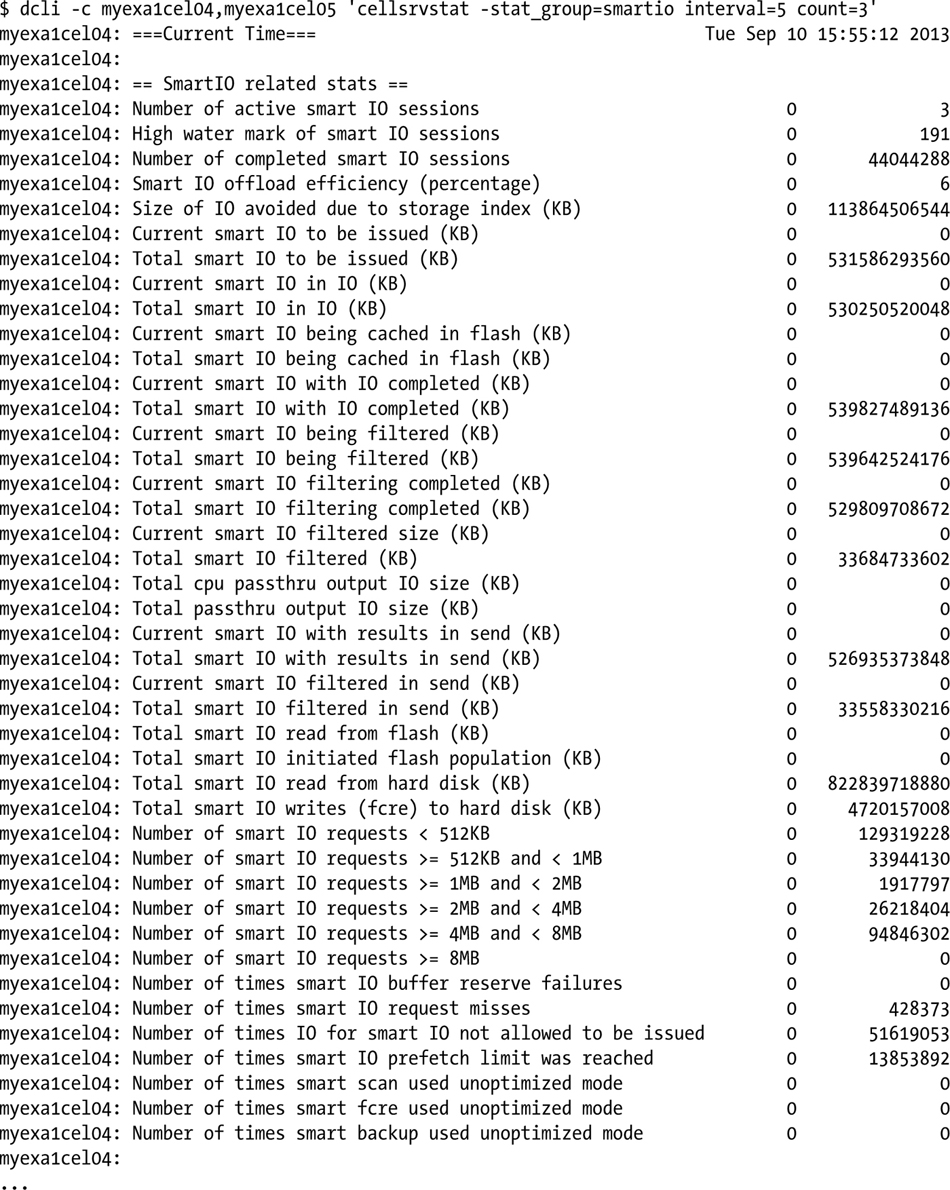
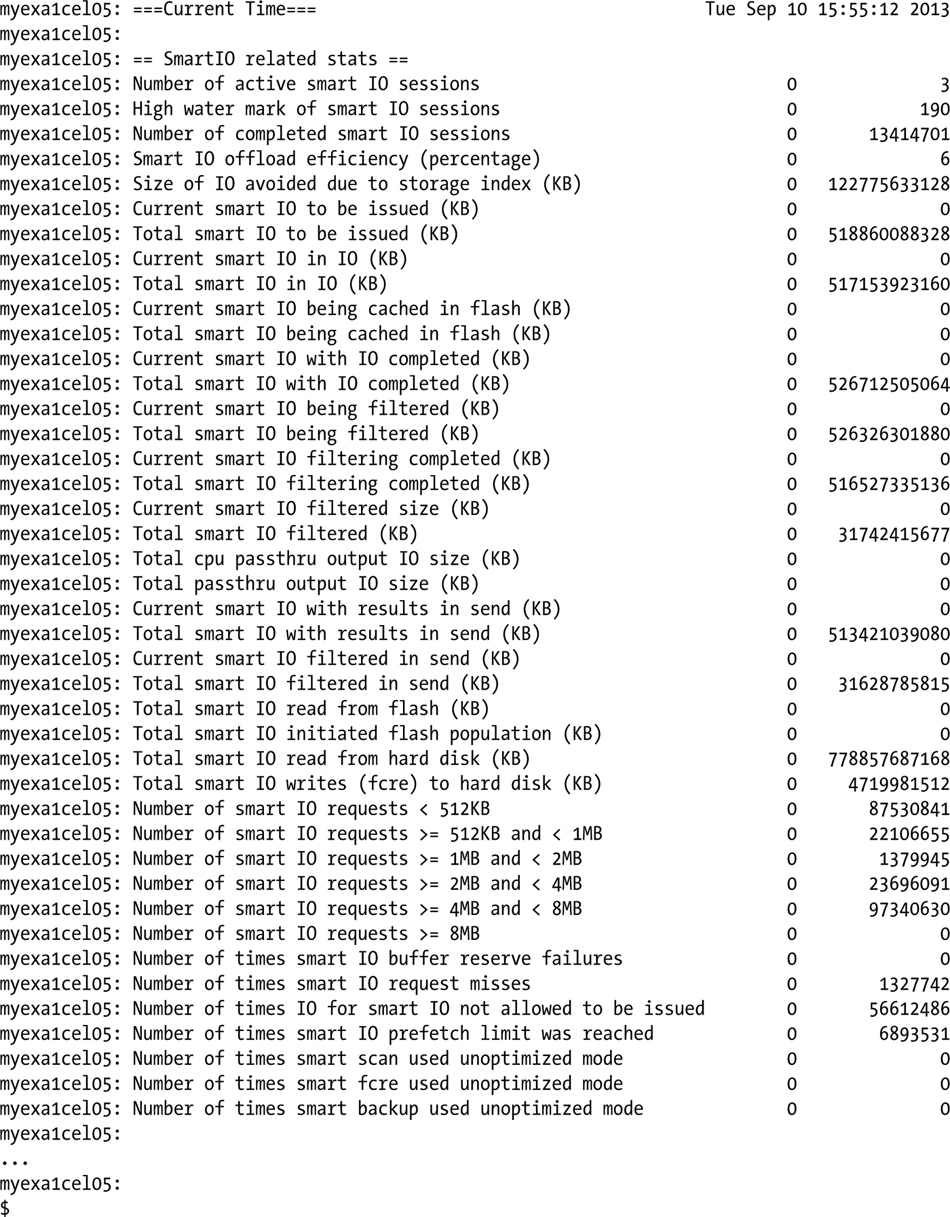
The storage cell name is displayed, as well as the cellsrvstat report data for each interval reported. This also relies on passwordless ssh access to the storage cells; if that isn’t established, it will be necessary to enter a password to connect to each cell in the list.
It is well worth the time and slight amount of effort to set up such monitoring of the storage cells using cron, as it will pay off in the long run. Troubleshooting Smart Scan and Smart Flash Cache issues can be made easier by having a baseline for current performance. Differences and deviations will be easier to spot and address, making troubleshooting time shorter and problem resolution faster.
Things to Know
There are two accounts you, as a DBA, should be aware of for the storage cells: cellmonitor and celladmin. The cellmonitor account is strictly a monitoring login and has restricted access to the storage cell directory structure.The celladmin account has far more access and privilege and is intended to be used for administrative duties.
The storage cells can be accessed by ssh; the addresses for the available storage cells are available in the /etc/hosts files on all available database servers in the Exadata system.
Two utilities exist for monitoring and managing the storage cells, cellcli and cellsrvstat. The cellcli utility is available to both cellmonitor and celladmin, with cellmonitor having a restricted set of available instructions. The cellmonitor account is intended for regular monitoring, using the LIST command set, which outputs statistics and metrics for various areas of the storage cell. The celladmin account is intended to allow the DBA to address issues reported by output generated by cellmonitor.
Both cellcli and cellsrvstat commands can be passed on the command line and cellsrvstat commands can be automated, in a way, by providing an interval, in seconds, and a count of executions to run of the given command. You can also restrict the output of cellsrvstat by using the -stat_group parameter to specify which group, or groups, you want to monitor. The available groups are smartio, io, mem, exec, and net.
Storage cell monitoring from the database server can be automated by using passwordless login to the storage cells and scripts, using ssh to connect to each storage cell and pass either cellcli or cellsrvstat commands to the cell you are connected to. The output can also be redirected to a logfile on the database server, by writing what is known as a “wrapper” script to redirect the output. This can establish a performance baseline for comparison, when the output indicates possible problem areas.