
Oracle does a pretty good job of gathering performance statistics and metrics, but sometimes, especially when you encounter a bug situation, Oracle can miss the mark. It also has issues collecting and reporting low-level I/O data, such as that provided at the O/S level. In these situations, we turn to iostat, an O/S level utility that reports both the wait time and service time for I/O requests, something that Oracle cannot do.
The iostat utility can produce two types of reports, one for CPU utilization and the other for device utilization. When iostat is called without parameters, these two types are combined into a single output block, and an example of that follows.
[celladmin@myexa1cel04 ∼]$ iostat
Linux 2.6.32-400.11.1.el5uek ( myexa1cel04.mydomain.com )     08/29/2013

avg-cpu:  %user   %nice %system %iowait  %steal   %idle
           1.69    0.00    1.00    0.76    0.00   96.55

Device:            tps   Blk_read/s   Blk_wrtn/s   Blk_read   Blk_wrtn
sda              43.34     17678.69      2536.11 76052113157 10910095951
sda1              0.00         0.40         0.00    1724104       3566
sda2              0.00         0.00         0.00       6682          0
sda3             37.19     17595.97      2398.88 75696251195 10319754897
sda4              0.00         0.00         0.00       5598          0
sda5              5.17         1.14       128.00    4898908  550629320
sda6              0.26        34.13         0.00  146813324       3688
sda7              0.32        10.30         8.97   44302234   38601648
sda8              0.08        10.24         0.00   44052706       3568
sda9              0.05         6.83         0.00   29372810       3504
sda10             0.02         2.33         0.00   10020082       3504
sda11             0.17        17.28         0.25   74333114    1092256
sdb              40.52     14599.59      2521.14 62806099223 10845728471
sdb1              0.00         0.40         0.00    1722690       3566
sdb2              0.00         0.00         0.00       6674          0
sdb3             34.50     14517.86      2383.92 62454489703 10255387417
sdb4              0.00         0.00         0.00       5598          0
sdb5              5.05         0.19       128.00     802666  550629320
sdb6              0.26        34.13         0.00  146811502       3688
sdb7              0.32        10.26         8.97   44156132   38601648
sdb8              0.08        10.24         0.00   44051066       3568
sdb9              0.05         6.83         0.00   29371066       3504
sdb10             0.02         2.33         0.00   10018098       3504
sdb11             0.17        17.28         0.25   74331628    1092256
sdc              35.50     15621.93      2358.42 67204113857 10145702504
sdd              43.31     18238.75      2411.67 78461434439 10374796825
sde              37.45     16292.94      2347.21 70090743919 10097464073
sdf              42.67     15401.76      2390.05 66256976848 10281761045
sdg              38.74     14337.09      2400.82 61676859523 10328104921
sdh              41.19     15494.96      2350.70 66657914894 10112485534
sdi              36.14     15339.71      2385.90 65990024896 10263942048
sdj              44.92     14766.18      2368.01 63522769026 10186958174
sdk              48.80     19425.04      2366.34 83564757833 10179786802
sdl              34.74     16006.00      2356.02 68856369043 10135375323
sdm               0.25        12.18         0.05   52388804     196296
sdm1              0.25        12.18         0.05   52385100     196296
md1               0.00         0.00         0.00      12560          0
md11              0.06         0.43         0.22    1854994     946160
md2               0.00         0.00         0.00      12848          0
md8               0.00         0.00         0.00      12616         48
md7               1.06         0.09         8.43     367218   36269392
md6               0.00         0.00         0.00      12774        120
md5              15.14         0.36       120.89    1551674  520072952
md4               0.00         0.01         0.00      57062         14
sdn              29.66       367.66       286.28 1581624255 1231530696
sdq              29.43       355.56       287.35 1529580431 1236147912
sdo              30.37       392.50       287.97 1688497023 1238832936
sdt              29.78       368.98       286.39 1587326255 1232021696
sdp              29.39       355.41       286.29 1528946047 1231606520
sdu              29.96       375.48       286.70 1615302159 1233365976
sds              29.72       368.07       286.62 1583404543 1233007976
sdr              33.92       493.72       286.80 2123954599 1233773728
sdy              29.20       352.04       291.22 1514424727 1252820440
sdx              29.23       359.17       286.09 1545115295 1230741224
sdw              30.19       373.09       291.31 1604988023 1253177480
sdv              29.80       368.34       288.12 1584564047 1239460224
sdac             29.00       347.57       287.43 1495213023 1236481216
sdab             28.98       349.61       288.36 1503994447 1240495096
sdz              34.75       540.44       286.27 2324924367 1231527200
sdaa             30.65       396.05       286.86 1703787199 1234049360

[celladmin@myexa1cel04 ∼]$
The reports can be isolated using the -c option (to produce a CPU-only report) or the -d option (to produce a device-only report). For the device report the -x option can also be specified to produce a report with extended statistics. Looking at both forms of the iostat device report, you can see what additional statistics are reported. First up is the “regular” iostat device report.
[celladmin@myexa1cel04 ∼]$ iostat -d
Linux 2.6.32-400.11.1.el5uek ( myexa1cel04.mydomain.com )     08/29/2013

Device:            tps   Blk_read/s   Blk_wrtn/s   Blk_read   Blk_wrtn
sda              43.34     17677.25      2539.27 76057415661 10925374425
sda1              0.00         0.40         0.00    1724104       3566
sda2              0.00         0.00         0.00       6682          0
sda3             37.19     17594.54      2402.04 75701552203 10334934195
sda4              0.00         0.00         0.00       5598          0
sda5              5.17         1.14       128.00    4899732  550719152
sda6              0.26        34.12         0.00  146813324       3688
sda7              0.32        10.30         8.97   44302242   38610304
sda8              0.08        10.24         0.00   44052706       3568
sda9              0.05         6.83         0.00   29372810       3504
sda10             0.02         2.33         0.00   10020082       3504
sda11             0.17        17.28         0.25   74333778    1092944
sdb              40.52     14602.81      2524.33 62829441959 10861093803
sdb1              0.00         0.40         0.00    1722690       3566
sdb2              0.00         0.00         0.00       6674          0
sdb3             34.50     14521.09      2387.10 62477831559 10270653573
sdb4              0.00         0.00         0.00       5598          0
sdb5              5.05         0.19       128.00     802690  550719152
sdb6              0.26        34.12         0.00  146811502       3688
sdb7              0.32        10.26         8.97   44156132   38610304
sdb8              0.08        10.24         0.00   44051066       3568
sdb9              0.05         6.83         0.00   29371066       3504
sdb10             0.02         2.33         0.00   10018098       3504
sdb11             0.17        17.28         0.25   74332484    1092944
sdc              35.50     15623.32      2361.59 67220250345 10160892333
sdd              43.31     18239.34      2414.85 78475828335 10390026084
sde              37.46     16293.08      2350.37 70101955031 10112591593
sdf              42.68     15402.36      2393.21 66269586024 10296925275
sdg              38.74     14336.90      2403.96 61685381083 10343176536
sdh              41.20     15502.49      2353.87 66700399494 10127677980
sdi              36.14     15339.68      2389.08 65999899736 10279157674
sdj              44.92     14769.30      2371.17 63545804314 10202104613
sdk              48.81     19432.90      2369.51 83611198593 10194961456
sdl              34.75     16010.29      2359.19 68885217579 10150542364
sdm               0.25        12.18         0.05   52399172     196296
sdm1              0.25        12.18         0.05   52395468     196296
md1               0.00         0.00         0.00      12560          0
md11              0.06         0.43         0.22    1856514     946768
md2               0.00         0.00         0.00      12848          0
md8               0.00         0.00         0.00      12616         48
md7               1.06         0.09         8.43     367226   36277680
md6               0.00         0.00         0.00      12774        120
md5              15.14         0.36       120.89    1551714  520157664
md4               0.00         0.01         0.00      57062         14
sdn              29.66       367.70       286.26 1582041391 1231643376
sdq              29.44       355.59       287.33 1529927871 1236264000
sdo              30.38       392.53       287.96 1688884367 1238948184
sdt              29.78       369.01       286.37 1587689215 1232138712
sdp              29.39       355.44       286.28 1529296303 1231728176
sdu              29.97       375.53       286.68 1615731519 1233479056
sds              29.73       368.09       286.60 1583739183 1233122872
sdr              33.92       493.76       286.78 2124413863 1233898648
sdy              29.20       352.06       291.21 1514777647 1252946168
sdx              29.24       359.20       286.08 1545466895 1230858064
sdw              30.19       373.12       291.29 1605375927 1253298360
sdv              29.80       368.37       288.10 1584924095 1239580568
sdac             29.00       347.59       287.41 1495543487 1236597160
sdab             28.98       349.64       288.34 1504346895 1240616544
sdz              34.75       540.47       286.26 2325399199 1231644472
sdaa             30.65       396.09       286.84 1704198463 1234166016

[celladmin@myexa1cel04 ∼]$
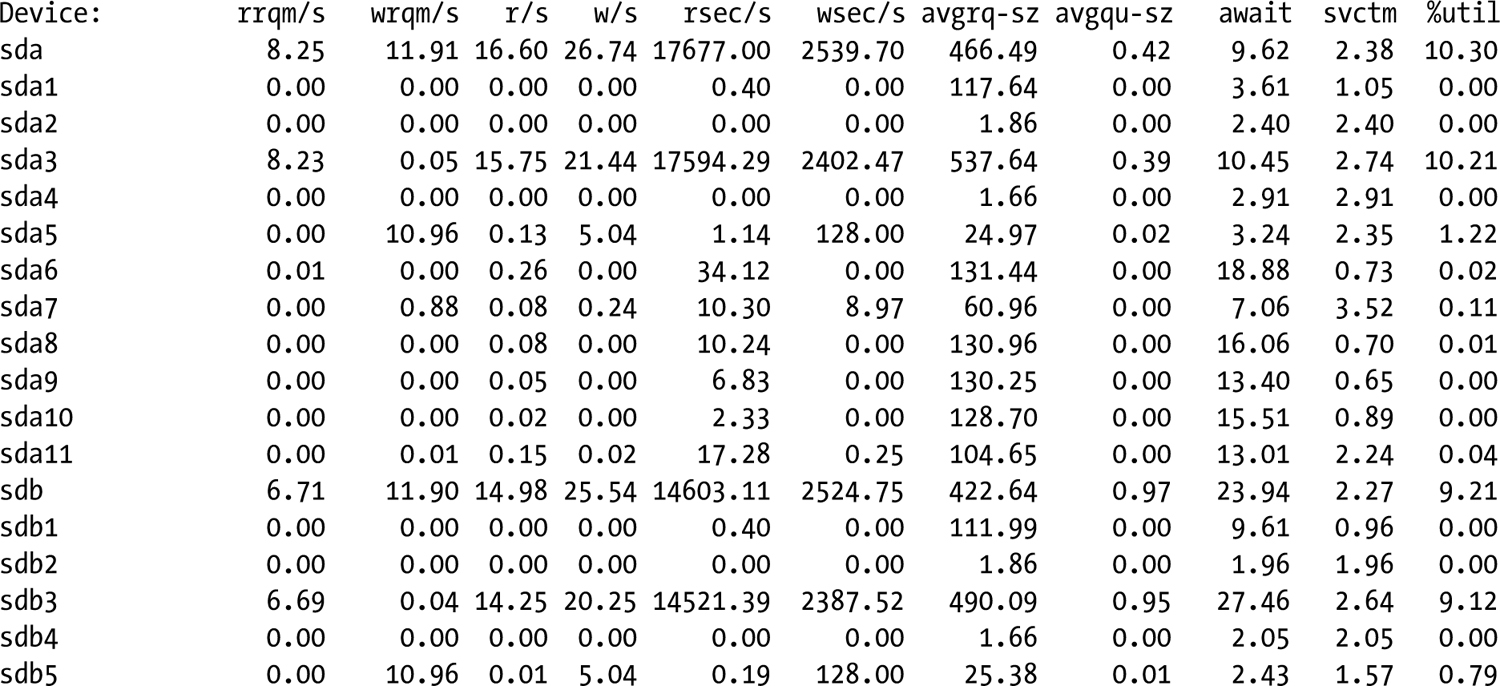
Both reports are beneficial, as they report different sets of monitoring data that can be very useful when digging into some performance issues or bugs.
The CPU report format, showing the columns and their meanings, is found in Table 10-1.
Table 10-1. Iostat Values Reported in CPU Format
| %user | Shows the percentage of CPU utilization that occurred while executing at the user level (application). |
| %nice | Shows the percentage of CPU utilization that occurred while executing at the user level with nice priority. |
| %system | Shows the percentage of CPU utilization that occurred while executing at the system level (kernel). |
| %iowait | Shows the percentage of time that the CPU or CPUs were idle during which the system had an outstanding disk I/O request. |
| %steal | Shows the percentage of time spent in involuntary wait by the virtual CPU or CPUs while the hypervisor was servicing another virtual processor. |
| %idle | Shows the percentage of time that the CPU or CPUs were idle and the system did not have an outstanding disk I/O request. |
The device report format is shown in Table 10-2.
Table 10-2. Iostat Values Reported by Device Format
| Device: | This column gives the device (or partition) name, which is displayed as hdiskn, with 2.2 kernels, for the nth device. It is displayed as devm-n, with 2.4 kernels, where m is the major number of the device and n a distinctive number. With newer kernels, the device name as listed in the /dev directory is displayed. |
| tps | Indicates the number of transfers per second that were issued to the device. A transfer is an I/O request to the device. Multiple logical requests can be combined into a single I/O request to the device. A transfer is of indeterminate size. |
| Blk_read/s | Indicates the amount of data read from the device expressed in a number of blocks per second. Blocks are equivalent to sectors with 2.4 kernels and newer and, therefore, have a size of 512 bytes. With older kernels, a block is of indeterminate size. |
| Blk_wrtn/s | Indicates the amount of data written to the device, expressed in a number of blocks per second. |
| Blk_read | The total number of blocks read. |
| Blk_wrtn | The total number of blocks written. |
| kB_read/s | Indicates the amount of data read from the device, expressed in kilobytes per second. |
| kB_wrtn/s | Indicates the amount of data written to the device, expressed in kilobytes per second. |
| kB_read | The total number of kilobytes read. |
| kB_wrtn | The total number of kilobytes written. |
| MB_read/s | Indicates the amount of data read from the device, expressed in megabytes per second. |
| MB_wrtn/s | Indicate the amount of data written to the device expressed in megabytes per second. |
| MB_read | The total number of megabytes read. |
| MB_wrtn | The total number of megabytes written. |
| rrqm/s | The number of read requests merged per second that were queued to the device. |
| wrqm/s | The number of write requests merged per second that were queued to the device. |
| r/s | The number of read requests that were issued to the device per second. |
| w/s | The number of write requests that were issued to the device per second. |
| rsec/s | The number of sectors read from the device per second. |
| wsec/s | The number of sectors written to the device per second. |
| rkB/s | The number of kilobytes read from the device per second. |
| wkB/s | The number of kilobytes written to the device per second. |
| rMB/s | The number of megabytes read from the device per second. |
| wMB/s | The number of megabytes written to the device per second. |
| avgrq-sz | The average size (in sectors) of the requests that were issued to the device. |
| avgqu-sz | The average queue length of the requests that were issued to the device. |
| await | The average time (in milliseconds) for I/O requests issued to the device to be served. This includes the time spent by the requests in queue and the time spent servicing them. |
| svctm | The average service time (in milliseconds) for I/O requests that were issued to the device. |
| %util | Percentage of CPU time during which I/O requests were issued to the device (bandwidth utilization for the device). Device saturation occurs when this value is close to 100 percent. |
| ops/s | Indicates the number of operations that were issued to the mount point per second. |
| rops/s | Indicates the number of read operations that were issued to the mount point per second. |
| wops/s | Indicates the number of write operations that were issued to the mount point per second. |
The basic device report provides the tps, Blk_read/s, Blk_wrtn/s, Blk_read, and the Blk_wrt values. The remainder of the list in Table 10-2 is displayed in the extended device report. You should not be seeing large await times with a properly functioning Exadata system. On systems we manage, the largest await times we see are about 20 to 25 milliseconds for the physical disks and less than 1 millisecond for the flash disks. If you’re seeing await times in the hundreds of milliseconds or longer on a regular basis for a given disk, further investigation is warranted, as the unit might be suffering from a firmware mismatch or impending device failure.
Because the database servers don’t directly access the storage media, running an iostat device report to diagnose disk read/write issues won’t provide any useful information regarding the ASM storage. However, don’t forget that the database servers utilize CPU for all transactions, so an iostat CPU report should be generated when you generate a CPU report for the storage cells. By doing so, you minimize the chances of missing CPU-related issues that may occur only on the database server.
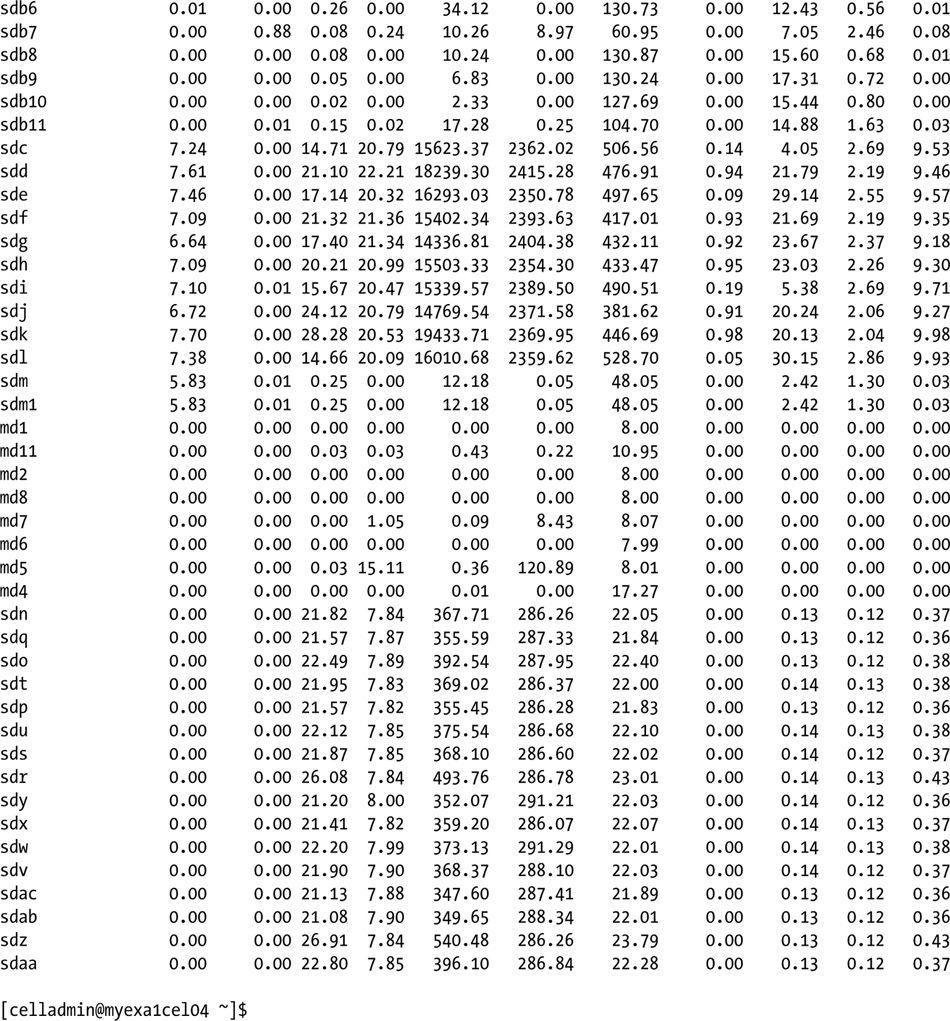
The device names reported by iostat are those found in the /dev hierarchy of directories on the server being monitored. Which cell disk is mapped to which device is reported by the CellCLI command list cell disk, specifying the name and deviceName attributes, as follows:
CellCLI> list celldisk attributes name, deviceName
         CD_00_myexa1cel04       /dev/sda
         CD_01_myexa1cel04       /dev/sdb
         CD_02_myexa1cel04       /dev/sdc
         CD_03_myexa1cel04       /dev/sdd
         CD_04_myexa1cel04       /dev/sde
         CD_05_myexa1cel04       /dev/sdf
         CD_06_myexa1cel04       /dev/sdg
         CD_07_myexa1cel04       /dev/sdh
         CD_08_myexa1cel04       /dev/sdi
         CD_09_myexa1cel04       /dev/sdj
         CD_10_myexa1cel04       /dev/sdk
         CD_11_myexa1cel04       /dev/sdl
         FD_00_myexa1cel04       /dev/sdv
         FD_01_myexa1cel04       /dev/sdw
         FD_02_myexa1cel04       /dev/sdx
         FD_03_myexa1cel04       /dev/sdy
         FD_04_myexa1cel04       /dev/sdz
         FD_05_myexa1cel04       /dev/sdaa
         FD_06_myexa1cel04       /dev/sdab
         FD_07_myexa1cel04       /dev/sdac
         FD_08_myexa1cel04       /dev/sdr
         FD_09_myexa1cel04       /dev/sds
         FD_10_myexa1cel04       /dev/sdt
         FD_11_myexa1cel04       /dev/sdu
         FD_12_myexa1cel04       /dev/sdn
         FD_13_myexa1cel04       /dev/sdo
         FD_14_myexa1cel04       /dev/sdp
         FD_15_myexa1cel04       /dev/sdq

CellCLI>
The report shown should only have to be run once per storage cell on your Exadata system, provided you don’t upgrade it to the next available configuration or if your Exadata system is a Full Rack. System upgrades, from Quarter Rack to Half Rack or Half Rack to Full Rack, will require you to run the report again, so that the new device mappings can be seen.
Knowing this information makes it easier to associate the device statistics reported by iostat -d to ASM disks and flash disks. Low-level I/O problems you might encounter can now be tracked and diagnosed by combining the output from the two utilities.
Things to Know
Exadata is well-instrumented across both the database and storage tiers, offering a large number of available metrics reporting on many aspects of the system. Choosing which metrics to report is an important task to prevent you from getting lost in an avalanche of data.
For monitoring to be effective, a baseline must be established, so that you have a known reference point to compare subsequent monitoring runs to. Comparing to a baseline provides a solid starting point from which to measure performance improvements and problems. Without such a baseline, every analysis is against a moving target, making the task much harder than it needs to be.
Oracle Enterprise Manager can be used to generate reports and graphs that represent performance metrics as they change over time. You still need a baseline to start from, and that baseline does not have to be for perfect performance. Remember: You’re measuring performance changes relative to this baseline. You may find that when performance improves, you use that point of improvement as your new baseline.
OEM can also monitor the storage cells, if the System Monitoring plug-in for Exadata Storage Server is installed. This plug-in may not provide all of the metrics available from the command-line tools, but it can provide a view of how the storage statistics and metrics change over time.
Monitoring can also be performed outside of the Oracle Enterprise Manager by using scripts and command-line utilities to return the requested data. The storage cells offer both the cellcli and cellsrvadmin utilities, which report on various areas of the storage cells.
Oracle, no matter how well instrumented, doesn’t report low-level I/O statistics, so it is necessary to go to the O/S for those. The iostat utility can provide a window into this low-level CPU and device activity. Two separate reports can be generated, one for CPU and one for devices, or both reports can be combined, by calling iostat without any command-line parameters.
The cellcli utility can report which cell disk is mapped to which hardware device, with the list celldisk command. The attributes of interest are name and deviceName. Knowing this mapping allows you to “translate” the output from the iostat device report, so you can monitor the ASM disks and see which, if any, may be experiencing problems.