Winnowing Down: The Challenge of Opportunity Recognition
In the previous chapter, I presented a process model that searched multiple sources of ideas and then distilled them into possible opportunities that are aligned to the overall vision of the environment they were meant to serve. That process can be envisioned as a “funnel” in which ideas are constantly being drawn down to possible candidates.
The frequency and magnitude of the flow of ideas are determined by the capacity of the organization to absorb them. The importance of a “flow” is that not all projects will equally succeed. So the rate (that is, the number and breadth) of idea flow must be considered in a way that a) allows for failure of some projects and b) is robust enough to satisfy the company’s (or project’s) appetite for new commercial ideas. It is a probabilistic model that relies on a number of ideas being processed at any time. It is not an absolute number. The time to restart the flow of ideas from the beginning is too long to recover in time for the newer projects to be useful. The model is a continuum of ideas to projects to be processed in parallel, not a serial path of evaluating one opportunity after another.
A further importance of the funnel model is that each organization and field of practice has its own dynamics. In biotech, for example, the time to commercialization of project flow is regulated by outside agencies and consumer acceptance. It embraces years of approval processes and trials. Apps and social media projects, on the other hand, have almost instant access to markets. Most funnel models require the dynamic mix of different projects to help smooth out possible disruptions of different time schedules.
As a project’s “journey” from sources of ideas to commercial reality moves along, it does so through a series of decision “gates.” The gates metaphor is used because it suggests that a conscious decision to move forward is accomplished at multiple stages (or gates). Any gate also allows for a consistent and rational basis to reject a project. A negative decision is as useful as a positive decision to go forward. It can close out inappropriate projects and preserve access to precious resources.
Before we examine the gate concept further, let’s take a step back. Before opportunity projects are even considered, examining the broad world of ideas becomes useful as it allows the user to calibrate the landscape of all opportunities available. An “idea” is just that. It is a concept based on intuition, experience, and perceived need—or just a whim. It could be the output of a creative process of searching or even an opportunistic look at markets and available products. Sometimes it needs a curiosity driven “Edisonian” mindset coupled with a need to create, a sensitivity to a customer need, or a confluence of existing ideas.
The use of Global Positioning Systems (GPS) for automotive navigation might be an example of this. Fixed-base and handheld GPS existed for a long time in military and industrial uses before someone decided to apply it to automotive dashboard applications. In most cases, the transition to consumer use contains an element of creative energy and/or entrepreneurial innovation that allows the inventor to see the idea application even before it’s real.
How the transference of an idea to opportunity lies in the mindset of a project or a company is a defining aspect of “Opportunity Recognition.” Professor Ulrich Kaiser of the Institute of Strategy and Economic University (ISU) of Universtat Zurich in Switzerland offers a course entitled “A Primer in Entrepreneurship,” in which he defines an idea as a thought, impression, or notion that might not meet the criteria of an opportunity. He further goes on to say that the transition to an opportunity is driven by business, social, technological, and political forces that help define the product or service opportunity’s boundaries. Usually there is an entrepreneur or entrepreneurial environment that fosters the change.
The actual decision to move an idea to a project level need not be an agonizing one. Many elements of the thought process can be isolated and captured in defining documents like the corporate (or project) vision statement. Those elements can then be utilized as simple and measurable metrics such a return on investment (ROI). Not only do the metrics help with the decision to go ahead, but they also can help with the allocation of resource decisions between multiple projects. The criteria can be both absolute and a relative measure of viability.
Opportunity Recognition, the First Gate
Since the overall goal of this text is to provide a framework (or model) of commercialization, I suggest that you consider a series of steps (or “gates”). The model dictates that each gate must be passed in order to move on to the next one.
The first gate is designed to ensure that the proper number of appropriate projects is distilled into “next steps.” This requires two elements to be in place. The first is that the overall objectives or vision of the decision environment be articulated and understood. Without a cohesive vision or goal, the ability to make decisions consistent with that vision falls off quickly. Operationally, it is challenging to keep the clarity of the vision statement in front of the team that executes the projects.
The second is that a process is in place to allow an orderly yield of acceptable ideas to be sorted out. It is a bit tricky. An organization exists in a space defined by its vision, its people, technological competence, the resources available to it, and the markets in which it participates in commercial activity. Many times, these variables are used to define the need for new opportunities in terms of revenue, profits, or market share. This process must be timely enough to assimilate these attributes into the organization’s capacity to absorb them.
One example is the pharmaceutical industry. Characterized by long development cycles and expensive research, it has become prone to utilizing in-licensed technology almost to a fault. Alternative strategies such as invention, joint ventures, and collaborations become secondary. A more balanced perspective might serve them well.
Distillation
Physical chemists have a tool that allows them to separate chemical mixtures by applying energy to different components that have relative volatility. It is called “distillation.” The chemical process model serves as an analogy to understand how multiple ideas can be drawn down to usable projects.
There are many models for how this process of narrowing down the world of all ideas into usable projects might work. Those that allow quantification and offer clear resolution between alternatives are more effective than those that don’t.
The model utilized in this text is based on a project I co-advised with Mac Banks at WPI and was led by one of my students, TJ Lynch. It was entitled “The Development and Application of Multiple Opportunity Analysis Tool for Entrepreneurs.” (WPI- MQP, April, 2009).1
Lynch’s motivation was a bit off the mark for what we are doing in that his original goal to develop the model was based on choosing the best of multiple, but disparate career opportunities facing him as a senior. He struggled to develop a method for sorting out which would be the best alternative for him to pursue. He quickly found that it was a complex task that consisted of multiple components and that the literature revealed very few tools with enough resolution to be useful.
His work utilized a weighted average methodology that is explained next, but is also visually shown in Figure 4-1.
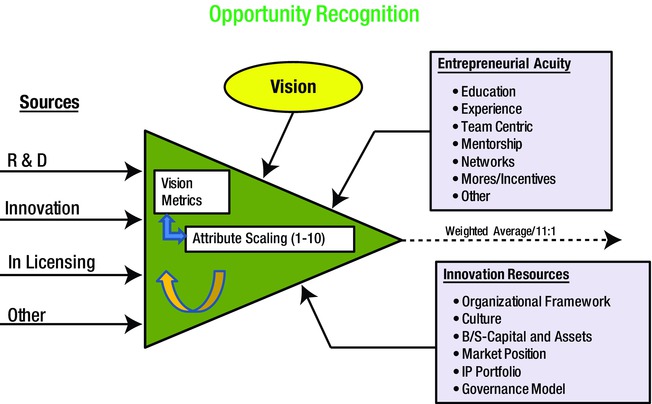
Figure 4-1. An opportunity recognition model
The model starts with numerical quantification of the vision or goals of the project shown in the center of Figure 4-1. It then attempts to “weight” the elements of the vision statement based on those goals. If, for example, the vision of the organization is to become the technological, low-cost market leader, higher attribution scores are allocated to those parameters. The dialogue between individuals or multiple groups party to the decisions that are used to assess the process of quantification can be rich and informative. This is especially true when alignment or agreement surfaces early. Opposing views take time and energy to resolve. A simple printed document standing alone rarely conveys its meaning. The dialogue is the meaningful part. In the context of the model, the attribution scores can be adjusted during the project to reflect changing conditions (such as the market) or changes in corporate strategy.
Once the project vision parameters are established, they are subjected to a matrix of functional measures such as technology, finance, operations, risk, and markets. This is labeled in Figure 4-1 as the Vision Metrics. These metrics become multipliers in the weighting calculation. The Lynch model utilizes 10 functional areas for analysis. Each subject or area becomes a basis for to a 10-question inquiry of strength and weakness within those areas. In technology, for example, they might query the number of patent disclosures per R&D employee. Measures like this become particularly relevant when the core business is technology dependent. Biotech or pharmaceuticals are good examples of this dependence. In retail-oriented projects, dollars spent to achieve market share through advertising or market incentives (discounts) might prevail.
The weighted average part of the model refers to the next process step. It is where the vision attributes are multiplied by the scores of the functional areas. The ensuing numerical score is then rank-ordered and weighted to reveal which projects should go forward.
Figure 4-2 shows the elements of the Lynch model. They include:
- A functional element. In this case it is Technology. It might be the functional areas of Markets, Competition, Finance, and so on.
- A multiplier, which is derived from the vision or goals statement for the project. In a technology-based effort, this number may be as high as 7 to 10.
- The project rating score (usually expressed in a series of relevant questions as a 1 through 10 rating). In this model, we try to discriminate one of three possibilities.
- The overall rating, which is a number that results from a multiplied effect of the multiplier times the score.
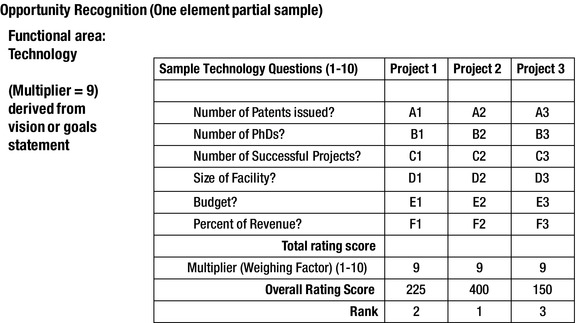
Figure 4-2. Sample opportunity recognition model
When this process is applied throughout the functional areas and multiplied out, the importance that each area has to the overall project is identified and a weighted average figure of merit emerges. The various projects are then rank-ordered to clarify which projects are most aligned to the overall vision or goals.
Reading the literature about opportunity recognition, models that can discriminate one out of five candidate projects are considered good. The Lynch model demonstrates a resolution potential of one out of eleven, which is relatively amazing performance. The detailed workings of the model can be seen in the WPI MQP document.
As exciting as it may be to realize that a model can discriminate possible choices, the process is not without its limits. It relies on a quantification of goals or an articulation of the vision that can be numerically described. Does the use of multipliers have limits? Of course. One big drawback is this—with strict adherence to a set of multiplier rules dictated by the vision, you may miss unique “out of the box” disruptive or opportunistic leaps that intuition provides. It is a bit of a tight rope of decision making as to how much to rely on an analytical model and on intuition. At this point it seems that increased reliance on more disciplined and methodical approaches would yield better results.
Lego, the children’s toy company, almost missed the market for robotics products because of internal uncertainty about their new innovation platform.2 Workarounds like a statistical or “dashboard” approaches where a finite percentage of screened, intuitive opportunities are allowed in the mix by judgment or intuition alone might mitigate the risk of too rigid an approach. The point is that a “hunch” or “gut feel” can add significant value to the development of new ideas. Finding a mix of those decisions to the more orderly flow of ideas in a working model is the creative challenge. Without them, new and dynamic opportunities may be lost. Just look at the examples in the automotive industry. For years somewhat frivolous annual changes like tailfin additions and simple sheet metal shape changes superseded solid technological advances. No wonder the Prius came from outside of the Detroit industry mindset.
Multiple Funnels
Chapter 2 presented the argument for openness with regard to many sources of ideas. Then, models like the Lynch effort were presented as a tool to focus on distilling them into usable opportunities. Indeed, it is a disciplined winnowing down (or funnel) that is accomplished by applying that orderly approach. But, are the number of projects produced by these methods adequate? Is the capacity of the organization such that singular models are enough to produce sufficient opportunities? A unified model may not be sufficient. If it is, can it do so at an adequate rate? All this invites a series of interesting questions:
- Is the organization’s track record of successful offerings of new products or services adequate? In simpler terms, what is the expected “hit rate”?
- Is the marketplace in which the organization operates dynamic enough to absorb new ideas? Is market share the predominate marker of success? Where are the competitive forces? What is their magnitude?
- Are external forces demanding change (that is, regulatory, environmental, corporate, and technological)?
- Is the organization and its resources properly positioned to achieve multiple entries in terms of people, capital, or technology?
Expectations
Beyond these questions, the risks of over- or under-estimating the number of “funnel” opportunities required for successful long-term value enhancements are significant. The numbers certainly help regulate the size and quantity of offerings required by the model. It may even open up a discussion that multiple models might be required to satisfy the operating needs of the parent organization.
Underestimating the requirements for new and innovative market offerings often means struggling against time. Expensive increases in overtime, FedEx overnight deliveries of parts and other operational costs—including people burnout to catch up—become part of the landscape. There is really no reason why a more orderly process cannot be employed. Certainly, it allows for loss of productivity and innovations. If acquisitions are utilized to achieve the goals, the time required for proper merging of the organizations becomes compromised.
If they are overestimated, issues such as introducing products or services before the financial lifecycle benefits of existing offerings are realized means that the full economic investment recoveries of the cycle are not realized. Cannibalizing existing products by accelerated obsolescence is sometimes considered dramatic and even effective in the marketplace, but the long-term value of such practices is questionable. An easy example of this is the constant release of new Microsoft operating systems. Although this strategy contributed to rapid rise of revenues (and profits) for the company, it also encouraged the development of “open” systems such as Linux as users became frustrated with the many changes offered by Microsoft.
With the sins of overestimating and understating the rate of new innovation developments in front of us, we have to wonder whether there is a “sweet spot” of resource allocation and commercialization rate that yields long- term value and results. Of course there is!
What are their markers? Companies that provide clues include 3M, with a culture that encourages internal innovation in its organization over a period of 100 years, and Emerson Electric, with its strict quarterly discipline and a long-term growth of 15% over 25 years. It is the focus of their new product and service offerings that are used in the creation and sustaining of long-term value propositions that produce the required results. Clearly, long- term proposition articulations and careful allocation of resources that are tuned to the longer-term visions become clear incentives for investment and market strength.
In the text entitled “Michael Porter: The Essential Guide to Competition and Strategy” (Harvard Business School Publishing, 2012), the author Joan Margetta contributes a Chapter 7 to “Continuity as the Enabler.” She acknowledges Porter’s five-step test of good strategy and process, but focuses on continuity as a test of strategy effectiveness. She likens it to a cooking metaphor that differentiates good strategy and process as a stew, not a stir fry. In the stew, there is time for the ingredients’ flavors and essences to become integrated into the formulation. Analogies aside, the author then develops the rationale for long-term strategy and process. They include:
- Continuity reinforces a company’s identity and allows it to build brands, reputation, and customer relationships.
- Continuity helps develop strong supply chains where suppliers and outside parties have time to develop optimum channels.
- Continuity increases the odds that employees throughout the organization will understand and contribute to the overall strategy.
Certainly, continuity and long-term value enhancement does not mean that an organization and its processes must stand still. Nimble and adaptive innovation must prevail to allow innovative competition. It does allow for stability of core values to be established and then that they be a platform for innovation to flourish. It also does not necessarily contribute to predicting future trends, but can allow inherent structural capacity to deal with changes in markets, technology, and customer preferences.
Chapters 1 and 2 focused on opening discovery processes so that there would be a robust and nimble sweep of possible ideas. It preached the sin of myopia toward any one source of innovative and new ideas. This chapter looked at the process of winnowing down those ideas to a useful flow of sources that satisfies the organization’s capacity and need for them. In the Lynch model, this distillation process was shown to be able to discriminate ideas to an orderly process anchored to the core vision or ideas of the project and the organizational context in which they occur. Managing the flow of multiple funnels of opportunity to the dynamics of the organizational model’s resource capacity becomes the new challenge.
Finally, we stepped back and looked at the overall metrics that control the process. Long-term value propositions and the continuity of strategies presented by Porter become the controlling elements of rate.
So, now you have a properly aligned set of ideas and are ready to move forward to another critical aspect of testing whether the ideas or projects have the probability to succeed. This next step is called “feasibility analysis” and might be considered the second gate.
_______________________
1https://www.wpi.edu/Pubs/E-project/Available/E-project-050509-091115/unrestricted/tjl-MQP-MOpA-Tool-D09.pdf
2Innovation at the Lego Group, IMD case study #382, Part B, 2008, Institute for Management Development, Lusanne, Switzerland.