
Chapter 8
Role of Architecture in Managing Structural Complexity
8.1 Introduction
In the previous chapters, we learned how to drive the development of an architecture of a system. Embracing architecture-centric practices results in a system that not only meets its quality expectations but also can lead to a significant reduction in excessive complexity, suggesting that excessive complexity may be an incidental by-product of development methodologies that lack focus on the systemic properties of a system that have a strong influence on its architecture. Complexity in a system is related to the degrees of cohesion and coupling within and between a system’s modules (a system’s cohesive units of implementation). Systems designed with high cohesion achieve better separation of concerns with each module within the system addressing one and only one concern. High cohesion also leads to low coupling, by which interdependencies among the modules are significantly reduced.
8.2 Analyzing System Complexity
Complexity is perceived as the number of interacting elements within a system, the internal structure of these elements, and the number and nature of interdependencies among them (Taylor et al., 2009). At the design level, complexity is related to the degrees of cohesion and coupling within and between a system’s elements (Stevens et al., 1974). Design-level cohesion and coupling in a system can be analyzed using a design structure matrix or DSM (Eppinger, 1991; Steward, 1981). A DSM is also known as a dependency structure matrix, dependency source matrix, and a dependency structure method.
DSM is a square matrix (it has an equal number of rows and columns) that maps dependencies or relationships among elements of a system. All elements appear in both the rows and the columns, and dependencies are signaled at the intersection points of the items in the matrix. For example, Figure 8.1 shows a DSM for a software system that has been decomposed into four modules: A, B, C, and D. The rows and columns of the matrix represent the same modules. The dependencies of a module are read down a column. For instance, reading down the first column, we can see that module A depends on module C. We also see that module A does not depend on modules B or D as those cells are empty. These dependencies are marked in Figure 8.1 and are known as uses dependencies (as in module A uses module C). Reading across a row gives us dependencies on a module. For instance, reading across the first row, we can see that modules C and D depend on module A. These dependencies are marked in Figure 8.1 and are known as used by dependencies (as in module A is used by modules C and D). The identity diagonal represents a dependency of a module on itself.
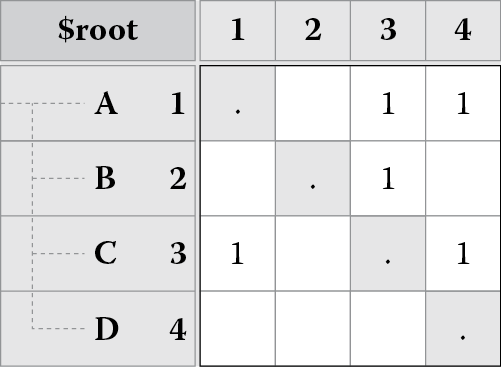
(a)
(b)
(c)
A DSM showing (a) dependencies among software modules, (b) the uses dependencies, and (c) the used by dependencies.
A DSM provides a simple, compact, and visual representation of a system. DSMs to date have been used not only in component-based and architecture decomposition and integration analysis but also in organization, project, product planning, and management contexts (Lindemann, 2009). The use of DSMs in software engineering has mostly focused on understanding design rules (Sullivan et al., 2001) and has been increasingly incorporated into reverse engineering tools and tools to develop architectures such as Lattix (2011) and Structure 101 (2011).
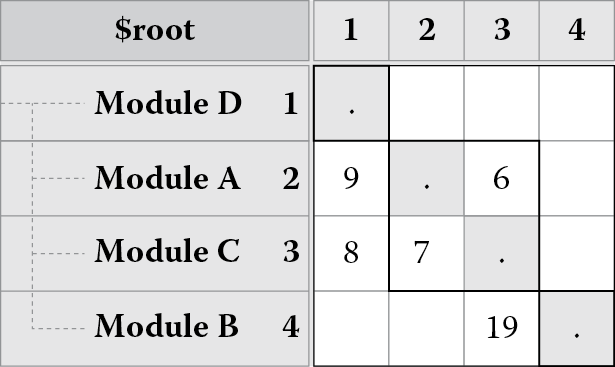
The DSM in Figure 8.1 is a binary matrix; its cells are populated with zeros and ones. Binary matrices are useful because they show presence or absence of a relationship between pairs of elements of a system. As shown in Figure 8.2, a matrix can also show weighted dependencies. For instance, reading down column 1, we can see that module A depends on module C with a dependency strength of 8.
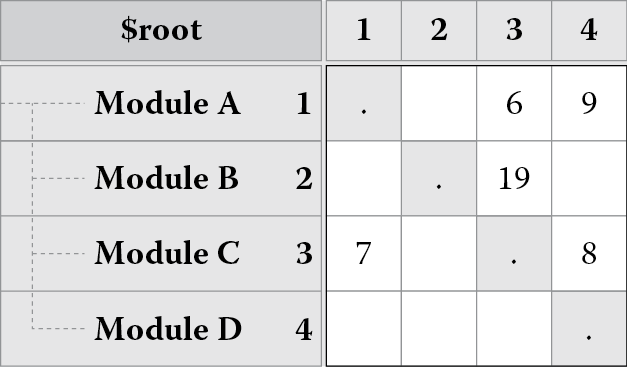
The presence of a large number of dependencies within a cell may be indicative of poor cohesion. For instance, reading down column 3 and across row 2, we find module C has 19 dependencies on module B. Although 19 is not a large number, imagine if it were in the hundreds or more. The presence of such a large number would suggest that B was performing many (perhaps diverse and unrelated) tasks for which C must rely on it.
8.2.1 Partitioning a DSM
We can reorder the subsystems in the DSM through a process called partitioning. The objective of partitioning is to sequence the DSM rows and columns such that the new DSM arrangement does not contain any feedback loops or cycles, thus transforming the DSM into a lower triangular form. A feedback loop or cycle exists when there are circular dependencies (for instance, an element X depends on an element Y and element Y in turn depends on element X). For complex systems, it is highly unlikely that simple row and column manipulation will result in a lower triangular form. Therefore, the objective changes from eliminating the feedback loops to moving them as close as possible to the diagonal (this form of the matrix is known as block triangular).
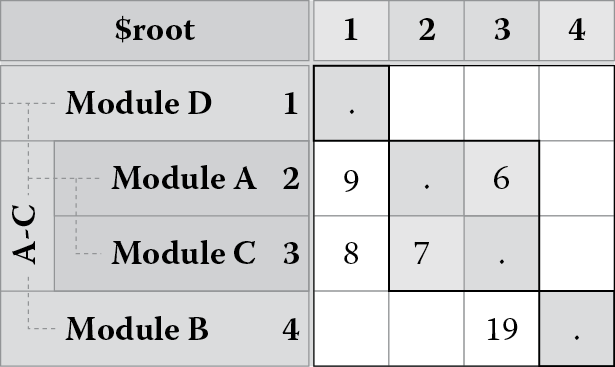
Figure 8.3 shows this reordering for the DSM in Figure 8.2. The reordering yields a block triangular matrix consisting of three groups or blocks, the first consisting of module D, the second consisting of modules A and C (because they are coupled together due to circular dependency), and the third consisting of module B. Note that there are no dependencies (and hence no cycles) in the area of the matrix above the marked blocks.
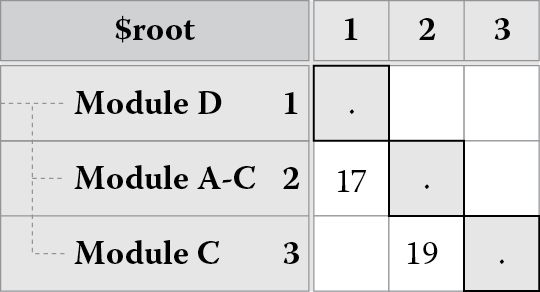
It is equally possible to learn about which elements of the system might possibly have to be reworked (e.g., split into two elements or perhaps merged) to achieve better architecture. For example, Figure 8.4 shows combining of modules A and C into a compound module A-C (note that a module is simply an abstraction, a highly cohesive unit of implementation; in a software system, this can be as small as a single class or as large as an entire subsystem containing thousands of classes).
As Figure 8.5 shows, we can now collapse module A-C so that we do not see modules A and C. The dependency that module D has on module A-C is an aggregation of the dependencies that module D had on module A and module C. By default, the aggregation is a simple summation, although other approaches to aggregation can also be configured. Notice the resulting matrix is now a lower triangular matrix. There are no dependencies (and hence no cycles) in the upper area of the matrix above the diagonal.
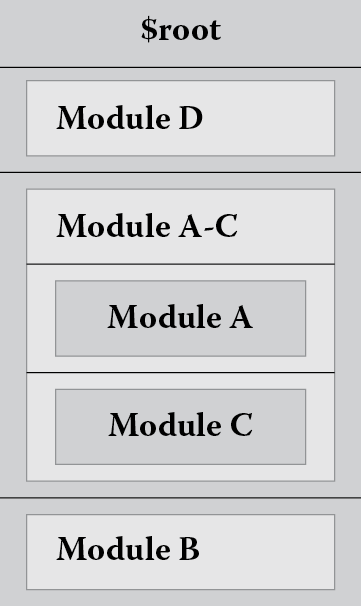
Partitioning can be done manually or by invoking a partitioning algorithm. The overall goal of DSM partitioning algorithms is to order a system starting with modules that use most of the other modules and ending with those that provide most to the others while grouping modules that are highly interdependent together in the ordering. DSMs thus can give us a sense of which modules underlie other modules and how coupled and cohesive they are. For example, the system represented by the DSM in Figure 8.5 can be envisioned as a layered system (shown in Figure 8.6) with the first block as the top layer, followed by the second block, and finally the third block as the bottom layer.
8.2.2 Partitioning Algorithms
There are several DSM partitioning algorithms. They are mostly similar except in how they identify cyclic dependencies. All partitioning algorithms proceed as follows (Lindemann, 2009):
- Identify system elements that have no dependencies from the rest of the elements in the matrix. These elements can easily be identified by observing an empty row in the DSM. Place those elements to the left and top of the DSM. Remove them from further consideration.
- Identify system elements that have no dependencies on other elements in the matrix. These elements can easily be identified by observing an empty column in the DSM. Place those elements to the right and bottom of the DSM. Remove them from further consideration.
- If after steps 1 and 2 there are no remaining elements in the DSM, then the matrix is completely partitioned; otherwise, the remaining elements contain cycles (at least one).
- There are many ways of determining a cycle, but one such method is called path searching. In path searching, dependencies are traced either backward or forward from a given element until the element is encountered twice. All elements between the first and second occurrence of this element constitute a cycle.
- Group the elements involved in a single cycle into one representative element and go to step 1.
Once elements are grouped, a topological sort can be used to order them so that dependencies between the groupings go in the same direction.
Figure 8.7 shows how partitioning works:
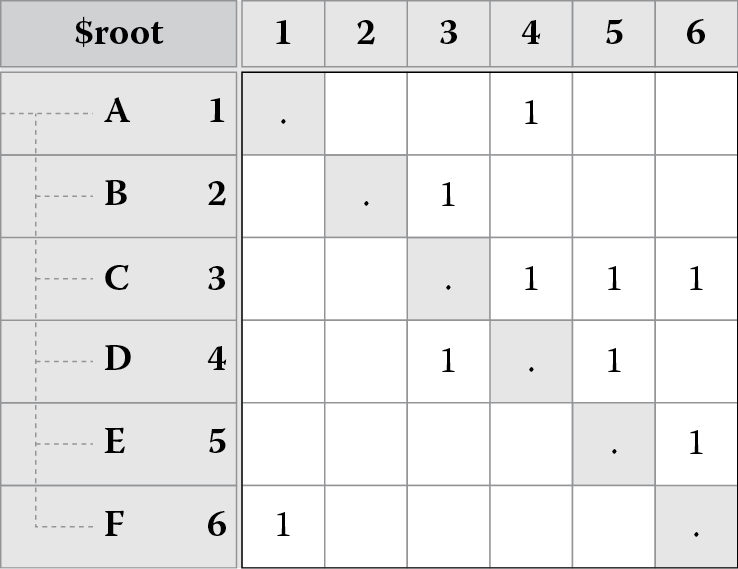
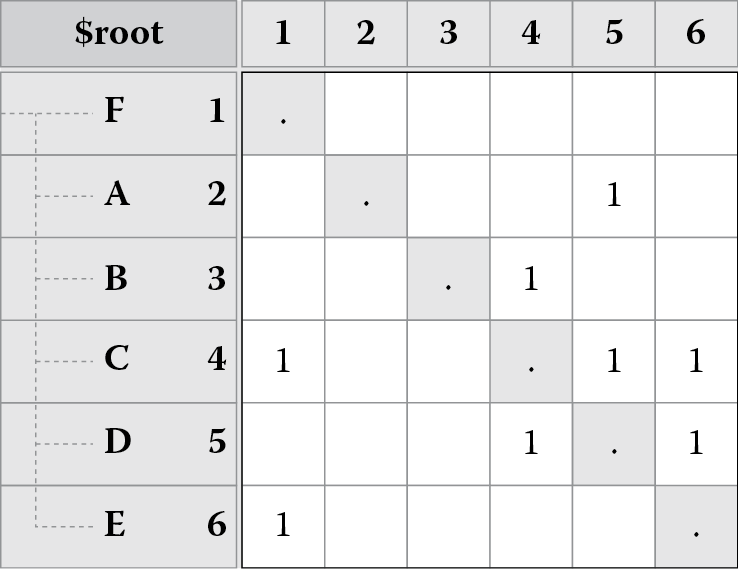
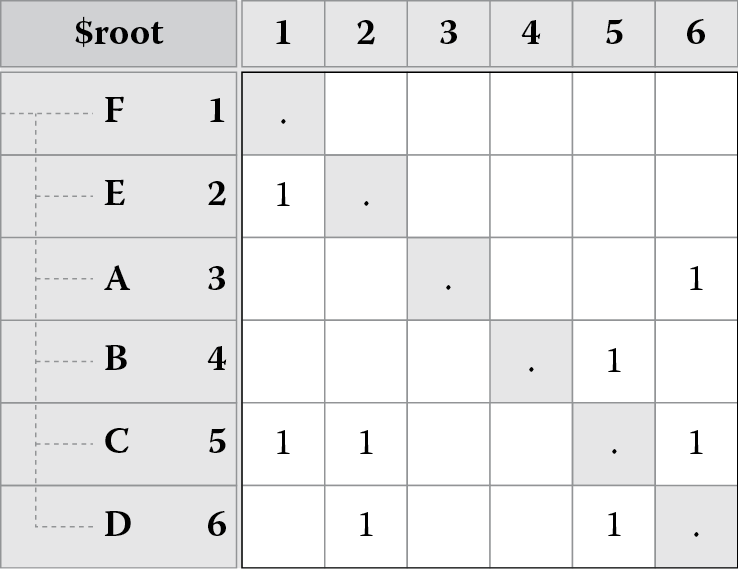
- Figure 8.7 shows the original dependency matrix.
- Figure 8.7 shifts element F to the left and top because it has no dependencies (empty row); we ignore F’s row and column in subsequent analysis.
- Figure 8.7 shifts element E to the left and top because it has no dependencies (empty row); we ignore E’s row and column in subsequent analysis.
- Figure 8.7 shifts element A to the right and bottom because it does not depend on anything (empty column); we ignore A’s row and column in subsequent analysis.
- Figure 8.7 shifts element B to the right and bottom because it does not depend on anything (empty column); we ignore B’s row and column in subsequent analysis.
- The remaining elements (C and D) have a cycle, so we collapse them into a single representative element called C-D. There are no more elements remaining at this point, and Figure 8.7 shows a completely partitioned matrix. Notice that the matrix is in a lower triangular form at this point.
8.2.3 Tearing a DSM
Tearing is the process of choosing the set of dependencies that create feedback loops that, if removed from the matrix (and then the matrix is repartitioned), will render the matrix lower triangular. The dependencies that we remove from the matrix are called “tears.” No optimal method exists for tearing, but Lindemann (2009) recommend keeping the tears to a minimum (also sometimes referred to as a minimum feedback set).
8.3 Managing Structural Complexity
We have learned that quality attribute requirements have a significant impact on the architecture of a system. If not given adequate attention early in the development life cycle, it becomes extremely difficult to achieve these requirements without significantly altering the structure of the system. When faced with such a situation, ad hoc approaches are typically used to retrofit the existing structure for achieving these qualities rather than significantly altering it in any way. For example, when faced with a performance requirement in a software system, many developers may use layer bridging within a perfectly layered system. Over time, such approaches introduce arbitrary complexity into a system, making it increasingly complicated and ultimately requiring a major restructuring during the course of its evolution.
Without a disciplined design approach, such as the one prescribed in this text, design concerns are likely to be comingled and not addressed systematically. In the worst case, a huge monolithic element, within which all issues are addressed, is naturally formed. Fixing problems under such situations requires considerable effort. In software systems, it is not unusual for maintainers to insert their pieces of code into different blocks of the same program. It is also not uncommon that a lot of obsolete code remains because people sometimes forget which parts belong to them and are reluctant to delete others’ work. Accordingly, the system continues to become bloated, making it difficult to maintain and evolve.
When better designed, concerns can be separate, and the system can be more modular. We still, however, need to carefully manage the associations among the modules of a system; otherwise, they can become coupled inadvertently. When there is no rule to guide the relationship between elements, the ripple effect of change in one element may extend to a significant part of the system.
With a well-designed architecture, there is a scaffold to guide the development of a system. Elements are restricted within fixed boundaries and are provided with few interfaces to allow communicating with outsiders.
8.3.1 Testing the Hypothesis
To test the hypothesis that an architecture-centric approach can lead to better separation of concerns and therefore lower structural complexity, a simple experiment was conducted. The search was for a project that had been abandoned, after several successful releases, because its developers were finding it increasingly hard to extend and maintain the application once it was operational (Sangwan et al., 2008; Sangwan and Neill, 2009). It was an Internet-based collaborative work environment incorporating speech communications, videoconferencing, e-mail, file sharing, and a shared whiteboard that had experienced the typical scope creep of operational systems as each new feature had been added successfully by the development team. As the system evolved, however, performance and reliability problems emerged. The system experienced significant degradation of performance when many shared whiteboards were active and would freeze if network connectivity were compromised. Despite rewriting thousands of lines of code, the team failed to overcome these issues and eventually abandoned the project.
Analysis of the abandoned system revealed that systemic concerns such as performance and reliability were distributed throughout the application to such an extent that improving them was now an impossible task. This was not merely a case of poor initial design, however. On the contrary, the initial architecture exhibited good object-oriented design. Given the requirements of the system, we would anticipate separate components for media, mail, drawing, and so on, and that is what we found.
So, what went wrong? As is typical in object-oriented analysis, the primary driver of design is the use case model. This promotes functional and data requirements, and this is reflected in the resulting architecture. Nonfunctional requirements are treated as secondary concerns that all components should exhibit, but when those requirements are not met, there is no single source of the problem to be repaired—the flaw is distributed across the application. In a general sense, although functional requirements can be achieved in any structure, only certain structures enable the qualities desired from those functions or the system as a whole.
The failure of the collaborative system project can be attributed to treating its significant nonfunctional requirements, such as performance and reliability, as secondary, such that it became problematic to address these concerns late in the development life cycle.
In the case of performance, for instance, event handling was recognized as one of the factors with an impact on processing efficiency; drawing, erasing, and mouse dragging generated thousands of events that most of the time led to unnecessary updates to the whiteboards. Keeping a history of these events so that parts of the session could be replayed led to inefficient memory utilization. In the case of reliability, breaks in Internet connectivity during periods of inactivity were an issue. These breaks were not discovered until buffers of the whiteboards began to overflow because of unsent data, further cascading into other failures.
If the issues were recognized, what made it problematic to fix them? The code for performance and reliability concerns was spread throughout the system. Separating these concerns and retrofitting the existing structure to meet the performance and reliability demands led to the introduction of arbitrary complexity (undesirable dependencies, cycles, paths of communication, fat methods and classes, etc.), making the system excessively complex or complicated. This made it difficult to understand, maintain, test, and troubleshoot.
Figure 8.8 shows the DSM for the failed system. As can be seen from this DSM, there are two significant clusters marked as tangle of 9 and tangle of 3 in the figure. There are numerous cells in the DSM for which the number of dependencies is in the hundreds or thousands. The clusters are indicative of extensive coupling, and large numbers of dependencies are indicative of poor cohesion. Together, they suggest a system that not only would be difficult to understand but also would be difficult to maintain as any change made to the system had the likelihood of propagating to a significant proportion of the system. Detailed examination of the system revealed that the coupled and incohesive part made up 39% of the entire code base of the system (348 of the 897KLOC [Thousand Lines of Code]).
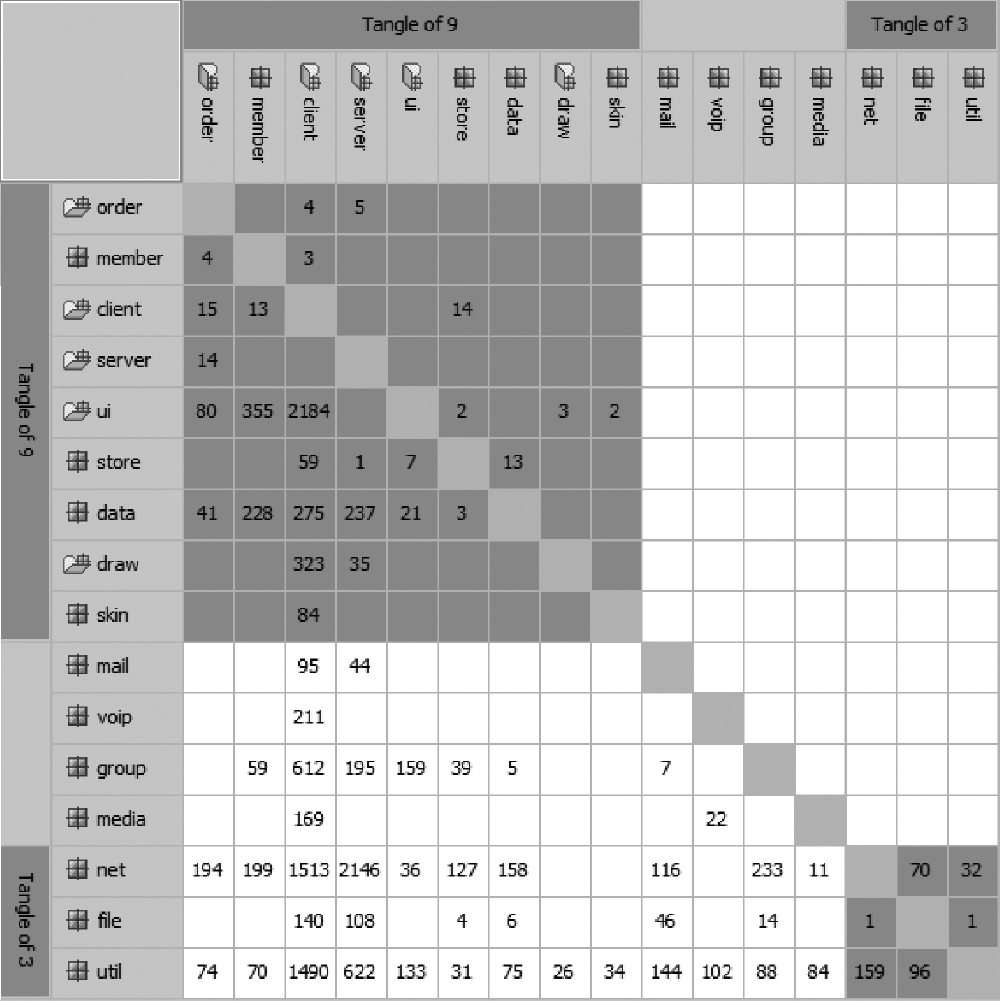
DSM for the failed Internet-based collaboration system. (Adapted from R. Sangwan and C. Neill, Characterizing essential and incidental complexity in software architectures. In Proceedings of the 8th Working IEEE/IFIP Conference on Software Architecture , August 14–17, 2009, Cambridge, UK.)
To examine if its complexity was a by-product of the development method, we chose to develop a new version of the system employing the architecture-centric approach advocated in the text. Rather than focus on the entire system, we chose the whiteboard subsystem of the Internet-based collaboration environment because this was the part that suffered most from poor modularity, performance degradation, and lack of reliability—creating conditions that were hard to troubleshoot while the system was in operation. The whiteboard subsystem is represented by the tangle of 9 (in the upper left) of the DSM shown in Figure 8.8.
Table 8.1 shows a set of scenarios we chose to drive the design. Starting with a monolithic subsystem, we addressed driver 1 and applied the modifiability tactics to limit the impact of change and minimize the number of dependencies on the parts of the subsystem responsible for integrating new input or display devices. Figure 8.9 shows we first introduced a Whiteboard Module and decomposed it into a BoardSensor and a BoardPane to handle disparate input and output devices, respectively, a tactic to anticipate expected changes. We added a BoardConnection element to handle communication between various input and output devices, a restrict communication paths tactic. Finally, a BoardInterface element was introduced for connecting different BoardPane elements to different BoardSensor elements, an intermediary tactic.
Prioritized Architectural Drivers
|
Driver No. |
Quality Attribute |
Architectural Drivers |
|
1 |
Modifiability |
The system shall be capable of receiving inputs from different devices, such as a wireless pen tablet or touch screen, and sending output to different devices, such as a display station or a smartphone. |
|
2 |
Performance |
The system shall respond within no more than 1 s for sketching or drawing and no more than 5 s for any other operation. |
|
3 |
Testability |
Tracking progress of execution and troubleshooting any failures shall be possible at runtime. |
|
4 |
Availability |
The system shall recover from unstable network connections. |
Source : Adapted from R. Sangwan, L. Lin, and C. Neill, IEEE Compute r October 2008, pp. 99–102.
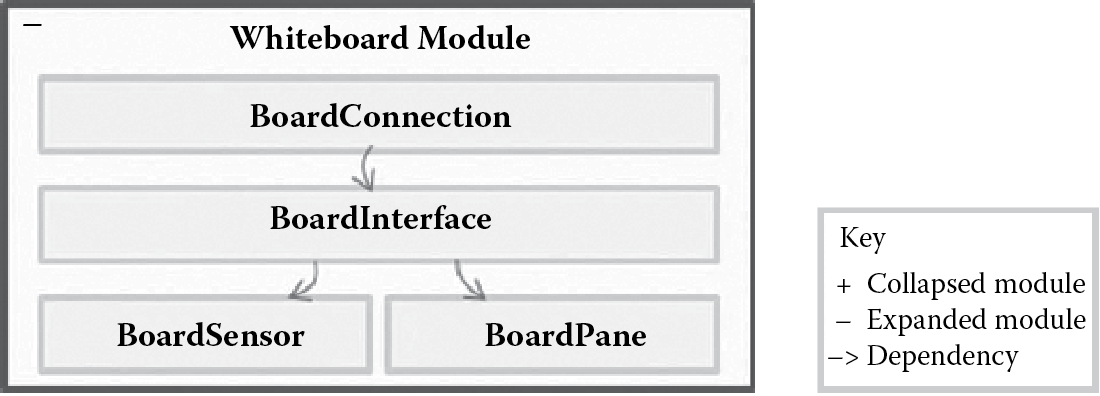
Whiteboard subsystem after adding support for disparate input and output devices. (Adapted from R. Sangwan, L. Lin, and C. Neill, IEEE Computer October 2008, pp. 99–102.)
Figure 8.9 uses the layered view convention first introduced in Figure 8.6. The same convention is also used for subsequent figures related to this design experiment.
Next, driver 2 was addressed using performance tactics (control sampling frequency and reduce computational overhead) to add support for critical system operations so they operate within specific latency constraints. The Event Management Module was created to manage sampling of events (from drawing, erasing, mouse dragging, etc.) and implementing efficient algorithms for updating the whiteboard display (BoardPane) when events arrive. This module was also responsible for implementing a memory-efficient history mechanism for these events so sessions could be replayed. The resulting system is shown in Figure 8.10. The EventFactory is responsible for creating the different types of Events that the WhiteBoard Module generates, and the EventListener listens for, and controls sampling of, these events.
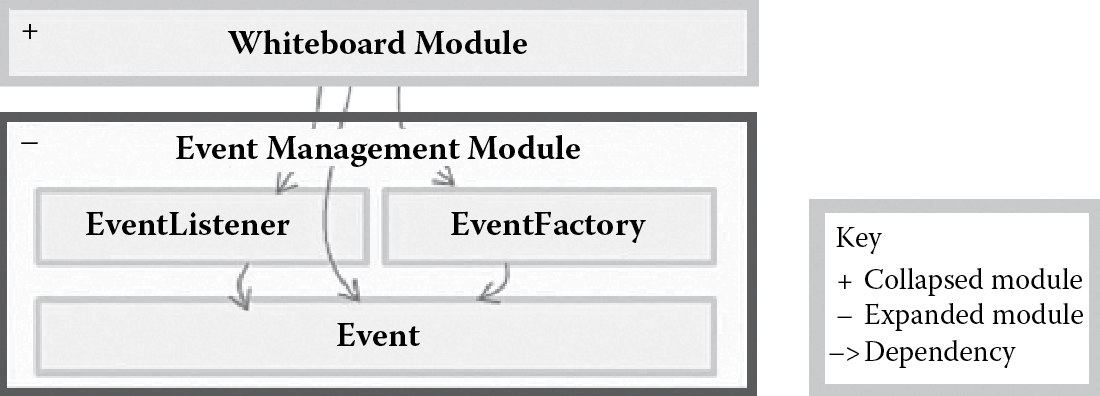
Whiteboard subsystem after adding support for operations to perform within specified latency constraints. (Adapted from R. Sangwan, L. Lin, and C. Neill, IEEE Computer October 2008, pp. 99–102.)
The testability tactic (built-in monitor) is applied next to address driver 3 to minimize the effort required to test the system at runtime. A Logging Module is added with a Logger element used for publishing information and Reader element used for providing the published information to its subscribers. A Testing Module is added with a Server element, which can output logged information over the Internet to any telnet console compatible with the Transmission Control Protocol/Internet Protocol (TCP/IP), and a Console element that can display the logged information. The results are shown in Figure 8.11.
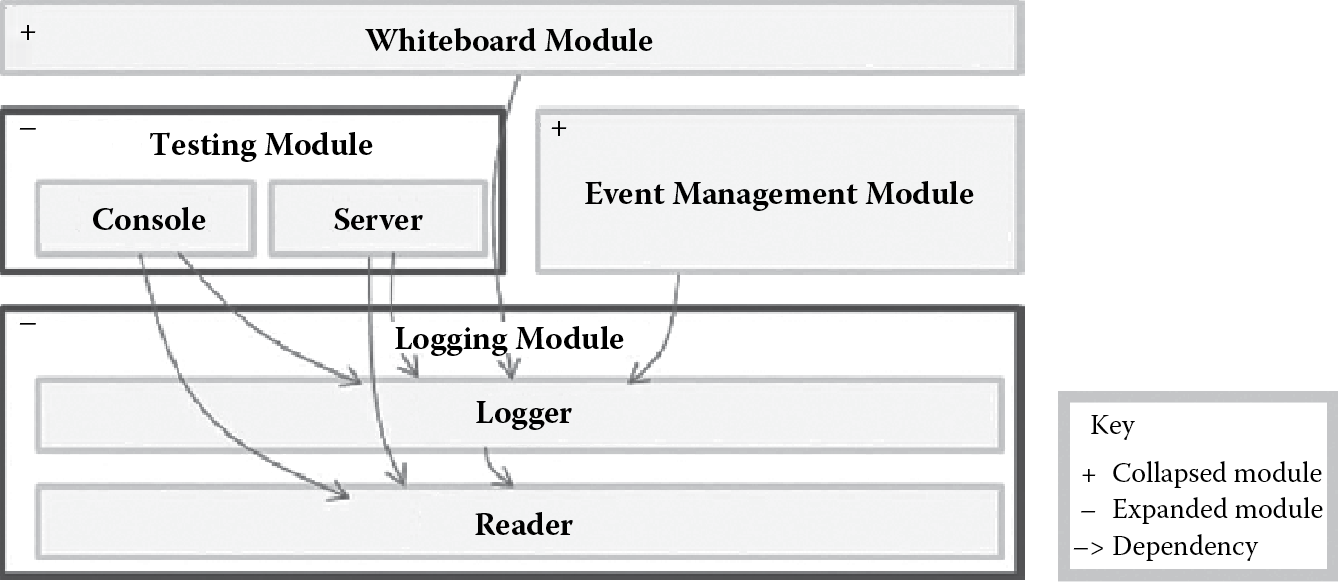
Whiteboard subsystem after adding support for minimizing the effort to test the system while it is in operation. (Adapted from R. Sangwan, L. Lin, and C. Neill, IEEE Computer October 2008, pp. 99–102.)
Finally, reliability (driver 4) is achieved by creating a Messaging Module with the Messenger element used for reading and writing messages over the Internet and the Message element used for storing and manipulating these messages. The Messenger element implements a heartbeat tactic for fault detection (e.g., broken network connection) and notifies the BoardPane element of the Whiteboard Module. The BoardPane element recovers from the fault by collaborating with the Messenger element using a state resynchronization tactic for fault recovery (e.g., resynchronize content after a network connection is reestablished).
As can be seen in the final subsystem architecture, all dependencies between layers flow in the same direction, from the topmost layer downward. This indicates that there are no cycles in the dependency graph and therefore no tangles that would propagate changes and errors throughout the system. This is shown in the DSM in Figure 8.12.
DSM for the reengineered whiteboard subsystem. (Adapted from R. Sangwan and C. Neill, Characterizing essential and incidental complexity in software architectures. In Proceedings of the 8th Working IEEE/IFIP Conference on Software Architecture , August 14–17, 2009, Cambridge, UK.)
8.4 Discussion and Conclusions
Quality attributes are critical to the evolution of a software architecture. If put into the design earlier, they make the resulting system less complex and more stable, like the newly devised whiteboard subsystem presented in this work. Not paying attention to these qualities can make the system so tangled that it becomes difficult to manage, like the original whiteboard subsystem.
The case study work stepped through the significant quality attributes for the whiteboard subsystem by adopting appropriate patterns and tactics and derived the new architecture for the same system with clear-cut internal structure. Modifiability, performance, testability, and reliability were achieved while effectively managing structural complexity.
8.5 Discussion Questions
- Given the following dependency structure matrix for a system consisting of modules A, B, C, D, and E,
A
B
C
D
E
A
.
X
X
X
X
B
.
X
X
X
C
X
.
X
X
D
.
X
E
.
- Create a block triangular matrix.
- From the block triangular matrix, create a layered view of the system.
- Given the final architecture of the building automation system in Figure 5.7,
- Create a DSM.
- Transform the DSM into a block triangular form.
- Create a layered view of the system using the block triangular form of the matrix.
References
S. Eppinger, Model-based approaches to managing concurrent engineering, J. Eng. Design 2 (4), 283–290, 1991.
Lattix, version 7.0. 2011. http://www.lattix.com.
U. Lindemann, Technical DSM Tutorial. 2009. http://dsmweb.org.
R. Sangwan, L. Lin, and C. Neill, Structural complexity in architecture-centric software evolution, IEEE Computer October 2008, pp. 99–102.
R. Sangwan and C. Neill, Characterizing essential and incidental complexity in software architectures. In Proceedings of the 8th Working IEEE/IFIP Conference on Software Architecture, August 14–17, 2009, Cambridge, UK.
W. Stevens, G. Myers, and L. Constantine, Structured design. IBM Syst. J. 13 (2), 115–139, 1974.
D.V. Steward, The design structure system: A method for managing the design of complex systems, IEEE Trans. Eng. Manage. 28 (3), 71–74, 1981.
Structure 101, Version 3.5, Build 1527. 2011. http://www.headwaysoftware.com.
K.J. Sullivan, W.G. Griswold, Y. Cai, and B. Hallen, The structure and value of modularity in software design, ACM SIGSOFT Softw. Eng. Notes 26 (5), 99–108, 2001.
R. Taylor, N. Medvidovic, and E. Dashofy, Software Architecture: Foundations, Theory and Practice. Hoboken, NJ: Wiley, 2009.