
9 Risk Management and Risk-Oriented Testing
In software development, problems may arise during the course of a product’s development and later during operational use. We therefore distinguish between project and product risks. Early risk-identification, analysis, evaluation, and control combined with a risk-oriented test plan and test prioritization enables test management to help control risks.
9.1 Introduction
Countless examples show that IT projects carry inherent risks (e.g., [Standish 04]). A risk is a problem that could occur in the future with undesirable consequences. The severity of a risk is made up of the likelihood of the problem occurring and its collateral damage. Peter G. Neumann ([Neumann 95]) publishes and regularly updates a list of risks or damages resulting from the use of IT products.
IT project = risk!
Test managers must face these facts. In principle, there are two ways in which to react:
![]() Ignoring risks (“ostrich-like” behavior)
Ignoring risks (“ostrich-like” behavior)
![]() Tolerance and proactive risk management
Tolerance and proactive risk management
The first option does not necessarily prevent the project from being successful, yet it does leave those involved in the dark about what could perhaps happen “tomorrow.” The second option may not always secure the project’s success, but it enables those involved to at least get a glimpse of a possible future so that they can act accordingly and with precaution.
The reliability of individual actions increases with better risk handling. Risks can be kept low if potential risks are recognized early and if counter-measures are initiated in time to lower the probability of occurrence or the extent of damage.
The intention of risk management
This is the purpose of risk management. To put it crudely, →risk management is the conscious and deliberate planning of failures and their consequences ([DeMarco 03]). It comprises the systematic identification, analysis, evaluation, control, mastering, monitoring, and communication of risks in order to effectively minimize losses and optimize the benefits ([IEC 62198], [ISO 16085]). The objective of risk management is to identify risks that could massively endanger project success or lead to very poor product quality because of, for example, drastic cost overruns and schedule delays and to prevent their occurrence with suitable measures.
Within the given constraints (effort, time, availability, etc.) the intention of risk-oriented testing is to design software testing in such a way as to minimize as much as possible previously identified risks, i.e., →project risks relating to development or →product risks relating to the product’s operational use ([Spillner 07, section 6.4.3]). A product risk, for example, may be an undetected defect that could lead to a system failure, whereas a project risk could be failure to meet a delivery date.
The intention of risk-oriented testing
The IEEE 1008 Standard for Software Unit Testing ([IEEE 1008]), for example, considers the identification of risk areas addressed by testing as an inherent step in test planning. Systems with a high risk potential must be more intensely tested than systems that do not cause much damage if they fail, whereby risk estimation must be done for individual system parts or even individual defect potentials. Thus, test managers always also act as risk managers.
Ideally, all participants in a project are involved in all the phases and steps of risk management. The most important parties involved in this process and their responsibilities are listed here:
![]() The customer: He demands project risk management and provides information regarding acceptable risks and product environment.
The customer: He demands project risk management and provides information regarding acceptable risks and product environment.
![]() The management of the contractor (i.e., the project sponsor): Management requires and promotes project risk management and provides information regarding the project environment and corporate risk management.
The management of the contractor (i.e., the project sponsor): Management requires and promotes project risk management and provides information regarding the project environment and corporate risk management.
![]() The project manager: He takes into account in his project budget the costs of risk minimizing activities and of risk management itself. He is in charge of risk management and provides, if necessary, further resources (e.g., sufficiently experienced engineers).
The project manager: He takes into account in his project budget the costs of risk minimizing activities and of risk management itself. He is in charge of risk management and provides, if necessary, further resources (e.g., sufficiently experienced engineers).
![]() The test manager: He actively participates in risk management and optimizes test strategy and test effort to reduce product risks.
The test manager: He actively participates in risk management and optimizes test strategy and test effort to reduce product risks.
![]() Developer, tester and users: They provide information related to project and product risks.
Developer, tester and users: They provide information related to project and product risks.
A comprehensive risk management process (see also [Charette 89], [ISO 16085], [IEC 62198]) involves specific activities that will be discussed in more detail in the next sections of this chapter:
![]() Identification of the risk context
Identification of the risk context
![]() Risk identification
Risk identification
![]() Risk analysis and risk evaluation
Risk analysis and risk evaluation
![]() Risk control and treatment
Risk control and treatment
![]() Risk verification and monitoring
Risk verification and monitoring
These activities cannot be performed without effective communication between all the parties involved. It is part of the general management activities to learn from completed projects and to critically assess risk management during project wrap-up.
In order to gain maximum benefit from risk management, risk management activities are to be started as early as possible in the project and continued through out the project’s life cycle.
Start risk management early and keep on doing it.
9.2 Context Identification
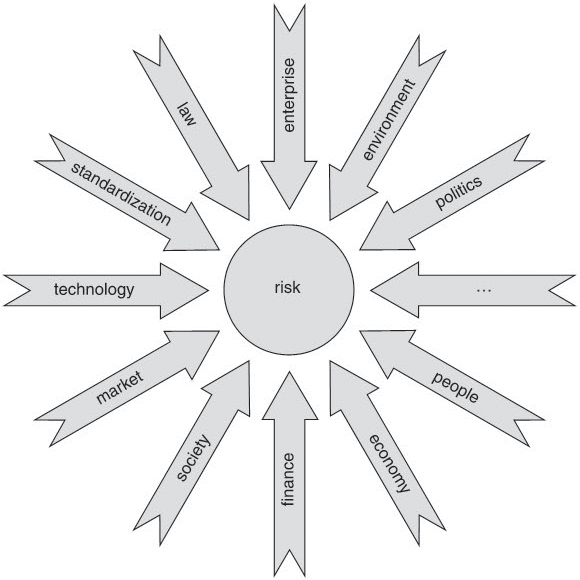
The risk context must be defined right at the beginning of the risk evaluation. It comprises the project’s stakeholders, the agreed-upon project goals and results, and the scope and delimitations of risk management within the project context. Within this context, interfaces and overlaps with other projects need to be identified together with all organizational and strategic constraints regarding the project or product. According to the [ISO 16085] standard, these are external goals and constraints that may limit the project, throw it off course, or jeopardize product deployment. Examples are technical, corporate specific, commercial, political, financial, legal, contractual, and market political developments (see figure 9-1).
Listing all the project goals defined to satisfy project, corporate, and customer requirements helps with later risk identification and risk prioritization. Moreover, all the general criteria for risk acceptance and risk tolerance are to be listed for use during the evaluation of identified risks in later process phases.
Figure 9–1 Factors of the risk context
It is also important for the test manager to know the project environment and to be familiar with the project and product characteristics. The latter need to be quantified in the form of quality goals (see also [ISO 9126]).
9.3 Risk Identification
Risk management revolves around maximum identification of all relevant risks. →Risk identification should be process oriented and individual risks should be combined into risk categories to provide a better overview. This will be described in the next section. Section 9.3.2 introduces some techniques and means for risk identification.
9.3.1 Risk Categories
A rough but in most cases sufficient risk categorization differentiates between external and strategic risks as well as between project and product risks that are of particular importance to the test manager.
External risks, for example, are natural events (lightning damage, water damage, earthquake) or political, legal, or social changes, but there are also macro-economic risks such as market shifts, the evolution of new sector trends and new markets, technical changes, and changes in customer behavior. These risks cannot really be influenced. Additionally, some of these risks cannot even be predicted (at least not in the medium term).
External risks: cannot be influenced and are difficult to predict
Strategic risks subsume micro-economic risks such as changing market shares, the company’s liquidity, takeovers, and outsourcings (for instance, of the IT department). In addition, there arc organizational risks, such as changes in the corporate organizational and operational structures, associated uncertainties with respect to strategic investments, project control and planning, and resource shortages due to competing projects. Insufficient corporate crisis management, as well as communication barriers concerning “bad news” for upper management rate among these, too. Strategic risks cannot really be influenced by the project or test manager, but often they are at least fairly easy to predict.
Strategic risks: difficult to influence but often easy to predict
Among the project risks (operational risks), we find potential problems in logistics and sales; for instance, if a supplier drops out or if a licensing agreement for a third-party software product cannot be concluded in a way that satisfies the needs of the development department. Further project risks are staff fluctuation, contractual risks, supplier problems, and overly optimistic effort estimations and schedules. A risk may also be a company’s excessively aggressive pricing policy, as a result of which resources become very limited.
Project risks: predictable and relatively easy to influenc
Technical project risks, too—such as insufficient IT safety (e.g., outage of the project servers due to viruses), insufficient requirements management, product line uncertainties, and required use of new and immature technology and development tools—frequently end up in project failure. Especially in complex, distributed development projects, we find a whole vista of different risks arising out of the project structure itself: communication problems, differences in organizational process maturity, deadline pressures, and the application of new, not sufficiently mastered development techniques.
Defect correction risks, too, are project risks, because additional time is required for defect analysis and correction, regression testing, renewed delivery, and installation. Sometimes this even needs to be accompanied with time-consuming corrective customer training. With new products, delays may occur because developer capacity is tied up in the maintenance area. The project or test manager can, in principle, influence and predict such risks in most cases.
Product risks are a result of problems with the delivered product. Such risks lead to many different types of damage, depending on who is affected:
Product risks: can be influenced and are easily predictable
![]() The manufacturer incurs mostly indirect nonconformity or failure costs. These are costs or losses in sales due to nonperformance of the contract or product liability claims, increased effort for customer hotline and support, and loss of image that may lead to losing the customer altogether, as well as a declining “brand value” due to insufficient functionality, poor quality, or even violations of the law enabled or supported by the product (viruses, phishing, etc.).
The manufacturer incurs mostly indirect nonconformity or failure costs. These are costs or losses in sales due to nonperformance of the contract or product liability claims, increased effort for customer hotline and support, and loss of image that may lead to losing the customer altogether, as well as a declining “brand value” due to insufficient functionality, poor quality, or even violations of the law enabled or supported by the product (viruses, phishing, etc.).
![]() For the customer of the system, product risks are often reflected in direct failure costs incurred by him as a result of software failures (and for which the manufacturer may be liable, see [Spillner 07], section 6.3.1). Among these are, for instance, costs of computation errors, data loss, accounting errors, hardware damage.
For the customer of the system, product risks are often reflected in direct failure costs incurred by him as a result of software failures (and for which the manufacturer may be liable, see [Spillner 07], section 6.3.1). Among these are, for instance, costs of computation errors, data loss, accounting errors, hardware damage.
![]() If the customer uses the system to provide some kind of service to one or more end users, the end user, too, may suffer damage through the product risk. This may range from unwanted commercials to administering wrongly delivered medication as a result of a failing logistic system.
If the customer uses the system to provide some kind of service to one or more end users, the end user, too, may suffer damage through the product risk. This may range from unwanted commercials to administering wrongly delivered medication as a result of a failing logistic system.
![]() The “safety” issue must be considered as a further risk class (e.g., in systems such as an irradiation device in a hospital). Here we may have a product or user risk even with a faultlessly running system; an operating error could cause the system to inflict damage (e.g., using too high a radiation dose) or external circumstances could change the operating conditions or the system environment (e.g., a power cut). With regard to safety risks, we need to take into account issues such as usability, redundancy, and error tolerance, and we need to make sure that the system is endowed with functions or features appropriate to its risks.
The “safety” issue must be considered as a further risk class (e.g., in systems such as an irradiation device in a hospital). Here we may have a product or user risk even with a faultlessly running system; an operating error could cause the system to inflict damage (e.g., using too high a radiation dose) or external circumstances could change the operating conditions or the system environment (e.g., a power cut). With regard to safety risks, we need to take into account issues such as usability, redundancy, and error tolerance, and we need to make sure that the system is endowed with functions or features appropriate to its risks.
Applying suitable methods and techniques will make product risks relatively controllable for the project or test manager. Together with quality metrics or tests, such risks are also measurable and predictable.
Product risks can be further differentiated into the following two categories:
![]() Business (functional) aspects (particularly critical functions or business processes)
Business (functional) aspects (particularly critical functions or business processes)
![]() Technical (nonfunctional) aspects (e.g., technological, platform, performance, safety, and usability aspects)
Technical (nonfunctional) aspects (e.g., technological, platform, performance, safety, and usability aspects)
Assumptions made at project start regarding the project environment and the operational use of the products represent a risk source and must be regularly checked with regard to their validity.
9.3.2 Techniques and Utilities
In order to be able to identify risks, the following techniques and utilities can be applied and fine-tuned to the specific project situation:
![]() Expert interviews and questionnaires
Expert interviews and questionnaires
![]() Independent estimations (audits, assessments)
Independent estimations (audits, assessments)
![]() Risk workshops
Risk workshops
![]() Risk brainstorming
Risk brainstorming
![]() Use of risk templates and checklists
Use of risk templates and checklists
![]() Experiences from completed projects
Experiences from completed projects
Different roles, ranging from executives, external consultants, and experienced project or test managers to former, already retired top managers may be invited to participate in expert interviews and independent risk evaluations.
Premise of risk identification: Think the unthinkable!
What is important is that these people are not influenced in their statements by predefined project goals and stakeholder wishes and that they are well and objectively informed about the project situation and specific project and product characteristics.
Risk workshops can be planned and performed similar to reviews (see [Spillner 07, section 4.1.3]). At the beginning, the risk manager informs everybody involved, whereby next to the team members (architect, developer, tester), members of the steering committee or, should the need arise, external experts are to be informed, too. All participants of the workshop receive sufficient information about the project and its context (customer requirement specification, project plan, risk checklists) and each of them individually define possible risks. Before the workshop, the risk manager ensures that workshop aids such as pin boards, presentation material, and a video projector are available. It also makes sense to reserve one separate pin board for each of the main risk categories.
Performing a risk workshop
Normally, the risk manager also moderates the workshop. At the beginning of the workshop, all participants are briefed about the workshop schedule and all (or those that have not done so yet) are given approximately 30 minutes to draw up an individual risk list. Risks are written down on note cards and then arranged on one of pin boards according to their risk category. All perceived risks are subsequently discussed per category and consolidated, and duplicates are removed. In some cases, more suitable terms may be found or some more risks added.
At the end of the workshop, some initial ideas are collected for the evaluation of each of the remaining risks (see section 9.4.1) and possible occurrence indicators are listed. Examples are a high number of staff on sick leave and frequent changes of particular functions (see section 9.4.2).
In order to counteract possible uncertainties and anxieties that might prevent people from naming critical risks (“showstoppers”), techniques such as catastrophe brainstorming based on scenario building may be used (see DeMarco and Lister [DeMarco 03]). In such a session, participants may voice their worst project-related “nightmares.” Additionally, the moderator can, for instance, predict that the project will fail after x months, whereupon all participants must name possible causes that could lead to the disaster. In many cases, a change of perspective turns out to be helpful, starting out with the question of what would be the best possible project outcome. Then possible causes that might prevent the project from reaching that goal are determined. All in all, the workshop will try to consider many different scenarios leading to possible project failure. After all the “nightmares” and scenarios leading up to them have been collected, underlying causes are analyzed and associated risks identified.
Scenario-based worst case brainstorming
Checklists for risk identification pool the experiences of earlier projects. These experiences need not have been made in the same company and help to avoid known errors and forgetting important, frequently occurring risks.
Checklists pool earlier experience
The “Top Ten” lists of the software development risks ([Ould 99], [Standish 04], [Pol 02]) may be used to set up an initial checklist for risk identification. They regularly contain risks like those listed here:
General risk checklist for software projects
![]() Insufficient top-level management support
Insufficient top-level management support
![]() Unrealistic schedules and budgets
Unrealistic schedules and budgets
![]() Lack of user involvement; hence, incompletely defined requirements and continuous requirement changes
Lack of user involvement; hence, incompletely defined requirements and continuous requirement changes
![]() Plans either missing or not detailed enough
Plans either missing or not detailed enough
![]() Development of wrong functions and features
Development of wrong functions and features
![]() Development of a wrong or poor user interface
Development of a wrong or poor user interface
![]() Unnecessary “gold-plating” of already sufficient functions and features (overshooting the mark)
Unnecessary “gold-plating” of already sufficient functions and features (overshooting the mark)
![]() Insufficient qualification or poor productivity
Insufficient qualification or poor productivity
The following checklist contains particular test-related risks relevant to the test manager (see also [Pol 02]):
Risk checklist for test
![]() Test basis insufficient or not available in time (business workflow methods, instructions for use, and design specifications)
Test basis insufficient or not available in time (business workflow methods, instructions for use, and design specifications)
![]() Qualitatively insufficient test basis
Qualitatively insufficient test basis
![]() Overly optimistic or “aggressive” delivery date preventing completion of all test activities
Overly optimistic or “aggressive” delivery date preventing completion of all test activities
![]() Testers not available or not available in time (quantitatively and qualitatively)
Testers not available or not available in time (quantitatively and qualitatively)
![]() Productivity problems due to lack of test expertise or premature introduction of new test techniques
Productivity problems due to lack of test expertise or premature introduction of new test techniques
![]() Efficiency losses due to missing or poorly established test management processes
Efficiency losses due to missing or poorly established test management processes
![]() Effort overruns and schedule delays in test if estimations and planning are done based on experience values only
Effort overruns and schedule delays in test if estimations and planning are done based on experience values only
![]() Delayed availability of the necessary test environment
Delayed availability of the necessary test environment
![]() Incomplete control over the test environment and associated elements (hardware, software, data, etc.)
Incomplete control over the test environment and associated elements (hardware, software, data, etc.)
![]() Poor test coverage or ignorance of defects and risks still hidden in the software due to the use of test specification techniques that are inadequate for the test object
Poor test coverage or ignorance of defects and risks still hidden in the software due to the use of test specification techniques that are inadequate for the test object
![]() System failure or unwarrantable performance of individual functions due to skipped or missing performance and load tests
System failure or unwarrantable performance of individual functions due to skipped or missing performance and load tests
These checklists should in due course be adapted to the organization’s concrete circumstances and be made applicable to all projects; furthermore, they should be substantiated with added notes and risks relating to concrete experiences and possible occurrence indicators (see section 9.4.2) and measures taken together with their impacts and effects.
Example: Risk identification for VSR
To identify the risks in the VSR project, the test manager draws up an initial risk list. After some pondering and going through status reports of former projects, he comes up with the following list:
![]() Chief tester drops out
Chief tester drops out
![]() Late requirement changes
Late requirement changes
![]() Delays in development
Delays in development
![]() Overly optimistic test planning
Overly optimistic test planning
![]() Insufficient entry quality of the test object
Insufficient entry quality of the test object
![]() Poor quality of the test basis
Poor quality of the test basis
![]() 64-bit version of the test tools available too late or not at all
64-bit version of the test tools available too late or not at all
![]() Configuration and versioning problems
Configuration and versioning problems
![]() Loss of the configuration management database
Loss of the configuration management database
In a second step, this list is distributed to the project and subproject leaders and some of the testers and developers for review and possible supplementing. A risk brainstorming meeting is felt to be too time consuming.
Based on the returned feedbacks, the test manager revises and consolidates the risk list, identifying the following additional risks:
![]() Planned changes to the user interface could adversely affect the automated GUI tests.
Planned changes to the user interface could adversely affect the automated GUI tests.
![]() A change of the database system could adversely affect system performance and require further performance testing.
A change of the database system could adversely affect system performance and require further performance testing.
![]() The auto manufacturer’s early model change could result in having to move the latest delivery date up to an earlier one.
The auto manufacturer’s early model change could result in having to move the latest delivery date up to an earlier one.
The current list does not yet contain statements regarding risk probability or occurrence indicators since these will be identified later during risk analysis and risk evaluation.
Typically, all minor problems and those for which a solution has already been found or that can be easily averted are meticulously listed and tracked, whereas the really big, major problems are often not mentioned at all.
Dare to speak the unspeakable and risk using in your risk workshops words like “failure, technology revolution”, and “flu epidemic”!
9.4 Risk Analysis and Risk Evaluation
During →risk analysis, recognized risks are quantified or at least qualitatively weighted and then evaluated. There are many different approaches with different degrees of precision, reaching from simple assignments to risk classes to precise probabilistic calculations.
Qualitative analysis can be performed early in the project’s life cycle even though only little or shaky data may be available. Quantitative techniques can be applied if and as soon as more data is available.
The outcome of risk analysis and evaluation is a comprehensive risk inventory in which all risks are described and listed together with estimations on the probability of their occurrence over time and the expected damage incurred. Moreover, each risk has occurrence indicators assigned to it, based on which an impending risk can be recognized early and objectively. The following sections explain both aspects in more detail.
9.4.1 Analysis Techniques
Depending on circumstances, risk analysis uses quantitative and qualitative techniques. Quantitative analysis quantifies risks based on statistical data and fuzzy mathematics, system and sensitivity analyses, and error tree or incident sequence analyses. Should quantitative techniques reach their limits, qualitative techniques or techniques such as scenario-based analyses similar to those used in risk identification (see section 9.3.2), Pareto or ABC analyses, scoring models, and risk matrices (see section 9.4.3) are used.
Quantitative or qualitative risk analysis
As already explained in Software Testing Foundations [Spillner 07, section 6.4.3], a risk can be quantitatively calculated if the probability of occurrence (P) and the associated damage (D) can be quantitatively estimated. Risk R is calculated as follows:
Risk = occurrence probability × accrued damage
R = P × D
Estimating risks with very large damaging effect, the maximum possible loss (MPL) and the probable maximum loss (PML) are frequently determined together with the probability with which a certain amount of damage is going to be reached or exceeded.
In most cases, however, probability of occurrence and incurred damage are not accurately quantifiable and can only be estimated qualitatively in terms of trends. The risk is then defined as a gradation within a number of classes or categories. If no reliable data is available, analysis is performed based on subjectively felt probabilities and damage estimations.
In such cases, the results depend on the experience of the evaluating person and must therefore be based on independent evaluations of several people. Results are then averaged.
Project managers, developers, test managers, testers, and users all have different viewpoints when it comes to risk evaluation. Whereas project managers tend to evaluate project risks as high, developers will direct their attention to product risks and are inclined to use caution, although they are prepared to take chances when it comes to using the latest technology. Test managers and testers, too, concentrate on product risks, in particular on possible failures and associated indirect failure costs. Test managers also consider project risks that could jeopardize the test process. For the user, product risks and especially direct failure costs are the focus of their risk evaluation.
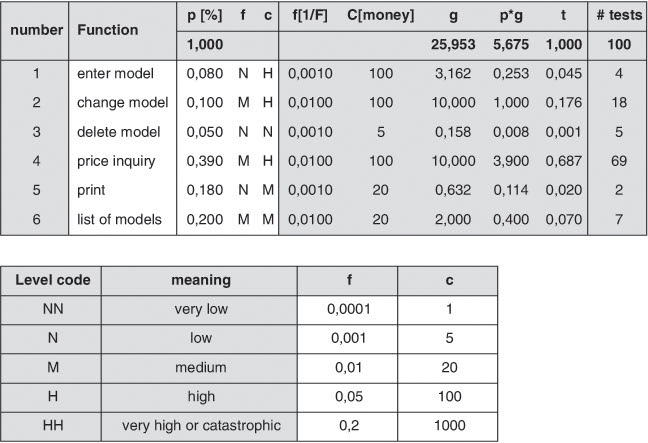
In practice, the probability of occurrence is often weighted in terms of classes such as “neglectable,” “low,” “medium,” and “high,” and “very high” mapped onto values ranging from 1 to 9 to calculate the risk. Similarly, the amount of damage can be stated qualitatively, whereby the mapping onto (monetary) values should be based on a nonlinear scale, such as, for example, 1, 10, 50, 100, and 1,000. Particularly risks that are difficult to quantify as regards market or image loss can thus be mapped more easily.
For a risk analysis based on functional requirements (and also for test effort estimation), the following criteria can be used to establish a risk profile for the functions:
Risk profile for functional requirements
![]() The frequency of execution or use: F indicates the mean frequency with which a function is executed. With frequently executed functions, the probability of software defects impacting program execution and causing failures is very high. On the other hand, direct failure costs grow with the number of occurred failures.
The frequency of execution or use: F indicates the mean frequency with which a function is executed. With frequently executed functions, the probability of software defects impacting program execution and causing failures is very high. On the other hand, direct failure costs grow with the number of occurred failures.
![]() Criticality: C represents the (worst) possible effects of a function not working at all or working erroneously. Criticality is defined in subsequent evaluations together with the customer and with the possible assistance of technical experts. In addition, it is often evaluated in monetary terms; i.e., with regard to its financial consequences.
Criticality: C represents the (worst) possible effects of a function not working at all or working erroneously. Criticality is defined in subsequent evaluations together with the customer and with the possible assistance of technical experts. In addition, it is often evaluated in monetary terms; i.e., with regard to its financial consequences.
![]() The project risk: RP (to what extent will nonfulfillment of a function at a given time put project progress at risk) results, for instance, from the number of functions dependent on the function under consideration.
The project risk: RP (to what extent will nonfulfillment of a function at a given time put project progress at risk) results, for instance, from the number of functions dependent on the function under consideration.
![]() The technical product risk: RT (how complex is the implementation of the function?) is derived from the complexity of the description (textual description, perhaps activity diagrams and sequence diagrams).
The technical product risk: RT (how complex is the implementation of the function?) is derived from the complexity of the description (textual description, perhaps activity diagrams and sequence diagrams).
![]() The commercial product risk: RB (to what extent are sales/acceptance of the application system put at risk in case of nonfulfillment of the function) can, for instance, be determined by consulting commercial experts.
The commercial product risk: RB (to what extent are sales/acceptance of the application system put at risk in case of nonfulfillment of the function) can, for instance, be determined by consulting commercial experts.
The assignment of concrete values is a result of experiences made in earlier projects and based on current metrics (chapter 11). Three values—“low,” “medium,” and “high”—are usually enough to be able to quantify the individual factors that, incidentally, are not independent of each other (see, e.g., [Lyu 96]). Mapping these three values onto the natural numbers 1, 2, and 3, each function F is assigned one risk factor R(F):
R(F) = (RT + RB + Rp) / 3 + F × RB+ C × RT
9.4.2 Risk Occurrence Indicators
It is important to assign each identified risk to indicators that will signal its imminent occurrence. To keep the structure simple and concise, indicators for individual risks of a risk category may be condensed to one indicator for the entire category. They form, as it were, the data material for the control panel allowing the risk manager to evaluate, control, and prevent the risks.
State occurrence indicators for each risk!
Each indicator is accompanied by one or more metrics, a calculation specification for the overall value out of the individual metrics, and a threshold value (trigger or alarm level), based on which measures for risk mitigation or risk prevention must be initiated.
Whereas the data underlying the metrics will still be sketchy at project start and will not be sufficient to allow accurate occurrence predictions, the data material will become increasingly more comprehensive and accurate in the course of the project’s life cycle. “False alarms” will decrease with the project progressing. Concrete metrics on this issue can be found in chapters 5 and 11.
Example: Occurrence indicators for risks in the VSR project
To monitor the risks identified in the VSR project, the test manager adds occurrence indicators and possible metrics to the risk list:
R1: chief tester drops out:
Bad tempered; too much overtime per week; frequent short-term sick notes per month
R2: delays in development:
Delayed milestones; low defect correction percentage; e-mails are not answered; too many overtime hours; frequent sick leave
R3: overly optimistic test planning:
Defect rate too high shortly before test completion date; too many overtime hours; many blocked tests
R4: insufficient entry quality of the test object:
Entry tests fail; initial defect rates are very high
R5: 64-bit version of the test tools available too late or not at all:
No preliminary version available; manufacturer postpones/does not set a delivery date
K6: poor quality of the test basis:
Frequent document changes; many incidents reported in reviews
R7: loss of the configuration management database:
Increasing response times despite constant data volume; nonrepeatable database error messages; frequent recoveries
9.4.3 Risk Inventory
All the findings gained during risk analysis (risk identification and risk evaluation) are entered into the →risk inventory (risk profile), arranged by their financial consequences and their occurrence probability.
Risks are chronologically recorded and listed in the inventory in a condensed and clearly structured way and can be illustrated by a risk diagram (figure 9-2) or a risk matrix (figure 9-3) to give decision makers an overview about the risk situation and particularly about their significance for the project.
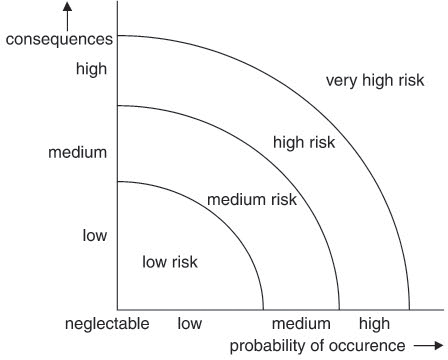
Depending on the actual value of the occurrence indicators, risks can be color- and size-coded and may, for instance, be shown as circles. Green and small, for instance, may indicate low indicator values; yellow and medium may indicate that the indicator value is below the threshold value; red and large may mean that the indicator value is equal to or above the threshold value.
The results of a risk analysis must also indicate the degree of uncertainty that accompanied the risk evaluation. Besides quantitative indicators, for example in the area 0% (absolutely uncertain) to 100% (absolutely certain), we may also classify by categories such as “very uncertain,” “uncertain,” “medium,” “certain,” and “very certain.”
Risk estimations are repeated periodically. The progression of the estimations and indicator values of the different risks or risk categories must be captured in the risk inventory.
If, in the course of time, we observe increasing values, the planned measures have to be initiated (see section 9.5).
Example: risk inventory in the VSR project
The VSR test manager has entered the most important risks in the following risk matrix.

The occurrence indicators of risks R1 and R7 are far away from their threshold values, those of risks R3 to R6 are only just below the threshold values, and the occurrence of risk R2 is imminent (indicator values already above the threshold value).
9.5 Risk Control and Treatment
→Risk control and treatment plays a key role in risk management. It comprises all measures that are taken in response to identified and analyzed risks.
Possible responses to perceived risks can be as follows:
Response to perceived risks
![]() Unconditional acceptance of the risk, which means doing absolutely nothing at all and waiting to see if the problem occurs or not
Unconditional acceptance of the risk, which means doing absolutely nothing at all and waiting to see if the problem occurs or not
![]() Risk mitigation, which means lowering the risk potential; e.g., through outsourcing of specific corporate functions or by establishing appropriate emergency plans
Risk mitigation, which means lowering the risk potential; e.g., through outsourcing of specific corporate functions or by establishing appropriate emergency plans
![]() Mitigation of damages through corrective compensatory measures prior to problem occurrence; e.g., by taking out liability insurance or including a nonliability clause in the license contracts
Mitigation of damages through corrective compensatory measures prior to problem occurrence; e.g., by taking out liability insurance or including a nonliability clause in the license contracts
![]() Total risk avoidance; e.g., through discontinuance of the project in order to completely avoid any associated risks.
Total risk avoidance; e.g., through discontinuance of the project in order to completely avoid any associated risks.
The choice of a suitable response to a risk depends on the benefits associated with its removal or mitigation and the cost of the risk reducing measures.
In particular, technical and organizational measures that can be taken to reduce risks ought to be considered here. Among these are workplace ergonomics; protection of the infrastructure (e.g., smoke detectors, air-conditioned server rooms, and uninterruptible power supply); protection against procurement, development, sales and liability risks; protection against embezzlement, betrayal of confidence, fraud by staff, and not to be forgotten, computer abuse and industrial espionage.
We also need to think of how to prevent burglary, theft, and vandalism, for example through the installation of appropriate alarm systems, contracting of a plant security service, or conclusion of a transport insurance policy.
The current status of the project’s risks needs to be published regularly, for example in a risk list as shown in figure 9-4, taking into account all relevant information. We must also bear in mind that risk control and solution can itself create new risks. These also need to be taken into account.
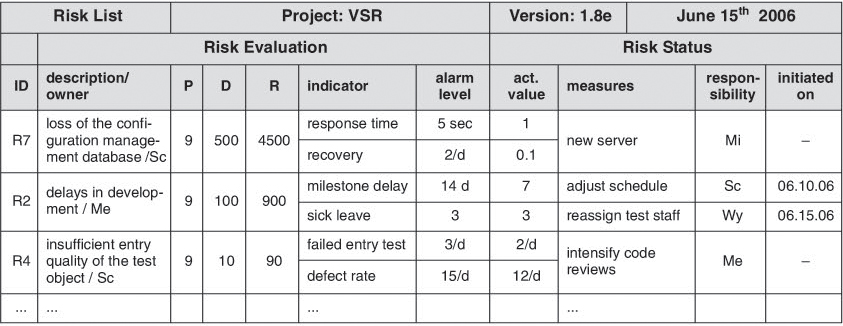
Risk list Risk review in the VSR project
The risk list in figure 9-4 tells the VSR test manager that the current R4 occurrence indicator values (insufficient entry quality of the test object) are getting alarmingly close to their threshold levels (2 resp. 12 per day vs. 3 resp. 15 per day). In order to mitigate the risk, permitted value specifications of the complexity metrics are tightened, the complete source code is scanned with a static analyzer, and code reviews are carried out for all software modules with a cyclomatic complexity greater than 8.
![]() If risk identification and analysis is not or only insufficiently performed, a large part of the overall risk may hide in the pseudo category “non-identifiable risks,” thus preventing proper and effective risk control and solution.
If risk identification and analysis is not or only insufficiently performed, a large part of the overall risk may hide in the pseudo category “non-identifiable risks,” thus preventing proper and effective risk control and solution.
![]() It is also important to plan measures and contingency plans in preparation for unexpected risks.
It is also important to plan measures and contingency plans in preparation for unexpected risks.
9.6 Risk Review and Risk Monitoring
During risk review and monitoring, new risks are perceived and measures are taken to ensure that risk control and treatment remains effective. Attention needs to be paid during risk reviews throughout the project’s lifetime to keeping relevant documents, standards, techniques, and action lists up-to-date and maintained. Risk monitoring shall be performed during the whole of the project’s duration and shall include the review of the project budget, the project plans, and additional project information.
More elaborate monitoring activities can be performed at the project’s milestones or if there are considerable changes to the project environment.
Example: Risk control and solution in the VSR project
The VSR test manager checks the risk list (figure 9-4) and notices that the R2 (delay in development) mitigation measure “temporary reassignment of testers to the development department” increases the occurrence probability of all the risks in risk category “poor product quality.”
This means that part of the risk is passed on to the user because of nonliability and warranty rules stipulated in the general terms and conditions or in the licensing agreement. Because of the high product liability risks and in order to avoid the risk, the decision is made not to launch the product in the U.S. Another alternative is to conclude an insurance policy against liability damages and regression claims.
An early start of risk management works like a “safety net” for the project. Furthermore, the findings form an essential basis for the creation of the test plan and for the prioritization of the specified test cases applied to reduce the product risks. Both aspects are discussed in the following section.
9.7 Risk-Oriented Test Plan Creation and Test Prioritization
A complete test means that the system is installed in all possible environments, operating systems, parameter constellations, etc. and that in each case tests are performed that completely cover all possible input/output constellations and system internal states. Even for very small software systems, this would mean that we would have to conduct an astronomically large number of combinations or test cases (test case explosion). It is one of the tasks of test management to keep the test effort in reasonable proportion to the achievable results. [Pol 02] states, “The test strategy is directed toward finding the optimal balance between the test effort to be exerted and the coverage required for the risks ... Testing should continue for as long as the costs for finding and correcting defects during testing are lower than the costs connected to the defect occurring in production.”
Even without a precise quantitative identification of the optimal relationship between test costs and test benefit, test managers should keep this general principle in mind at all times and use it subjectively in their decision making.
In this context, the results of risk management can be used to perform risk-oriented testing, comprising:
![]() Target-oriented testing: applying appropriately different test techniques and test intensities to cover system functions with different risks
Target-oriented testing: applying appropriately different test techniques and test intensities to cover system functions with different risks
![]() Prioritized testing: giving areas with higher risks higher priority and testing them earlier
Prioritized testing: giving areas with higher risks higher priority and testing them earlier
![]() Residual risk awareness: identifying the residual risks that remain in the delivered software and are due to reductions in test or nonperformance of planned tests
Residual risk awareness: identifying the residual risks that remain in the delivered software and are due to reductions in test or nonperformance of planned tests
Test managers use their knowledge of risks to define a suitable test plan, using the nature of the risk to determine suitable test techniques. This way, product risks associated with the user interface of a software product may be mitigated by performing intensive usability tests. Incorrect storage of a complex computer game may pose a very high risk to the manufacturer (although it does not cause him direct costs) because the faulty game will not be appreciated by the customers. This may possibly cause large losses in sales, affecting perhaps all the other games of that manufacturer.
Target-oriented test plan creation
Project risks, too, can be addressed in the test plan, for instance by starting test activities early enough or subjecting code written by inexperienced programmers to reviews.
Since, as a rule, the test budget is limited, test cases are usually prioritized (see, e.g., [Amland 99], [Schaefer 96]). If we succeed in associating tests or test cases with particular risks, the prioritization of the risks also implies a prioritization of the tests: tests covering a large risk are then executed earlier.
Risk-based test prioritization
A simple tabular technique for risk-based test prioritization is described in [Schaefer 96]. First, some general risk factors are defined. For example, the three factors ri, i=1..3 may delineate product risks (i.e., they determine the impact of the risks) and the three factors fi, i=1..3 delineate the test risks (i.e., the probability with which failures can be expected in the product). In addition, each risk factor is assigned a weight, g(ri) or g(fi), i=1..3.
The test manager then focuses his attention on individual risk aspects, such as, for instance, particular functions or nonfunctional requirements like performance or usability.
Each risk aspect t and each of the above mentioned general risk factors ri or fi has a value ri(t) or fi(t) assigned to it. In the end, one factor I(t) for each test aspect evaluates the quality of the current test strategy; i.e., the effectiveness of the current test plan with regard to this particular risk aspect.
[Schaefer 96] recommends the use of only three values for the weights g(pi) and g(fi), and for the quality factor I(t), namely 1 (small), 3 (medium) and 10 (high). For the risk factors ri(f) and fi(t), values are to be defined ranging from 1 (very low) to 5 (very high).
The priority P(t) of a test aspect t is then calculated as
P(t)=[(Σi=1..3 ri(t) × g(ri)) × (Σi=1..3 fi(t) × g(fi))] / I(t)
Figure 9–5 Schaefer’s test prioritization
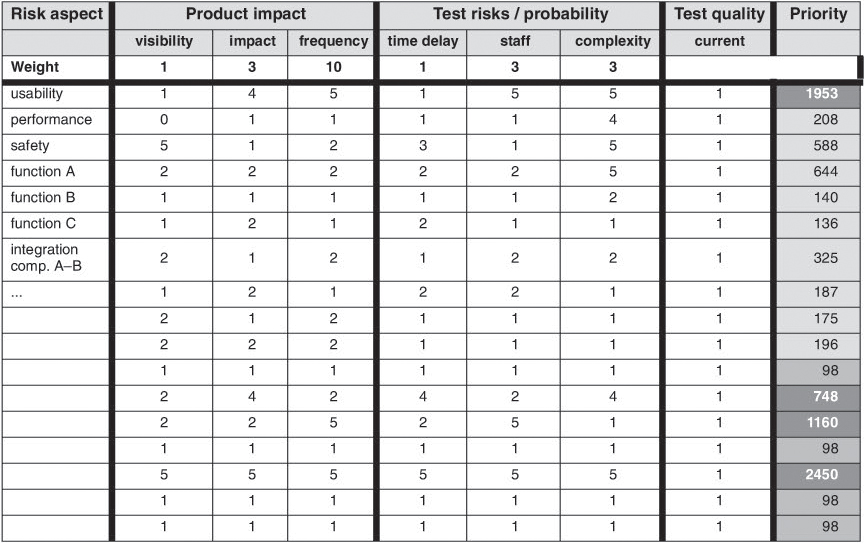
Test aspects and corresponding test cases are subsequently prioritized using a spreadsheet as illustrated in figure 9-5.
A purely risk-based assignment of test resources may lead to an absence of coverage of low-priority test risks if the project runs out of budget or time. This issue can be addressed in two ways.
First, the intensity of the tests to be performed can be derived from the degree of risk. Most safety standards, such as [DO 178 B] or [EN 50128] (see chapter 13) use this approach and prescribe for each safety level the test procedures to be used as well as adequate test exit criteria.
Defining the test intensity
For components belonging to the highest safety level, for instance, 100% branch coverage is frequently required. One method to define test intensity is described in [Gutjahr 95].
This method assigns an execution probability p, a failure probability f, and a defect-costs factor c to each function and uses this approach to determine the number of executable tests (see figure 9-6).
Figure 9–6 Gutjahr’s test intensity
Second, risks that are poorly covered by tests or not covered at all are known as a result of the correlation made between test cases and risks. Against this background, the test manager or the steering committee must decide whether or not the software product is ready for release and whether the residual risk can be accepted.
Estimation of residual risks
Thus, testing can be used to mitigate risks since the detection of defects in the product and their removal is a considerable contribution toward risk reduction. Project risks, too, are reduced by the application of a suitable test plan—for instance by detecting defects in interim products with an early test case well before they can affect later software development activities. In addition, the test will show the current risk status because in certain areas of the software product, high or low defect rates can be used to improve the quality of the risk analysis.
Tests inform about the risk evaluation.
Finally, risk management and risk-oriented testing are permanent processes spanning the entire life cycle of a project. Test results may be used as input for risk management and may lead to a reevaluation of risks. Levels of uncertainty can be reappraised and may require a redistribution of the remaining test budget.
9.8 Further Possibilities
This section introduces two further possibilities for risk based testing: the Failure Modes and Effect Analysis (FMEA) and risk-based precision testing.
9.8.1 Failure Modes and Effect Analysis (FMEA)
→FMEA is a method used to identify potential error types and their effect on a system and to classify the error types with regard to their criticality or persistency (see [IEC 60812]). Defects are to be prevented and possible weaknesses, for instance in design, are to be detected as they might pose a danger to the system or the user of the system during operation.
Furthermore, the FMEA is supposed to provide results for corrective design activities and help in the definition of test cases. The FMEA can, in the end, be used to show operational problems and usage constraints of the system or software.
FMEA uses the following means of representation (examples):
![]() Sequence descriptions of critical functions
Sequence descriptions of critical functions
![]() Functional and reliability block diagrams
Functional and reliability block diagrams
![]() Error trees
Error trees
![]() Error classification lists
Error classification lists
![]() List of critical functions and modules
List of critical functions and modules
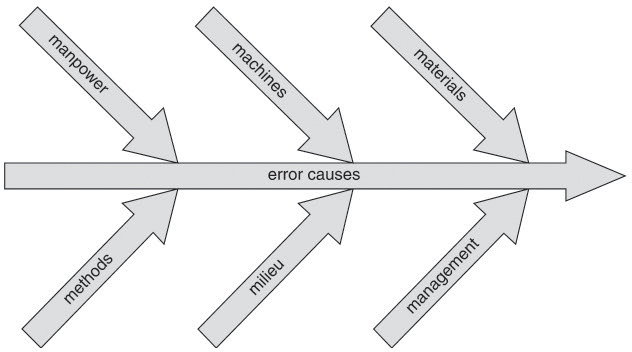
The basic principle is to look at the functional hierarchy and the programming logic (in case of software) and systematically (functionally and chronologically) ask, “What happens when?” using defined success or failure criteria. This analysis and evaluation is to be done for all operating phases and operating possibilities. In this connection, the “6 Ms” illustrated in figure 9-7 are of help, as each of the Ms is covered by one or several queries relating to possible failure or error causes.
What happens when?
Figure 9–7 The “6 Ms” definition
Using FMEA in risk evaluation, the procedure is as follows:
1. Generate a list of all the risk factors.
2. Specify the type and probability of failures for each factor.
3. Investigate the effects of failures on other factors, applying, e.g., simulations.
4. Investigate the effects on project planning.
5. Identify possibilities for detecting the failure.
6. Identify possibilities for compensating the failure.
7. Identify possibilities for preventing the failure.
8. Define measures to avoid defects.
9. Evaluate the effect of the proposed measures.
10. Document the results.
Similar to risk evaluation discussed in section 9.4.1, risks are quantified according to their probability of occurrence O and expected damage E. In the FMEA, we optionally have the additional analysis of the probability of detection D; i.e., the quantitative evaluation of the quality of the identified risk occurrence indicators. From a risk perspective, the probability of detection is reciprocally evaluated; i.e., a high evaluation of D signifies a lower probability of risk occurrence (in particular, of a defect) prior to the delivery of the (interim) product. Using these three factors, the →risk priority number RPN is calculated as
FMEA defines the risk priority number (RPN).
RPN = O × E × D
The FMEA is used for prospective and retrospective risk analysis. Prospective risk analysis is a continuous process focusing on the current situation regarding deadlines, staffing, and resources in order to detect and resolve problems early, whereas retrospective risk analysis analyzes past problems in order to extract information that will help to avoid similar problems in the future.
FMEA only in case of stringent reliability and safety requirements
As regards risk analysis, the use of the FMEA is limited to projects with highly restrictive safety specifications or stringent requirements regarding system reliability; a general application of the FMEA, however, does not appear adequate considering the effort to be invested and its possible results.
9.8.2 Risk-Based Test Effort Optimization
One of the fundamental problems facing the test manager can best be described by the question: How can more tasks be accomplished with less resources? Risk-based test effort optimization (see Precision Testing, [Schettler 06]), which goes beyond pure test prioritization (compare with section 9.7), can provide a possible answer to this question.
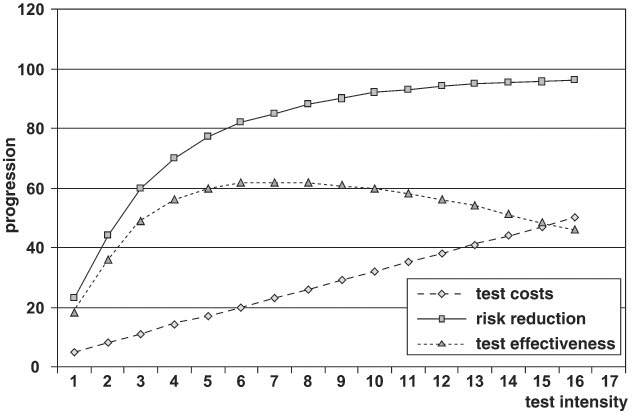
The basic assumption is that risk reduction through testing is limited and that test effectiveness decreases with increasing effort. Figure 9-8 illustrates this under the assumption that the test effort remains constant over a specified period of time (compare with [Sherer 91]).
The basis of precision testing is a frame model describing the cost and benefit parameters (and their interdependencies) relevant in test management and quality assurance. Figure 9-9 ([Schettler 06]) provides an overview.
Figure 9–9 Frame model for precision testing
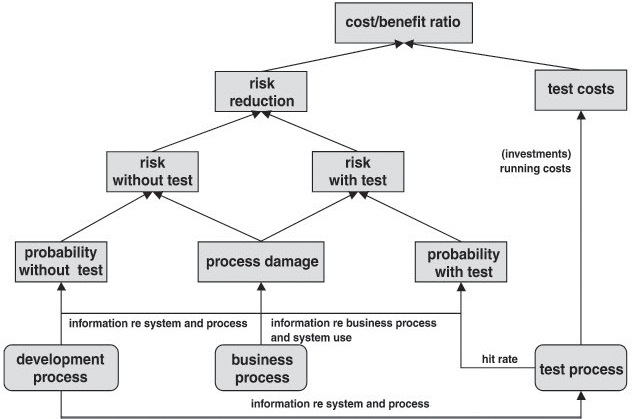
If a certain budget is to accomplish the least possible residual risk, the test plan must be optimized with regard to risk reduction. The test cost/benefit ratio is one of the central planning factors: The benefit is defined as the risk reduction achieved through testing (and defect correction) and calculated as the difference between the risk resulting from untested software and the forecasted residual risks after testing. If it turns out that the risk can be tolerated even without testing, further testing against that risk is not necessary.
Relative to risk quantification, the risk without test arises from the probability with which a function may behave abnormally and from the amount of damage for the business process that may result from the failure.
The prediction of the residual risk (after testing) is based on the probability with which failures will occur despite tests. It is a result of the probability with which certain failures or defects are detected with the test techniques applied. As a rule, residual risk is initially estimated by test experts and then adjusted on the basis of experience data.
In the end, the cost of testing is for the most part determined by the defined test procedure and the system’s functional scope.
Figure 9-10 illustrates the operative procedure during planning in Precision Testing ([Schettler 06]). The result is a test plan that defines for each function one out of several possible test design techniques for test execution.
Figure 9–10 Test planning with precision testing
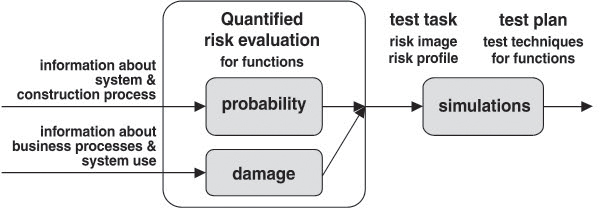
As a first step, the risk for each system function is evaluated, querying quantitative, basic indicators representative of the risk and evaluating them to a relative risk index. The work split into probability and damage evaluation matches the work split in software development quite well. Probability indicators deal with the construction process, whereas damage indicators deal with the affected business process. In practice, probability evaluation is typically done by evaluating function specifications or requirements specifications, whereas damage evaluation can be done by means of expert interviews or questionnaires and the possible support of statistical data.
Simulation of test scenarios based on the evaluations provide the projections of the test benefit and test effort parameters, which can now be assessed based on the targets and the optimization and test scope specifications. Test planning ends with the selection of the optimal test scenario. This is followed by schedule and resource disposition, whereby the risk image also supports the prioritization of the test activities. It is relatively easy to react to schedule or budget changes during the project’s lifetime by simply resuming the test scenario simulations.
9.9 Summary
![]() A risk is a problem that may arise in the future and may have negative consequences. Its severity is made up of the probability of its occurrence and its associated damage. Risks may be divided into product and project risks.
A risk is a problem that may arise in the future and may have negative consequences. Its severity is made up of the probability of its occurrence and its associated damage. Risks may be divided into product and project risks.
![]() Some of the core activities of risk management are risk identification, accurate risk analysis including specification of risk occurrence indicators, the definition of suitable measures for risk avoidance, risk control and solution, and the monitoring of risk management activities themselves. Risks can be evaluated qualitatively and quantitatively.
Some of the core activities of risk management are risk identification, accurate risk analysis including specification of risk occurrence indicators, the definition of suitable measures for risk avoidance, risk control and solution, and the monitoring of risk management activities themselves. Risks can be evaluated qualitatively and quantitatively.
![]() Testing is a preventive measure, reducing risks through the detection and removal of defects. Risk-oriented testing uses the knowledge about risks to define the content of the test plan in such a way that under the given circumstances, risks (effort, schedule, availability) can be minimized as quickly as possible. Moreover, testing can yield information about the risk evaluation itself. High or low defect rates in certain areas of the software product may be used to improve the quality of the risk analysis.
Testing is a preventive measure, reducing risks through the detection and removal of defects. Risk-oriented testing uses the knowledge about risks to define the content of the test plan in such a way that under the given circumstances, risks (effort, schedule, availability) can be minimized as quickly as possible. Moreover, testing can yield information about the risk evaluation itself. High or low defect rates in certain areas of the software product may be used to improve the quality of the risk analysis.
![]() Based on the most important risks, suitable test techniques are to be selected, and tests are to prioritized to allow tests covering high risks to be executed early and with the appropriate effort.
Based on the most important risks, suitable test techniques are to be selected, and tests are to prioritized to allow tests covering high risks to be executed early and with the appropriate effort.
![]() Prioritization and risk estimation criteria, as defined during risk analysis and in the test plan, can be applied to test objects during test object definition and to test cases during test case design. The intensity of the test to be executed is to be derived from the degree and type of the involved risk.
Prioritization and risk estimation criteria, as defined during risk analysis and in the test plan, can be applied to test objects during test object definition and to test cases during test case design. The intensity of the test to be executed is to be derived from the degree and type of the involved risk.