
8 Deviation Management
The added value of testing lies mainly in the detection and reporting of a system’s deviations from its requirements. To be able to correct a deviation, development requires as much detailed information as possible about symptoms, reproduction, and consequences of abnormal system behavior. The test process must therefore place particular focus on accurate documentation and tracking of deviations. Part of this process is a risk estimation of the consequences of defects remaining in the system. This chapter explains the requirements of the documentation as well as categorization techniques and the prioritization and status tracking of deviations.
8.1 Terminology
Generally speaking, all software contains defects. A defect is a widely used synonym for a software system’s deviation or divergence of actual from expected behavior. However, it is advisable to establish a more accurate distinction between the different stages in the development chain of deviations (see also [Spillner 07]):
![]() An error is an erroneous act of a person or group causing a defect in the system.
An error is an erroneous act of a person or group causing a defect in the system.
Error, defect, failure
![]() A defect is a fault in the system that, with a certain probability, will lead to a failure.
A defect is a fault in the system that, with a certain probability, will lead to a failure.
![]() A failure is the visible deviation of a system’s operational behavior from the requirement specifications.
A failure is the visible deviation of a system’s operational behavior from the requirement specifications.
According to these definitions, testers do not detect defects, they find failures. Finding out which defect caused a particular observed failure must be considered a separate and subsequent activity in which test and development must cooperate. In this context, people typically speak of debugging.
Different failures may well be traced back to the same defect, while it is also possible that defects may remain in the system and not lead to a failure.
Consistent treatment of defects and change proposals
“It’s not a bug—it’s a feature.” Probably every programmer and tester knows this phrase expressing the differences of opinion that may well exist between development, test, and users as to whether or not a particular system behavior is to be seen as a failure, a tester’s wrong interpretation of the requirement documents, or an (justified or unjustified) enhancement or change request. A neutral, generic term for all these types is the term “deviation” (of a system’s behavior from the user’s or tester’s expectations; common synonyms are “anomaly”, “incident”).
Document deviations in testware, too.
Incident reports are mostly based on differences between the specification of a particular test case’s expected result and the actual behavior of the tested system. The reasons for such differences can lie in abnormal system behavior but also in an inaccurate test case specification. The correct answer often becomes clear only during the ensuing resolution activities. Many projects use a common management system to deal with incident reports written against the tested system and incident reports written against the testware; i.e. test plan, test specifications, and test automation.
8.2 Documenting Incidents
The people who detect anomalies are normally not the same as those who analyze and correct them (see section 8.3.1). Because of this situation, detected anomalies require careful documentation and clear communication.
First, when communicating an incident report it makes no real difference whether it is documented and communicated via email, spreadsheet, or a specialized database (deviation management system). However, in order to support efficient treatment, the documentation of an incident must meet certain requirements independent of the medium used:
![]() The description of the incident must allow simple and accurate reproduction of the failure:
The description of the incident must allow simple and accurate reproduction of the failure:
Incident documentation requirements
• The test run and required input parameters are to be succinctly described so that the test run can be reproduced. Ideally, the incident report refers directly to a test case specification and/or an automated test procedure based on which development can reproduce the failure.
• The report shall address only one single, clearly defined problem and not a combination of several anomalies.
• The environment in which the test was executed must be clearly documented—for example, the version of the test object, platform, tested component, necessary reference data, etc.
![]() It must be possible to prioritize a number of anomalies relative to each other in order to resolve them according to their assigned priority. To do so, the presumed failure potential must be evaluated from different perspectives, such as, for instance, from both the end user’s and the tester’s point of view.
It must be possible to prioritize a number of anomalies relative to each other in order to resolve them according to their assigned priority. To do so, the presumed failure potential must be evaluated from different perspectives, such as, for instance, from both the end user’s and the tester’s point of view.
![]() Since typically more than one person is involved in the resolution of an incident, efficient control must be supported. This can be done by assigning a unique status to the report and by assigning people responsible for debugging, defect resolution, and retesting (see section 8.3).
Since typically more than one person is involved in the resolution of an incident, efficient control must be supported. This can be done by assigning a unique status to the report and by assigning people responsible for debugging, defect resolution, and retesting (see section 8.3).
![]() Date and time the incident was detected is documented. For one thing, time may well be a relevant aspect regarding the cause of a failure; on the other hand, it allows some helpful analyses based on the total number of reported failures.
Date and time the incident was detected is documented. For one thing, time may well be a relevant aspect regarding the cause of a failure; on the other hand, it allows some helpful analyses based on the total number of reported failures.
These requirements necessitate the use of a fixed format for communicating anomalies. Depending on the reporting method used, this may be in form of an e-mail, document template, or database scheme. Completing his report, the author must take sufficient care; he can do this best by putting himself into the position of those who have to read and evaluate his report later on.
Some basic rules regarding incident reports
It should not be forgotten that each incident report carries a certain political and emotional potential as in most cases it (implicitly) criticizes someone else’s work (namely, that of the affected software developer).
Dogmatism, malice, and displaced humor are inappropriate. Chapter 10 provides further advice on how appropriate forms of communication can help to avoid unnecessary disputes or putting up mental barriers.
Table 8-1 illustrates an incident report template that, due to its different attributes, satisfies the above mentioned requirements (see also [Spillner 07], section 6.6.2).
Table 8–1 Sample reporting template
Identification |
|
Number |
Incremental, unique number of report |
Test object |
Identifier of the test object (system or impacted component or components) |
Version |
Exact version identifier (tested build) of the test object |
Platform |
Identification of the hardware/software platform or test environment where the problem occurred |
Reporting person ID |
Unique identification of the person who detected the incident |
Responsible corrector ID (developer) |
Unique identification of the person responsible for correcting the defect |
Date of occurrence |
Date and time the incident was first observed |
Classification1 |
|
Status |
Current processing status of the report2, possibly historical Information allowing tracking of status changes with corresponding change dates |
Class |
Severity (e.g., crash, malfunction, deficiency, nice to have, change request) |
Priority |
Urgency of defect removal |
Requirement(s) |
Reference(s) to the requirement(s) violated or not fulfilled by the incident |
Source |
Phase of assumed defect injection: coding, documentation, design, etc. |
Problem description |
|
Test case |
Test case reference (identification) or direct description of the steps necessary for the reproduction of the failure |
Problem/symptom |
Accurate description of the incident stating the differences between target and actual behavior |
Comments |
Comments by involved staff on the report; possibly historical information |
Correction |
Details concerning correction measures |
References |
References to other, related incident reports; if required, additional references to background information, etc. |
1. For a more detailed classification scheme, see section 8.4.
2. See section 8.3.2.
8.3 Incident Handling
In principle, each incident goes through the following life cycle: the anomaly is detected, documented, analyzed and corrected. Alternatively, the incident report is discarded or rejected because it is thought to be unsubstantiated.
The incident life cycle
Different people with different roles participate in the correction process. In order to coordinate these roles and to ensure orderly communication, it is necessary to define a deviation management process.
The most important components of such a management process are a suitable incident status model, an adequate workflow for the execution of status changes, and a definition of the roles and responsibilities pertaining to incidents within the status model.
8.3.1 Roles and Balance of Interests in Deviation Management
The following roles and functions contribute to incident resolution. These roles have partly overlapping and partly contradictory interests in the resolution of incidents:
![]() The tester reports incidents, documenting them following a well-defined pattern of input data necessary for analysis and management. He performs retesting after defect correction.
The tester reports incidents, documenting them following a well-defined pattern of input data necessary for analysis and management. He performs retesting after defect correction.
Interests of tester and test manager
![]() The test manager leads the test group and organizes the deviation management, tracking the incident occurrence and the correction measures and using this as a basis for the planning and control of his test activities.
The test manager leads the test group and organizes the deviation management, tracking the incident occurrence and the correction measures and using this as a basis for the planning and control of his test activities.
Both tester and test manager are interested in quick defect resolution, particularly of those potential “showstoppers” that might jeopardize or even stop the test activities altogether.
![]() The developer analyzes the incident reports, perhaps jointly with the tester, and resolves defects. (Since the cause of a defect does not always lie in the system’s implementation phase but can also lie in the requirements or design phases, the term developer applies to programmers, designers, and requirements specifiers / requirements modelers.) The developer also implements approved change requests.
The developer analyzes the incident reports, perhaps jointly with the tester, and resolves defects. (Since the cause of a defect does not always lie in the system’s implementation phase but can also lie in the requirements or design phases, the term developer applies to programmers, designers, and requirements specifiers / requirements modelers.) The developer also implements approved change requests.
Interests of developers and development leader
![]() The development leader is in charge of the development project and leads the development team; he is also responsible for the success of the defect resolution process. He estimates and is accountable for the effort required to perform the necessary resolution activities.
The development leader is in charge of the development project and leads the development team; he is also responsible for the success of the defect resolution process. He estimates and is accountable for the effort required to perform the necessary resolution activities.
In order to reduce the stack, developers and the development leader are interested in correcting failures first whose resolution requires the least effort.
![]() The product manager is responsible for product developed in the project. He approves change requests and is responsible for the prioritization of the correction activities.
The product manager is responsible for product developed in the project. He approves change requests and is responsible for the prioritization of the correction activities.
It is in the product manager’s interest to achieve the highest possible customer satisfaction with the least possible cost. For this reason, it may be that in some cases change requests are given priority over defect resolution.
![]() In some project situations, especially where individual software is being developed, the customer may be closely involved in the development process, evaluating new incidents with regard to their relevance for the operational use of the system. He may even report incidents himself that in many cases turn out to be change requests.
In some project situations, especially where individual software is being developed, the customer may be closely involved in the development process, evaluating new incidents with regard to their relevance for the operational use of the system. He may even report incidents himself that in many cases turn out to be change requests.
The interests of the customer
The customer expects a high-quality product, i.e., one that shows as little behavioral deviation from the expected quality profile as possible.
In order to balance these different and partly contradictory interests, the following board is established in a deviation management process:
![]() The Change Control Board (CCB) regularly tracks the progress of deviation detection and resolution and decides on prioritization of defect resolution and change requests. Typically, this body is made up of the development leader, the test manager, and the product manager. The (sub)project leader, customer representative, or end user may also be part of it.
The Change Control Board (CCB) regularly tracks the progress of deviation detection and resolution and decides on prioritization of defect resolution and change requests. Typically, this body is made up of the development leader, the test manager, and the product manager. The (sub)project leader, customer representative, or end user may also be part of it.
Change Control Board
The better and more qualified the information is on reported incidents, the easier the task is for the CCB. [IEEE 1044] (section 8.4) provides a lot of classifiable information. How information is used in concrete projects is up to the organization. The test manager in charge or the CCB must make a reasonable decision.
It also makes sense to introduce suitable defect metrics to be able to support CCB decisions with quantitative data. Chapter 11 provides some examples.
8.3.2 Generic Deviation Management Process
Figure 8-1 ([Spillner 07, section 6.6.4]) shows a model including incident statuses, events that lead to status changes, and the roles allowed to perform status changes:
Figure 8–1 Incident status model
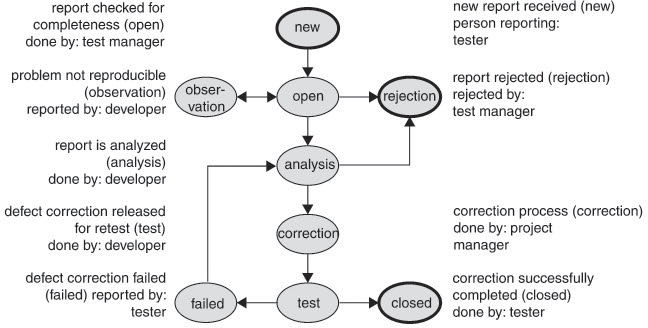
The status model needs to be adjusted to satisfy organizational requirements, for instance by introducing the following:
![]() A different number of final states—e.g., rejected, deferred to next “minor” release, deferred to next “major” release, deferred to release xy
A different number of final states—e.g., rejected, deferred to next “minor” release, deferred to next “major” release, deferred to release xy
![]() A different number of “analyses states”, which help development show different workflow phases from reception up to the provision of a correction
A different number of “analyses states”, which help development show different workflow phases from reception up to the provision of a correction
![]() Different roles and customized rights for individual roles—for instance, additional rights for the test manager to change the report status to “closed”
Different roles and customized rights for individual roles—for instance, additional rights for the test manager to change the report status to “closed”
![]() The transfer of activities of individual roles to the CCB, together with rules stating criteria based on which the CCB can make decisions regarding status changes
The transfer of activities of individual roles to the CCB, together with rules stating criteria based on which the CCB can make decisions regarding status changes
Example of an incident report with history data
Table 8.2 illustrates an incident report from VSR system test. Based on data recorded in the standard incident report template (see section 8.2), developers and tester process the report, documenting the different processing steps:
Table 8–2 Sample incident report
Identification |
||||
Number |
VSR-Systest 03347 |
|||
Test object |
VSR Component DreamCar |
|||
Version |
Build 02.013–04.27.2006 |
|||
Platform |
Windows XP–Standard-Client-Configuration |
|||
Reporting person |
G. Myers |
|||
Responsible corrector (Developer) |
K. Beck |
|||
Date of occurrence/reporting |
04.30.2006 10:17 |
|||
Classification |
||||
Status |
Status |
Date |
Set by |
Comment |
closed |
05.14.2006 |
G. Myers |
successful re-test |
|
test |
05.12.2006 |
K. Beck |
Recorrected check |
|
failure |
05.06.2006 |
G. Myers |
Discount = 100% still possible |
|
test |
05.04.2006 |
K. Beck |
Checking function corrected |
|
correction |
05.03.2006 |
K. Beck |
Correction in callback function |
|
analysis |
05.02.2006 |
K. Beck |
source code review |
|
analysis |
04.30.2006 |
CCB |
class 3->2 |
|
new |
04.30.2006 |
G. Myers |
|
|
Class |
2 (critical malfunction) |
|||
Priority |
2 (correction prior to release) |
|||
Requirements |
CC-Sys-CalcPrice-01/037 rebates |
|||
Source |
Validation procedures for rebates entry |
|||
Problem description |
||||
Test case |
TC-Price Calculation/0313 rebated purchase price |
|||
Problem / symptom |
Irrespective of the selected model, special edition, and accessories, it is possible to enter a discount of ≥ 100%. As a result, a negative purchase price is displayed. |
|||
Comments |
CCB, 04.30.2006: high classification as wrong calculation will leave an extremely bad impression with the customer |
|||
8.3.3 Using Deviation Management Tools
Reporting template, storage, and management process are best implemented in form of a database—i.e., a so-called deviation management system (or a deviation or defect database1)—to obtain additional efficiency gains and benefits over simple “pen to paper” or spreadsheet solutions:
Deviation management systems
![]() Users and user-assigned roles can be granted defined read and write access rights to ensure observance of the status model. Especially in chaotic projects, this will help control the workflow.
Users and user-assigned roles can be granted defined read and write access rights to ensure observance of the status model. Especially in chaotic projects, this will help control the workflow.
![]() In case of status changes, the system can automatically inform affected people (e.g., via e-mail). This way, for instance, the tester will be automatically informed if an incident that he reported earlier is up for retest, thus saving him effort and time because he does not have to look for it in the reporting list.
In case of status changes, the system can automatically inform affected people (e.g., via e-mail). This way, for instance, the tester will be automatically informed if an incident that he reported earlier is up for retest, thus saving him effort and time because he does not have to look for it in the reporting list.
![]() It is possible to connect the deviation management system to other tools used in the software development process via suitable interfaces, which will enable traceability and provide considerable process support:
It is possible to connect the deviation management system to other tools used in the software development process via suitable interfaces, which will enable traceability and provide considerable process support:
• An interface to a test management system (link between test cases and anomalies detected by them) will make typical test management tasks a lot easier for the test manager—for example, allowing him during retest planning to filter for all test cases linked to incidents that are reported closed.
• An interface to the configuration management system (linking deviations to changes in documents and source files that are necessary for the resolution of the problem) supports traceability during a development project’s consolidation phase. It may, for example, be required that in case of newly checked-in source code, the configuration management system must refer to a deviation addressed by the code changes.
• An interface to a requirements management system (relating deviations to requirements, often implemented by linking requirements to test cases in the test management system and linking the same test cases to deviations) allows a direct evaluation of the current product quality based on the requirements. The number of requirements in the system with status “untested,” “successfully tested,” or “tested with deviations” can thus be determined.
![]() Reporting and statistics functionality allow consolidation and visualization of data, facilitating the evaluation of product quality and the indication of risk and improvement potentials.
Reporting and statistics functionality allow consolidation and visualization of data, facilitating the evaluation of product quality and the indication of risk and improvement potentials.
Sample statistics and their application
The sample statistics in figures 8-2 and 8-3 are derived from the VSR system test deviation management system, showing the current state of the database at the end of the third system test cycle.
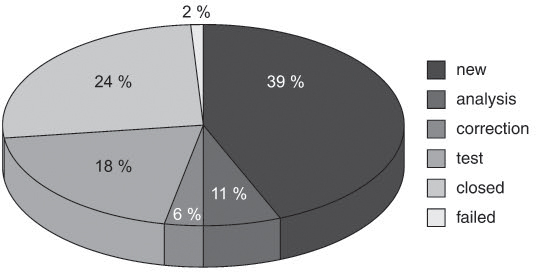
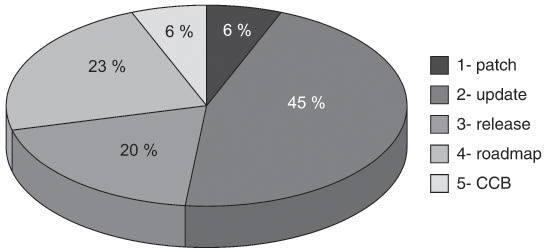
Figure 8–3 Reporting according to correction priority
Test manager and development leader discuss the statistics generated out of the deviation management system. Based on the above diagrams, in the final report of the third system test cycle, they make the following observations:
![]() The diagram relating to the status of the reports (see figure 8-2) shows that a large number of open reports have been newly recorded but not yet processed. The test manager voices his concern that this carries a high risk and asks the development leader why so many reports have been left unattended by the development team.
The diagram relating to the status of the reports (see figure 8-2) shows that a large number of open reports have been newly recorded but not yet processed. The test manager voices his concern that this carries a high risk and asks the development leader why so many reports have been left unattended by the development team.
![]() The development leader sees in the diagram on correction priority (see figure 8-3) that his team needs to cope with a large number of urgent defect correction activities. More than half of all reports must be processed prior to the next system test cycle (priorities 1 and 2) so testing won’t be jeopardized. This hardly leaves any room for the analysis of newly registered reports.
The development leader sees in the diagram on correction priority (see figure 8-3) that his team needs to cope with a large number of urgent defect correction activities. More than half of all reports must be processed prior to the next system test cycle (priorities 1 and 2) so testing won’t be jeopardized. This hardly leaves any room for the analysis of newly registered reports.
Both deliberate on how to improve the situation. The development leader could provide the team with some additional staff to remove the bottleneck but requires some more information on where to put them to be most efficient. To answer this question, the test manager creates another statistic, filtering the database for the newly created reports in the third test cycle and categorizing the reports according to the impacted VSR components (see figure 8-4).
Figure 8–4 Reporting according to impacted component
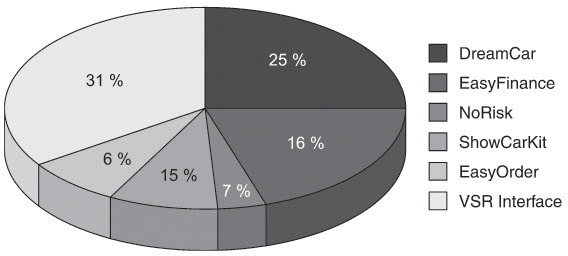
The evaluation by components indicates that the majority of the new defects are localized in the two components DreamCar and VSR interface.
![]() Consequently, the development leader decides to provide additional developers for the two components.
Consequently, the development leader decides to provide additional developers for the two components.
![]() The test manager, on the other hand, updates his test planning for the fourth system test cycle, intensifying testing of these two components following the rule of thumb “If you’ve already found lots of failures, expect to have missed a lot more”.
The test manager, on the other hand, updates his test planning for the fourth system test cycle, intensifying testing of these two components following the rule of thumb “If you’ve already found lots of failures, expect to have missed a lot more”.
As the example illustrates, a database-supported deviation management system is a very useful instrument for controlling a project. In order to establish such a system, a well-organized approach is needed that may well take a long time to realize (see chapter 12). In practice, we can see that with regard to deviation management, organizations often adopt an evolutionary improvement approach that goes hand in hand with other process improvement activities and has a sustained and positive impact on the efficiency of the test processes and on the achievable product quality:
Step by step from bits of paper toward a deviation management system
![]() People often start reporting incidents or anomalies rather informally via e-mail. There is no control over the content and over processing the report. As a result, analysis, prioritization, and retesting are time-consuming and inaccurate.
People often start reporting incidents or anomalies rather informally via e-mail. There is no control over the content and over processing the report. As a result, analysis, prioritization, and retesting are time-consuming and inaccurate.
![]() As a next step, most organizations introduce a reporting template for their e-mail system. A project agreement is drawn up saying that in the future, copies of new reports are to be sent to the project or (if there is one) test manager. This will considerably improve traceability. The project or test manager can start with prioritizing, ensure that reports get actioned, and gain an overview of project progress based on simple statistics.
As a next step, most organizations introduce a reporting template for their e-mail system. A project agreement is drawn up saying that in the future, copies of new reports are to be sent to the project or (if there is one) test manager. This will considerably improve traceability. The project or test manager can start with prioritizing, ensure that reports get actioned, and gain an overview of project progress based on simple statistics.
![]() In the course of these activities, most managers start organizing storage of the reports—for example, in a directory structure in the file system or in a central table in a spreadsheet program. The latter makes report-related information machine readable so that it can be analyzed or evaluated in the form of status reports and statistics. This is the preliminary stage to a proper deviation management system.
In the course of these activities, most managers start organizing storage of the reports—for example, in a directory structure in the file system or in a central table in a spreadsheet program. The latter makes report-related information machine readable so that it can be analyzed or evaluated in the form of status reports and statistics. This is the preliminary stage to a proper deviation management system.
![]() The last step in this process is transferring all the information held in tables into a proprietary or commercial database system. Actioning of reports is now controlled by the status and rights system incorporated in the deviation management system. Sophisticated reporting and statistics functions, in combination with interfaces to the requirements and configuration management systems, open up the way to develop even further potentials.
The last step in this process is transferring all the information held in tables into a proprietary or commercial database system. Actioning of reports is now controlled by the status and rights system incorporated in the deviation management system. Sophisticated reporting and statistics functions, in combination with interfaces to the requirements and configuration management systems, open up the way to develop even further potentials.
Often the deviation management process is the first or the only (halfway) formally defined process in an organization and the tools used are the only available process-related tools. Gradual, step-by-step improvements in this area are often seen as a precedent for other improvements in the overall project, leading to medium-term improvements in other areas such as requirements or project management.
8.4 Standardized Classification for Software Anomalies According to the IEEE 1044/1044.1 Standard
The [IEEE 1044] standard describes a classification of anomalies, the documentation of the attributes of an anomaly, and the associated process. This standard serves as a good basis and is briefly explained in the following section.
Standard techniques for the classification of anomalies (incidents)
8.4.1 Overview of the Classifications Process
For classification, IEEE 1044 defines a sequence of four steps:
1. Recognition
2. Investigation
3. Action
4. Disposition
Essentially, each, of these four steps consists of the execution of three parallel activities:
![]() Recording
Recording
![]() Classifying
Classifying
![]() Identifying impacts
Identifying impacts
Applied on each step, the three activities classify and document the features of the incident from different perspectives.
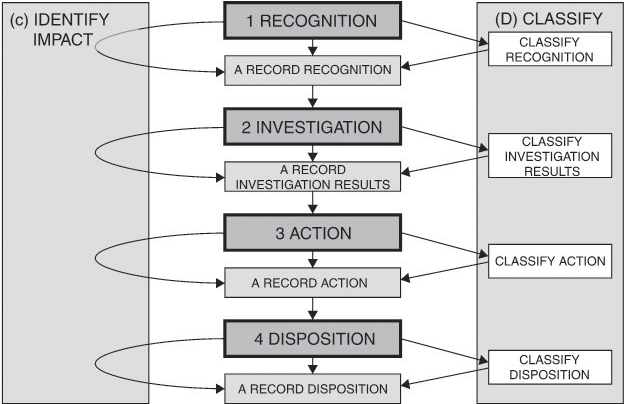
The focus of this workflow is clearly on report classification. The standard does not describe a complete management process and does not, for instance, consider how to deal with rejected reports or ineffective corrections. A reasonable management process is based on a status model similar to the one illustrated in figure 8.1 above, integrating the classification steps according to IEEE 1044 (see figure 8-5).
It is important to classify in each step; i.e., to classify not only the severity and impact of an anomaly defined during analysis but also the circumstances that have led to its detection, the necessary resolution actions, and the report’s disposition after closure.
Figure 8–5 Classification according to IEEE 1044
8.4.2 Data Model: Categories, Classifications, and Supporting Data Items
Classification is done using a selection of predefined values, so-called “classifications”, and attributes of assigned “categories”. The standard considers some of these attributes mandatory and others optional. Each classification and each category is clearly defined to ensure uniform recording and processing of anomalies even in large projects. Classifications and categories are combined in “classification schemes” and applied to each of the classification process steps.
The category recognition classification scheme – project activity serves as a good example. It is used to determine the activity (e.g., review or test) by which an incident is detected (see figure 8-6).
Figure 8–6 Example: Recognition classification scheme-project activity
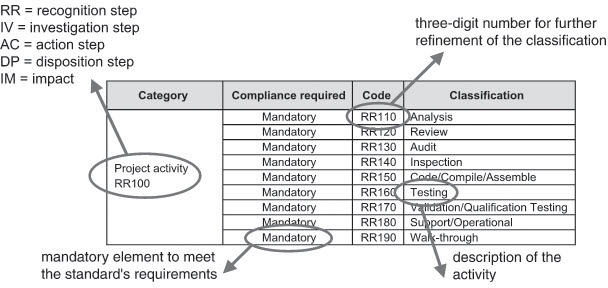
RR100 implies that this scheme is to be applied to the recognition step of the anomaly. “Mandatory” in each line indicates that in order for the classification process to comply with the standard, the category as a whole and each of the possible activities in the associated classification table must be applied.
Based on this scheme, an anomaly found during system test is assigned code “RR160”, whereas an anomaly detected during review has “RR120” assigned to it.
Besides categories, the standard also defines so-called “supporting data items”, which can be applied in the description of the anomaly and the environment in which it occurred. This can be exemplified by the “investigation supporting data items” in figure 8-7, which support the anomaly analysis step.
Figure 8–7 Example: Investigation supporting data item
Acknowledgement |
Verification |
Date received |
Source of incident |
Report number assigned |
Data from recognition process |
Investigator |
|
Name |
|
Code or functional area |
|
E-mail address |
|
Phone number |
|
Estimated start date of investigation |
|
Estimated complete date of investigation |
|
Actual start date of investigation |
|
Actual complete date of investigation |
|
Person hours |
|
Date receipt acknowledgement |
|
Documents used in investigation |
|
Name |
|
ID number |
|
Revision |
|
During the analysis step this table is used to enter organizational pieces of information. They can serve a variety of purposes:
![]() To support subsequent classification steps as well as the actual treatment of the anomaly. Stating the “source of incident” provides direct help to the person assigned to resolve the anomaly.
To support subsequent classification steps as well as the actual treatment of the anomaly. Stating the “source of incident” provides direct help to the person assigned to resolve the anomaly.
![]() To help in analyzing data in different ways, keeping process improvement in mind. For example, if estimated and actual times used for the analysis step regularly show substantial deviations, the issue may be addressed by introducing improved estimation models or more highly qualified staff for the job.
To help in analyzing data in different ways, keeping process improvement in mind. For example, if estimated and actual times used for the analysis step regularly show substantial deviations, the issue may be addressed by introducing improved estimation models or more highly qualified staff for the job.
![]() To have better traceability of the different processing steps. For example, should one of the people in the processing chain drop out for some reason, it will be a lot easier for someone else to continue processing a particular step. In the example in figure 8.7, the information “documents used in investigation” provides an overview of the documents that have already been checked and those that still need to be analyzed.
To have better traceability of the different processing steps. For example, should one of the people in the processing chain drop out for some reason, it will be a lot easier for someone else to continue processing a particular step. In the example in figure 8.7, the information “documents used in investigation” provides an overview of the documents that have already been checked and those that still need to be analyzed.
8.4.3 Classification Steps in Detail
Recognition
Each project member can report anomalies. The following activities of the recognition step are performed as soon as the anomaly is encountered:
Recognition
![]() Documentation by collecting recognition supporting data items. These items comprise all data related to the environment in which the anomaly was detected. Data such as hardware and software environment and test supporting software (e.g., test automation tools) and also the contact ID of the reporting person are recorded here, together with the time of occurrence and the documentation used during the operation of the system. Note that the standard considers the attributes list it provides as optional and incomplete.
Documentation by collecting recognition supporting data items. These items comprise all data related to the environment in which the anomaly was detected. Data such as hardware and software environment and test supporting software (e.g., test automation tools) and also the contact ID of the reporting person are recorded here, together with the time of occurrence and the documentation used during the operation of the system. Note that the standard considers the attributes list it provides as optional and incomplete.
![]() Classification via selection of values out of the recognition classification scheme. It consists of six categories (three of which are mandatory) that are supposed to help provide accurate reporting—for example, project phase, symptom, and system status after the anomaly has occurred.
Classification via selection of values out of the recognition classification scheme. It consists of six categories (three of which are mandatory) that are supposed to help provide accurate reporting—for example, project phase, symptom, and system status after the anomaly has occurred.
![]() Identifying the impact by means of the impact classification scheme and the impact supporting data items. This data is to be used by the person who encountered the anomaly to report his observations (or assumptions) on the impacts of the incident: urgency and severity of the anomaly, effects on product quality, customer value, safety, project cost, risk, and project schedule.
Identifying the impact by means of the impact classification scheme and the impact supporting data items. This data is to be used by the person who encountered the anomaly to report his observations (or assumptions) on the impacts of the incident: urgency and severity of the anomaly, effects on product quality, customer value, safety, project cost, risk, and project schedule.
Analysis
Each reported anomaly must be investigated. The aim of the investigation is to be able to evaluate the anomaly. Usually this step is carried out by development, but important information may also come from testers or other project members.
Analysis (investigation)
![]() Documentation: The investigation supporting data items are collected here to confirm the existence and reproducibility of the anomaly and to identify possible workarounds and correction measures. The standard considers this list, too, as optional and incomplete.
Documentation: The investigation supporting data items are collected here to confirm the existence and reproducibility of the anomaly and to identify possible workarounds and correction measures. The standard considers this list, too, as optional and incomplete.
![]() Classification: Selection of suitable data out of the investigation classification scheme to describe the actual cause, the impacted documents, and the nature of the anomaly. In addition, classifications made in the first step are checked and, if necessary, corrected.
Classification: Selection of suitable data out of the investigation classification scheme to describe the actual cause, the impacted documents, and the nature of the anomaly. In addition, classifications made in the first step are checked and, if necessary, corrected.
![]() Identification of the impact: The assumptions made on the impact of the anomaly documented in the first step are checked and, if necessary, corrected. The tables used in the first step are used as a basis.
Identification of the impact: The assumptions made on the impact of the anomaly documented in the first step are checked and, if necessary, corrected. The tables used in the first step are used as a basis.
Resolution
Based on the analysis results, resolution actions are planned. This step may comprise both the direct resolution of the anomaly itself and process improvement actions designed to avoid further, similar incidents. In this step, development is primarily involved, but other roles may also be involved, such as the product manager or the quality assurance department.
Resolution (action)
![]() Documentation: To begin with, action supporting data items are collected; for example, planned resolution date and product delivery status, a description of the resolution activities, and the names or functions of people responsible for correction or retesting.
Documentation: To begin with, action supporting data items are collected; for example, planned resolution date and product delivery status, a description of the resolution activities, and the names or functions of people responsible for correction or retesting.
![]() Classification: This is done using the action classification scheme, describing the type of the action (e.g., code or documentation changes) and their priority (ranging from “immediate” to “no resolution”). Optionally, the scheme also describes additional countermeasures of a more strategic nature, such as process improvement and research activities.
Classification: This is done using the action classification scheme, describing the type of the action (e.g., code or documentation changes) and their priority (ranging from “immediate” to “no resolution”). Optionally, the scheme also describes additional countermeasures of a more strategic nature, such as process improvement and research activities.
![]() Identifying the impact: Again, impact categories documented in the previous steps are reviewed and, if necessary, updated.
Identifying the impact: Again, impact categories documented in the previous steps are reviewed and, if necessary, updated.
Disposition
In the disposition phase—i.e., after all resolution activities have been completed or at least after long-term correction actions have been initiated—the removal of the anomaly is to be documented. The main actors involved in this step are usually testers, in some cases support staff, and the product manager.
Disposition
![]() Documentation: The disposition supporting data items, for instance, document that the customer has been informed about the resolution. They are also used to document verification (e.g., retest) results.
Documentation: The disposition supporting data items, for instance, document that the customer has been informed about the resolution. They are also used to document verification (e.g., retest) results.
![]() Classification: The disposition classification scheme documents the final version of the anomaly report (e.g., “resolution completed” or “duplicate problem”).
Classification: The disposition classification scheme documents the final version of the anomaly report (e.g., “resolution completed” or “duplicate problem”).
![]() Identifying the impact: A concluding consideration is made and previously documented impacts are reviewed and updated, if necessary—again based on the same reference tables as in the previous steps.
Identifying the impact: A concluding consideration is made and previously documented impacts are reviewed and updated, if necessary—again based on the same reference tables as in the previous steps.
8.4.4 Tailoring of Standards
The sample tables and the descriptions of the individual categories show that the standard is very comprehensive, covering the entire software life cycle. In practice, however, it will not be applied in its entirety but rather tailored and reduced to the concrete needs in the project in the following manner:
![]() By means of omission of redundant attributes or categories
By means of omission of redundant attributes or categories
![]() By integrating the steps of the classification processes into one’s own deviation management process
By integrating the steps of the classification processes into one’s own deviation management process
Generally, the reasons for this so-called “tailoring” are found during a cost-benefit analysis—more detailed data collected during incident treatment means more data is available in subsequent process steps; however, it also amounts to more effort required for collection and maintenance. The following list includes some of the factors that may possibly influence the standard’s scope of use:
Influencing factors
![]() The intended area of influence: Is the process to be applied across the different test levels, projects, or even the entire organization? Is it to be restricted to development and test or is it also to be applied in product support?
The intended area of influence: Is the process to be applied across the different test levels, projects, or even the entire organization? Is it to be restricted to development and test or is it also to be applied in product support?
![]() The evaluation of collected data for process improvement purposes: Accumulation of particular incident categories is an indicator that can be used for focusing on and removal of weaknesses in the development and test process.
The evaluation of collected data for process improvement purposes: Accumulation of particular incident categories is an indicator that can be used for focusing on and removal of weaknesses in the development and test process.
![]() The applicability of categories in the concrete project environment. Supporting data items such as databases and firmware only make sense in particular settings.
The applicability of categories in the concrete project environment. Supporting data items such as databases and firmware only make sense in particular settings.
![]() Documentation and obligation of accountability required by customers and/or licensing authorities. These may possibly require more detailed data than what is needed in the development department.
Documentation and obligation of accountability required by customers and/or licensing authorities. These may possibly require more detailed data than what is needed in the development department.
Supplement IEEE 1044.1 to the standard provides valuable support for the tailoring and customization of standards to suit one’s own requirements, providing the following:
Tailoring support
![]() Support for the decision if, and within which scope, the standard can and should be applied in one’s own organizational setting
Support for the decision if, and within which scope, the standard can and should be applied in one’s own organizational setting
![]() Detailed explanations and examples of categories and classifications
Detailed explanations and examples of categories and classifications
![]() Additional supporting data items not mentioned in the standard
Additional supporting data items not mentioned in the standard
![]() Guidelines for correct tailoring; i.e., particulars and examples of standard-compliant and noncompliant adaptations and omissions of categories and classifications
Guidelines for correct tailoring; i.e., particulars and examples of standard-compliant and noncompliant adaptations and omissions of categories and classifications
![]() A sample status model for anomalies (similar to the one in section 8.3.2)
A sample status model for anomalies (similar to the one in section 8.3.2)
![]() Methods to map the standard into commercial and in-house developed deviation management systems
Methods to map the standard into commercial and in-house developed deviation management systems
![]() Examples of incident metrics, their analysis, and application to project control, product evaluation, and process improvement
Examples of incident metrics, their analysis, and application to project control, product evaluation, and process improvement
It is easy to draw a line from the contents of this supplement right back the beginning of this chapter. Both the sample incident reporting template (section 8.2) and the status model (section 8.3.2) were derived from, though not necessarily in compliance with, the IEEE 1044/1044.1 standard to be applied in software development and testing during development at the project level. Both have been successfully tried and tested in many projects.
These examples may serve as a starting point to readers establishing their own deviation management system. Nevertheless, we would recommend that the standard be used to critically scrutinize the examples for applicability.
8.5 Summary
![]() On the one hand, anomalies require consistent and complete documentation to provide maximum support for their evaluation and resolution; on the other hand, they require a management process that reflects the life cycle of the incident reports and coordinates the roles involved in the processing of the deviation.
On the one hand, anomalies require consistent and complete documentation to provide maximum support for their evaluation and resolution; on the other hand, they require a management process that reflects the life cycle of the incident reports and coordinates the roles involved in the processing of the deviation.
![]() In practice, a large variety of different systems is used for incident reporting, ranging from simple management techniques to sophisticated deviation management tools, from the simple exchange of e-mails to deviation management systems spanning an entire organization with comprehensive databases that can be used for a wide range of different statistics. If such systems are linked to other corporate configuration, test, and requirements management systems, they can considerably increase efficiency in the development process.
In practice, a large variety of different systems is used for incident reporting, ranging from simple management techniques to sophisticated deviation management tools, from the simple exchange of e-mails to deviation management systems spanning an entire organization with comprehensive databases that can be used for a wide range of different statistics. If such systems are linked to other corporate configuration, test, and requirements management systems, they can considerably increase efficiency in the development process.
![]() To provide for a common basis for this historically grown heterogeneity, the IEEE defined a standard for the classification of anomalies (IEEE 1044), containing mandatory and optional attributes of anomalies as well as a description of a generic processing workflow.
To provide for a common basis for this historically grown heterogeneity, the IEEE defined a standard for the classification of anomalies (IEEE 1044), containing mandatory and optional attributes of anomalies as well as a description of a generic processing workflow.
![]() IEEE 1044 arranges the documentation, monitoring, and classification of deviations into four process steps:
IEEE 1044 arranges the documentation, monitoring, and classification of deviations into four process steps:
• Recognition
• Investigation
• Action
• Disposition
![]() The IEEE 1044 standard is very comprehensive and allows application in test not only during development but also throughout a system’s entire life cycle. For this reason, however, the standard in most cases requires customization to suit the concrete requirements in a particular environment. A supplementary document (IEEE 1044.1) provides valuable information on this issue.
The IEEE 1044 standard is very comprehensive and allows application in test not only during development but also throughout a system’s entire life cycle. For this reason, however, the standard in most cases requires customization to suit the concrete requirements in a particular environment. A supplementary document (IEEE 1044.1) provides valuable information on this issue.