![]()
Query Performance Tuning
SQL Server query performance tuning and optimization requires a multilayered approach. The following are a few key factors that impact SQL Server query performance:
- Database design: Probably one of the most important factors influencing both query performance and data integrity, design decisions impact both read and modification performance. Standard designs include OLTP-normalized databases, which focus on data integrity, removal of redundancy, and the establishment of relationships between multiple entities. This is a design most appropriate for quick transaction processing. You’ll usually see more tables in a normalized OLTP design, which means more table joins in your queries. Data-warehouse designs, on the other hand, often use a more denormalized star or snowflake design. These designs use a central fact table, which is joined to two or more description dimension tables. For snowflake designs, the dimension tables can also have related tables associated with them. The focus of this design is on query speed, not on fast updates to transactions.
- Configurations: This category includes databases, the SQL instance, and operating system configurations. Poor choices in configurations (such as enabling automatic shrinking or automatic closing of a database) can lead to performance issues for a busy application.
- Hardware: I once spent a day trying to get a three-second query down to one second. No matter which indexes I tried to add or query modifications I made, I couldn’t get its duration lowered. This was because there were simply too many rows required in the result set. The limiting factor was I/O. A few months later, I migrated the database to a higher-powered production server. After that, the query executed consistently in less than one second. This underscores the fact that well-chosen hardware does matter. Your choice of processor architecture, available memory, and disk subsystem can have a significant impact on query performance.
- Network throughput: The time it takes to obtain query results can be impacted by a slow or unstable network connection. This doesn’t mean you should be quick to blame the network engineers whenever a query executes slowly, but do keep this potential cause on your list of areas to investigate.
In this chapter, I’ll demonstrate the T-SQL commands and techniques you can use to help evaluate and troubleshoot your query performance. I will follow that up in Chapter 24 when I discuss the related topics of fragmented indexes, out-of-date statistics, and the usage of indexes in the database.
![]() Note Since this is a T-SQL book, I will not be reviewing the graphical interface tools that also assist with performance tuning, such as SQL Server Profiler, graphical execution plans, System Monitor, and the Database Engine Tuning Advisor. These are all extremely useful tools, so I still encourage you to use them as part of your overall performance-tuning strategy in addition to the T-SQL commands and techniques you’ll learn about in this chapter.
Note Since this is a T-SQL book, I will not be reviewing the graphical interface tools that also assist with performance tuning, such as SQL Server Profiler, graphical execution plans, System Monitor, and the Database Engine Tuning Advisor. These are all extremely useful tools, so I still encourage you to use them as part of your overall performance-tuning strategy in addition to the T-SQL commands and techniques you’ll learn about in this chapter.
In this chapter, I’ll demonstrate how to do the following:
- Control workloads and associated CPU and memory resources using Resource Governor
- Create statistics on a subset of data using the new filtered statistics improvement
- Display query statistics aggregated across near-identical queries (queries that are identical with the exception of nonparameterized literal values) or queries with identical query execution plans
- Create plan guides based on existing query plans in the query plan cache using the sp_create_plan_guide_from_handle system stored procedure
I will also demonstrate some changes made in SQL Server 2014 relevant to the sys.dm_exec_query_stats Dynamic Management View.
This chapter will also review a few miscellaneous query performance topics, including how to use sp_executesql as an alternative to dynamic SQL, how to apply query hints to a query without changing the query itself, and how to force a query to use a specific query execution plan.
Before I start discussing the commands and tools you can use to evaluate query performance, I will first briefly review a few basic query performance-tuning guidelines. Query performance is a vast topic, and in many of the chapters I’ve tried to include small tips along with the various content areas. Since this is a chapter that discusses query performance independently of specific objects, the following list details a few query performance best practices to be aware of when constructing SQL Server queries (note that indexing tips are reviewed in Chapter 24):
- In your SELECT query, return only the columns you need. Having fewer columns in your query translates to less I/O and network bandwidth.
- Along with fewer columns, you should also be thinking about fewer rows. Use a WHERE clause to help reduce the number of rows returned by your query. Don’t let the application return 20,000 rows when you need to display only the first 10.
- Keep the FROM clause under control. Each table you JOIN to in a single query can add overhead. I can’t give you an exact number to watch out for, because it depends on your database’s design and size, and the columns used to join a query. However, over the years, I’ve seen enormous queries that are functionally correct but take far too long to execute. Although it is convenient to use a single query to perform a complex operation, don’t underestimate the power of smaller queries. If I have a very large query in a stored procedure that is taking too long to execute, I’ll usually try breaking that query down into smaller intermediate result sets. This usually results in a significantly faster generation of the final desired result set.
- Use ORDER BY only if you need ordered results. Sorting operations in larger result sets can incur additional overhead. If it isn’t necessary for your query, remove it.
- Avoid implicit data-type conversions in your JOIN, FROM, WHERE, and HAVING clauses. Implicit data-type conversions happen when the underlying data types in your predicates don’t match and are automatically converted by SQL Server. One example is a Java application sending Unicode text to a non-Unicode column. For applications processing hundreds of transactions per second, these implicit conversions can really add up.
- Don’t use DISTINCT or UNION (instead of UNION ALL) if having unique rows is not a necessity.
- Beware of testing in a vacuum. When developing your database on a test SQL Server instance, it is very important that you populate the tables with a representative data set. This means you should populate the table with the estimated number of rows you would actually see in production, as well as with a representative set of values. Don’t use dummy data in your development database and then expect the query to execute with similar performance in production. SQL Server performance is highly dependent on indexes and statistics, and SQL Server will make decisions based on the actual values contained within a table. If your test data isn’t representative of “real-life” data, you’ll be in for a surprise when queries in production don’t perform as you saw them perform on the test database.
- When choosing between cursors and set-based approaches, always favor the latter. If you must use cursors, be sure to close and deallocate them as soon as possible.
- Query hints can sometimes be necessary in more complex database-driven applications; however, they often outlast their usefulness once the underlying data volume or distribution changes. Avoid overriding SQL Server’s decision process by using hints sparingly.
- Avoid nesting views. I’ve often seen views created that reference other views, which in turn reference objects that are already referenced in the calling view! This overlap and redundancy can often result in nonoptimal query plans because of the resulting query complexity.
- I pushed this point hard in Chapter 18, and I think it is worth repeating here: stored procedures often yield excellent performance gains over regular ad hoc query calls. Stored procedures also promote query execution stability (reusing existing query execution plans). If you have a query that executes with unpredictable durations, consider encapsulating the query in a stored procedure.
When reading about SQL Server performance tuning (like you are now), be careful about saying “never” and “always.” Instead, get comfortable with the answer “it depends.” When it comes to query tuning, results may vary. Keep your options open and feel free to experiment (in a test environment, of course). Ask questions, and don’t accept conventional wisdom at face value.
Capturing and Evaluating Query Performance
In this next set of recipes, I’ll demonstrate how to capture and evaluate query performance and activity. I’ll also demonstrate several other Transact-SQL commands, which can be used to return detailed information about the query execution plan.
22-1. Capturing Executing Queries
Problem
You need to find the currently executing queries in your database while incurring minimal performance impact.
Solution #1
Use sys.dm_exec_requests. In addition to capturing queries in SQL Server Profiler, you can also capture the SQL for currently executing queries by querying the sys.dm_exec_requests dynamic management view (DMV), as this recipe demonstrates:
USE AdventureWorks2014;
GO

SELECT r.session_id, r.status, r.start_time, r.command, s.text
FROM sys.dm_exec_requests r
CROSS APPLY sys.dm_exec_sql_text(r.sql_handle) s
WHERE r.status = 'running';
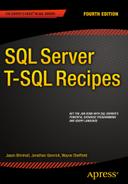
This captures any queries that are currently being executed, even the current query being used to capture those very queries:
How It Works
The sys.dm_exec_requests DMV returns information about all requests executing on a SQL Server instance.
The first line of the query selected the session ID, status of the query, start time, command type (for example, SELECT, INSERT, UPDATE, DELETE), and actual SQL text:
SELECT r.session_id, r.status, r.start_time, r.command, s.text
In the FROM clause, the sys.dm_exec_requests DMV was cross-applied against the sys.dm_exec_sql_text dynamic management function. This function takes the sql_handle from the sys.dm_exec_requests DMV and returns the associated SQL text.
FROM sys.dm_exec_requests r
CROSS APPLY sys.dm_exec_sql_text(r.sql_handle) s
The WHERE clause then designates that currently running processes be returned.
WHERE r.status = 'running'
Solution #2
Create an Extended Event session to trap the queries as they are executed. Extended Events offer a lightweight means, compared to Profiler, to trap the incoming queries. This recipe will demonstrate how to implement an Extended Event session and read the captured data:
USE master;
GO
-- Create the Event Session
IF EXISTS(SELECT *
          FROM sys.server_event_sessions
          WHERE name='TraceIncomingQueries')
    DROP EVENT SESSION TraceIncomingQueries
    ON SERVER;
GO
CREATE EVENT SESSION TraceIncomingQueries
ON SERVER
ADD EVENT sqlserver.sql_statement_starting(
    ACTION(sqlserver.database_name,sqlserver.nt_username,sqlserver.session_id,sqlserver.client_hostname,sqlserver.client_app_name)
WHERE sqlserver.database_name='AdventureWorks2014'
        AND sqlserver.client_app_name <> 'Microsoft SQL Server Management Studio - Transact-SQL IntelliSense'
        )
ADD TARGET package0.event_file(SET filename=N'C:DatabaseXETraceIncomingQueries.xel')

/* start the session */
ALTER EVENT SESSION TraceIncomingQueries
ON SERVER
STATE = START;
GO

With the Extended Event (XE) session in place, I will execute a query:
USE AdventureWorks2014;
GO

SELECT r.session_id, r.status, r.start_time, r.command, s.text
FROM sys.dm_exec_requests r
CROSS APPLY sys.dm_exec_sql_text(r.sql_handle) s
WHERE r.status = 'running';
To confirm that data was captured, I then need to parse the session data from the XE session:
use master;
GO

SELECT
event_data.value('(event/@name)[1]', 'varchar(50)') AS event_name,
    event_data.value('(event/@timestamp)[1]', 'varchar(50)') AS [TIMESTAMP],
        event_data.value('(event/action[@name="database_name"]/value)[1]', 'varchar(max)') AS DBName
        ,event_data.value('(event/data[@name="statement"]/value)[1]', 'varchar(max)') AS SQLText
        ,event_data.value('(event/action[@name="session_id"]/value)[1]', 'varchar(max)') AS SessionID
        ,event_data.value('(event/action[@name="nt_username"]/value)[1]', 'varchar(max)') AS ExecUser
        ,event_data.value('(event/action[@name="client_hostname"]/value)[1]', 'varchar(max)') AS Client_HostName,
        event_data.value('(event/action[@name="client_app_name"]/value)[1]', 'varchar(max)') AS Client_AppName
FROM(
SELECT CONVERT(XML, t2.event_data) AS event_data
 FROM (
  SELECT target_data = convert(XML, target_data)
   FROM sys.dm_xe_session_targets t
    INNER JOIN sys.dm_xe_sessions s
        ON t.event_session_address = s.address
   WHERE t.target_name = 'event_file'
    AND s.name = 'TraceIncomingQueries') cte1
   CROSS APPLY cte1.target_data.nodes('//EventFileTarget/File') FileEvent(FileTarget)
   CROSS APPLY  sys.fn_xe_file_target_read_file(FileEvent.FileTarget.value('@name', 'varchar(1000)'), NULL, NULL, NULL) t2)
    AS evts(event_data);
How It Works
Extended events are a lightweight tracing engine that allows events to be trapped, similar to Profiler. This script first checks to see if the session exists. If the session exists, it is dropped and then recreated. The session is defined to write the session data out to a file if the criteria matches. The session checks that the query is running in a connection to the AdventureWorks2014 database, and that the source application is not Intellisense. To read the data from the session, we convert the data from the file target to XML and then use XML methods to parse the data to a desired output.
22-2. Viewing Estimated Query Execution Plans
You are troubleshooting a query and need to see how SQL Server is executing that query.
Solution
Use the following Transact-SQL commands: SET SHOWPLAN_ALL, SET SHOWPLAN_TEXT, and SET SHOWPLAN_XML.
Knowing how SQL Server executes a query can help you determine how best to fix a poorly performing query. Details you can identify by viewing a query’s execution plan (either graphical or command-based) include the following:
- Highest-cost queries within a batch and highest-cost operators within a query
- Index or table scans (accessing all the pages in a heap or index) versus using seeks (accessing only selected rows)
- Missing statistics or other warnings
- Costly sort or calculation activities
- Lookup operations where a nonclustered index is used to access a row but then needs to access the clustered index to retrieve columns not covered by the nonclustered index
- High row counts being passed from operator to operator
- Discrepancies between the estimated and actual row counts
- Implicit data-type conversions (identified in an XML plan where the Implicit attribute of the Convert element is equal to 1)
In SQL Server, three commands can be used to view detailed information about a query execution plan for a SQL statement or batch: SET SHOWPLAN_ALL, SET SHOWPLAN_TEXT, and SET SHOWPLAN_XML. The output of these commands helps you understand how SQL Server plans to process and execute your query, identifying information such as table join types used and the indexes accessed. For example, using the output from these commands, you can see whether SQL Server is using a specific index in a query and, if so, whether it is retrieving the data using an index seek (a nonclustered index is used to retrieve selected rows for the operation) or an index scan (all index rows are retrieved for the operation).
When enabled, the SET SHOWPLAN_ALL, SET SHOWPLAN_TEXT, and SET SHOWPLAN_XML commands provide you with the plan information without executing the query, allowing you to adjust the query or indexes on the referenced tables before actually executing it.
Each of these commands returns information in a different way. SET SHOWPLAN_ALL returns the estimated query plan in a tabular format, with multiple columns and rows. The output includes information such as the estimated I/O or CPU of each operation, estimated rows involved in the operation, operation cost (relative to itself and variations of the query), and the physical and logical operators used.
![]() Note Logical operators describe the conceptual operation SQL Server must perform in the query execution. Physical operators are the actual implementation of that logical operation. For example, a logical operation in a query, INNER JOIN, could be translated into the physical operation of a nested loop in the actual query execution.
Note Logical operators describe the conceptual operation SQL Server must perform in the query execution. Physical operators are the actual implementation of that logical operation. For example, a logical operation in a query, INNER JOIN, could be translated into the physical operation of a nested loop in the actual query execution.
The SET SHOWPLAN_TEXT command returns the data in a single column, with multiple rows for each operation. You can also return a query execution plan in XML format using the SET SHOWPLAN_XML command.
The syntax for each of these commands is very similar. Each command is enabled when set to ON and disabled when set to OFF:
SET SHOWPLAN_ALL { ON | OFF }
SET SHOWPLAN_TEXT { ON | OFF}
SET SHOWPLAN_XML { ON | OFF }
This recipe’s example demonstrates returning the estimated query execution plan of a query in the AdventureWorks2014 database using SET SHOWPLAN_TEXT and then SET SHOWPLAN_XML:
USE AdventureWorks2014;
GO
SET SHOWPLAN_TEXT ON;
GO
SELECT p.Name, p.ProductNumber, r.ReviewerName
FROM Production.Product p
INNER JOIN Production.ProductReview r
ON p.ProductID = r.ProductID
WHERE r.Rating > 2;
GO
SET SHOWPLAN_TEXT OFF;
GO
This returns the following estimated query execution plan output:
StmtText
SELECT p.Name, p.ProductNumber, r.ReviewerName
FROM Production.Product p
INNER JOIN Production.ProductReview r
ON p.ProductID = r.ProductID
WHERE r.Rating > 2;

(1 row(s) affected)

StmtText
  |--Nested Loops(Inner Join, OUTER REFERENCES:([r].[ProductID]))
       |--Clustered Index Scan(OBJECT:([AdventureWorks2014].[Production].[ProductReview].[PK_ProductReview_ProductReviewID] AS [r]), WHERE:([AdventureWorks2014].[Production].[ProductReview].[Rating] as [r].[Rating]>(2)))
       |--Clustered Index Seek(OBJECT:([AdventureWorks2014].[Production].[Product].[PK_Product_ProductID] AS [p]), SEEK:([p].[ProductID]=[AdventureWorks2014].[Production].[ProductReview].[ProductID] as [r].[ProductID]) ORDERED FORWARD)

(3 row(s) affected)
The next example returns estimated query plan results in XML format:
USE AdventureWorks2014;
GO
SET SHOWPLAN_XML ON;
GO
SELECT p.Name, p.ProductNumber, r.ReviewerName
FROM Production.Product p
INNER JOIN Production.ProductReview r
ON p.ProductID = r.ProductID
WHERE r.Rating > 2;
GO
SET SHOWPLAN_XML OFF;
GO
This returns the following (this is an abridged snippet, because the actual output is more than a page long):
<ShowPlanXML xmlns="http://schemas.microsoft.com/sqlserver/2004/07/showplan" Version="1.2" Build="12.0.2000.8">  <BatchSequence>
    <Batch>
      <Statements>
...
       <RelOp NodeId="0" PhysicalOp="Nested Loops" LogicalOp="Inner Join" EstimateRows="3" EstimateIO="0" EstimateCPU="1.254e-005" AvgRowSize="140" EstimatedTotalSubtreeCost="0.0099657" Parallel="0" EstimateRebinds="0" EstimateRewinds="0" EstimatedExecutionMode="Row">
              <OutputList>
                <ColumnReference Database="[AdventureWorks2014]" Schema="[Production]"
                Table="[Product]" Alias="[p]" Column="Name" />
                <ColumnReference Database="[AdventureWorks2014]" Schema="[Production]"
                Table="[Product]" Alias="[p]" Column="ProductNumber" />
                <ColumnReference Database="[AdventureWorks2014]" Schema="[Production]"
                Table="[ProductReview]" Alias="[r]" Column="ReviewerName" />
              </OutputList>...
How It Works
You can use SHOWPLAN_ALL, SHOWPLAN_TEXT, or SHOWPLAN_XML to tune your Transact-SQL queries and batches. These commands show you the estimated execution plan without actually executing the query. You can use the information returned in the command output to take action toward improving the query performance (for example, adding indexes to columns being used in search or join conditions). Looking at the output, you can determine whether SQL Server is using the expected indexes and, if so, whether SQL Server is using an index seek, index scan, or table scan operation. In this recipe, the SET SHOWPLAN for both TEXT and XML was set to ON and then followed by GO.
SET SHOWPLAN_TEXT ON;
GO
A query referencing Production.Product and Production.ProductReview was then evaluated. The two tables were joined using an INNER join on the ProductID column, and only those products with a product rating of 2 or higher would be returned:
SELECT p.Name, p.ProductNumber, r.ReviewerName
FROM Production.Product p
INNER JOIN Production.ProductReview r
ON p.ProductID = r.ProductID
WHERE r.Rating > 2;
The SHOWPLAN was set OFF at the end of the query, so as not to keep executing SHOWPLAN for subsequent queries for that connection.
Looking at snippets from the output, you can see that a nested loop join (physical operation) was used to perform the INNER JOIN (logical operation).
--Nested Loops(Inner Join, OUTER REFERENCES:([r].[ProductID]))
You can also see from this output that a clustered index scan was performed using the PK_ProductReview_ProductReviewID primary key clustered index to retrieve data from the ProductReview table.
|--Clustered Index Scan (OBJECT:([AdventureWorks2014].[Production].[ProductReview]. [PK_ProductReview_ProductReviewID] AS [r]),
A clustered index seek, however, was used to retrieve data from the Product table.
|--Clustered Index Seek(OBJECT:([AdventureWorks2014].[Production].[Product]. [PK_Product_ProductID] AS [p]),
The SET SHOWPLAN_XML command returned the estimated query plan in an XML document format, displaying similar data as SHOWPLAN_TEXT. The XML data is formatted using attributes and elements.
For example, the attributes of the RelOp element show a physical operation of nested loops and a logical operation of Inner Join—along with other statistics such as estimated rows impacted by the operation.
<RelOp NodeId="0" PhysicalOp="Nested Loops" LogicalOp="Inner Join" EstimateRows="3" EstimateIO="0" EstimateCPU="1.254e-005" AvgRowSize="140" EstimatedTotalSubtreeCost="0.0099657" Parallel="0" EstimateRebinds="0" EstimateRewinds="0" EstimatedExecutionMode="Row">
The XML document follows a specific schema definition format that defines the returned XML elements, attributes, and data types. This schema can be viewed at the following URL: http://schemas.microsoft.com/sqlserver/2004/07/showplan/showplanxml.xsd.
22-3. Viewing Execution Runtime Information
You want to evaluate various execution statistics for a query that you are attempting to tune for better performance.
Solution
SQL Server provides four commands that are used to return query- and batch-execution statistics and information: SET STATISTICS IO, SET STATISTICS TIME, SET STATISTICS PROFILE, and SET STATISTICS XML.
Unlike the SHOWPLAN commands, STATISTICS commands return information for queries that have actually been executed in SQL Server. The SET STATISTICS IO command is used to return disk activity (hence I/O) generated by the executed statement. The SET STATISTICS TIME command returns the number of milliseconds taken to parse, compile, and execute each statement executed in the batch.
SET STATISTICS PROFILE and SET STATISTICS XML are the equivalents of SET SHOWPLAN_ALL and SET SHOWPLAN_XML, only the actual (not estimated) execution plan information is returned along with the actual results of the query.
The syntax of each of these commands is similar, with ON enabling the statistics and OFF disabling them:
SET STATISTICS IO  { ON | OFF }
SET STATISTICS TIME { ON | OFF }
SET STATISTICS PROFILE { ON | OFF }
SET STATISTICS XML { ON | OFF }
In the first example, STATISTICS IO is enabled prior to executing a query that totals the amount due by territory from the Sales.SalesOrderHeader and Sales.SalesTerritory tables. See the following:
USE AdventureWorks2014;
GO
SET STATISTICS IO ON;
GO
SELECT t.Name TerritoryNM,
SUM(TotalDue) TotalDue
FROM Sales.SalesOrderHeader h
INNER JOIN Sales.SalesTerritory t
ON h.TerritoryID = t.TerritoryID
WHERE OrderDate BETWEEN '1/1/2014' AND '12/31/2014'
GROUP BY t.Name
ORDER BY t.Name
SET STATISTICS IO OFF;
GO
This returns the following (abridged) results:
|
TerritoryNM |
TotalDue |
|---|---|
|
Australia |
3071053.8419 |
|
Canada |
2681602.5941 |
|
... | |
|
Southwest |
4437517.8076 |
|
United Kingdom |
2335108.8971 |
Table 'Worktable'. Scan count 1, logical reads 39, physical reads 0, read-ahead reads 0, lob logical reads 0, lob physical reads 0, lob read-ahead reads 0.
Table 'Workfile'. Scan count 0, logical reads 0, physical reads 0, read-ahead reads 0, lob logical reads 0, lob physical reads 0, lob read-ahead reads 0.
Table 'SalesOrderHeader'. Scan count 1, logical reads 689, physical reads 0, read-ahead reads 0, lob logical reads 0, lob physical reads 0, lob read-ahead reads 0.
Table 'SalesTerritory'. Scan count 1, logical reads 2, physical reads 0, read-ahead reads 0, lob logical reads 0, lob physical reads 0, lob read-ahead reads 0.
Substituting SET STATISTICS IO with SET STATISTICS TIME would have returned the following (abridged) results for that same query:
|
TerritoryNM |
TotalDue |
|---|---|
|
Australia |
3071053.8419 |
|
... | |
|
Southeast |
985940.2109 |
|
Southwest |
4437517.8076 |
|
United Kingdom |
2335108.8971 |
SQL Server parse and compile time:
   CPU time = 0 ms, elapsed time = 4 ms.

(10 row(s) affected)

 SQL Server Execution Times:
   CPU time = 0 ms,  elapsed time = 6 ms.
How It Works
The SET STATISTICS commands return information about the actual execution of a query or batch of queries. In this recipe, SET STATISTICS IO returned information about logical, physical, and large object read events for tables referenced in the query. For a query that is having performance issues (based on your business requirements and definition of issues), you can use SET STATISTICS IO to see where the I/O hot spots are occurring. For example, in this recipe’s result set, you can see that SalesOrderHeader had the highest number of logical reads.
...
Table 'SalesOrderHeader'. Scan count 1, logical reads 689, physical reads 0,
read-ahead reads 0, lob logical reads 0, lob physical reads 0, lob read-ahead
  reads 0.
...
Pay attention to high physical (reads from disk) or logical (reads from the data cache) read values, even if the physical read is zero and the logical read is a high value. Also look for worktables (which were also seen in this recipe), as follows:
Table 'Worktable'. Scan count 1, logical reads 39, physical reads 0, read-ahead reads 0, lob logical reads 0, lob physical reads 0, lob read-ahead reads 0.
Worktables are usually seen in conjunction with GROUP BY, ORDER BY, hash joins, and UNION operations in the query. Worktables are created in tempdb for the duration of the query and are removed automatically when SQL Server has finished the operation.
In the second example in this recipe, SET STATISTICS TIME was used to show the parse and compile time of the query (shown before the actual query results) and then the actual execution time (displayed after the query results). This command is useful for measuring the amount of time a query takes to execute from end to end, allowing you to see whether precompiling is taking longer than you realized or whether the slowdown occurs during the actual query execution.
The two other STATISTICS commands, SET STATISTICS PROFILE and SET STATISTICS XML, return information similar to that returned by SET SHOWPLAN_ALL and SET SHOWPLAN_XML, only the results are based on the actual, rather than the estimated, execution plan.
22-4. Viewing Statistics for Cached Plans
You need to determine the number of reads or writes that occur when a query is executed.
Query the sys.dm_exec_query_stats DMV to view performance statistics for cached query plans.
![]() Tip SQL Server 2008 introduced various improvements for managed collection and analysis of performance statistics. For example, the Data Collector uses stored procedures, SQL Server Integration Services, and SQL Server Agent jobs to collect data and load it into the Management Data Warehouse (MDW). These features are available in SQL Server 2014 as well.
Tip SQL Server 2008 introduced various improvements for managed collection and analysis of performance statistics. For example, the Data Collector uses stored procedures, SQL Server Integration Services, and SQL Server Agent jobs to collect data and load it into the Management Data Warehouse (MDW). These features are available in SQL Server 2014 as well.
In this example, a simple query that returns all rows from the Sales.Salesperson table is executed against the AdventureWorks2014 database. Prior to executing it, you’ll clear the procedure cache so that you can identify the query more easily in this demonstration (remember that you should clear out the procedure cache only on test SQL Server instances):
DBCC FREEPROCCACHE;
GO
USE AdventureWorks2014;
GO
SELECT BusinessEntityID, TerritoryID, SalesQuota
FROM Sales.SalesPerson;
Now, I’ll query the sys.dm_exec_query_stats DMV, which contains statistical information regarding queries cached on the SQL Server instance. This view contains a sql_handle, which I’ll use as an input to the sys.dm_exec_sql_text dynamic management function. This function is used to return the text of a Transact-SQL statement:
USE AdventureWorks2014;
GO
SELECT  t.text,
st.total_logical_reads,
st.total_physical_reads,
st.total_elapsed_time/1000000 Total_Time_Secs,
st.total_logical_writes
FROM sys.dm_exec_query_stats st
CROSS APPLY sys.dm_exec_sql_text(st.sql_handle) t;
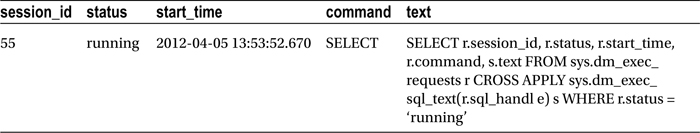
This returns the following abridged results:
How It Works
This recipe demonstrated clearing the procedure cache and then executing a query that took a few seconds to finish executing. After that, the sys.dm_exec_query_stats DMV was queried to return statistics about the cached execution plan.
The SELECT clause retrieved information on the Transact-SQL text of the query—the number of logical and physical reads, the total time elapsed in seconds, and the logical writes (if any).
SELECT  t.text,
st.total_logical_reads, st.total_physical_reads,
st.total_elapsed_time/1000000 Total_Time_Secs, st.total_logical_writes
The total elapsed time column was in microseconds, so it was divided by 1,000,000 in order to return the number of full seconds.
In the FROM clause, the sys.dm_exec_query_stats DMV was cross-applied against the sys.dm_exec_sql_text dynamic management function in order to retrieve the SQL text of the cached query:
FROM sys.dm_exec_query_stats st
CROSS APPLY sys.dm_exec_sql_text(st.sql_handle) t
This information is useful for identifying read-intensive and/or write-intensive queries, helping you determine which queries should be optimized. Keep in mind that this recipe’s query can retrieve information only on queries still in the cache. This query returned the totals, but sys.dm_ exec_query_stats also includes columns that track the minimum, maximum, and last measurements for reads and writes. Also note that sys.dm_exec_query_stats has other useful columns that can measure CPU time (total_worker_time, last_worker_time, min_worker_time, and max_worker_time) and .NET CLR object execution time (total_clr_time, last_clr_time, min_clr_time, max_clr_time).
22-5. Viewing Record Counts for Cached Plans
A query suddenly started taking twice as long to complete as it did in prior executions. You suspect that the decrease in performance is related to the number of records being returned. You need to find out whether there has been a variance in the number of records returned by this query.
Query the sys.dm_exec_query_stats DMV to view performance statistics for cached query plans.
In this example, we will reuse the query from the previous example to query Sales.SalesPerson.
USE AdventureWorks2014;
GO
SELECT BusinessEntityID, TerritoryID, SalesQuota
FROM Sales.SalesPerson;
Now, I’ll query the sys.dm_exec_query_stats DMV, which contains two new columns introduced in SQL Server 2014 (currently reserved for future use). This DMV contains statistical information regarding queries cached on the SQL Server instance. This view contains a sql_handle, which I’ll use as an input to the sys.dm_exec_sql_text dynamic management function. This function is used to return the text of a Transact-SQL statement:
USE AdventureWorks2014;
GO
SELECT  t.text,
st.total_rows,
st.last_rows,
st.min_rows,
st.max_rows
FROM sys.dm_exec_query_stats st
CROSS APPLY sys.dm_exec_sql_text(st.sql_handle) t
WHERE t.text like '%FROM Sales.SalesPerson%';
This returns the following (abridged) results:

How It Works
The sys.dm_exec_query_stats DMV was queried to return statistics about the cached execution plan.
The SELECT clause retrieved information on the Transact-SQL text of the query—minimum and maximum number of rows returned by the query, total rows returned by the query, and number of rows returned by the query on its last execution:
SELECT  t.text,
st.total_rows,
st.last_rows,
st.min_rows,
st.max_rows
FROM sys.dm_exec_query_stats st
Like the last query, we cross-applied to the sys.dm_exec_sql_text dynamic management function using sql_handle from sys.dm_exec_query_stats.
This information is useful in determining variances in the number of rows returned by a query. If the number of records to be returned has suddenly grown, the query to return those records may also increase in duration. By querying sys.dm_exec_query_stats, you can determine whether the query in question is returning a different number of records. Remember, though, that this query will return values only for queries that are presently in the cache.
22-6. Viewing Aggregated Performance Statistics Based on Query or Plan Patterns
Problem
You have an application that utilizes ad hoc queries. You need to aggregate performance statistics for similar ad hoc queries.
Query the sys.dm_exec_query_stats DMV. The previous recipe demonstrated viewing query statistics using the sys.dm_exec_query_stats DMV. Statistics in this DMV are displayed as long as the query plan remains in the cache. For applications that use stored procedures or prepared plans, sys.dm_exec_query_stats can give an accurate picture of overall aggregated statistics and resource utilization. However, if the application sends unprepared query text and does not properly parameterize literal values, individual statistic rows will be generated for each variation of an almost identical query, making the statistics difficult to correlate and aggregate.
For example, assume that the application sends the following three individual SELECT statements:
USE AdventureWorks2014;
GO
SELECT BusinessEntityID
FROM Purchasing.vVendorWithContacts
WHERE EmailAddress = '[email protected]';
GO
SELECT BusinessEntityID
FROM Purchasing.vVendorWithContacts
WHERE EmailAddress = '[email protected]';
GO
SELECT BusinessEntityID
FROM Purchasing.vVendorWithContacts
WHERE EmailAddress = '[email protected]';
GO
After executing this set of queries, the following query is executed:
USE AdventureWorks2014;
GO
SELECT  t.text,
st.total_logical_reads
FROM sys.dm_exec_query_stats st
CROSS APPLY sys.dm_exec_sql_text(st.sql_handle) t
WHERE t.text LIKE '%Purchasing.vVendorWithContacts%';
This query returns the following:
Text                                                    total_logical_reads
SELECT BusinessEntityID
FROM Purchasing.vVendorWithContacts
WHERE EmailAddress = '[email protected]'      12
SELECT BusinessEntityID
FROM Purchasing.vVendorWithContacts
WHERE EmailAddress = '[email protected]'      12
SELECT BusinessEntityID
FROM Purchasing.vVendorWithContacts
WHERE EmailAddress = '[email protected]'     12
Notice that a statistics row was created for each query, even though each query against Purchasing.vVendorWithContacts was identical, with the exception of the EmailAddress literal value. This is an issue you’ll see for applications that do not prepare the query text.
To address this issue, there are two helpful columns in the sys.dm_exec_ query_stats DMV: query_hash and query_plan_hash. Each of these columns contain a binary hash value. The query_hash binary value is the same for those queries that are identical with the exception of literal values (in this example, differing e-mail addresses). The generated query_plan_hash binary value is the same for those queries that use identical query plans. These two columns add the ability to aggregate overall statistics across identical queries or query execution plans. Here’s an example:
USE AdventureWorks2014;
GO
SELECT
MAX(t.text) as query_text,
COUNT(t.text) query_count,
SUM(st.total_logical_reads) total_logical_reads
FROM sys.dm_exec_query_stats st
CROSS APPLY sys.dm_exec_sql_text(st.sql_handle) t
WHERE text LIKE '%Purchasing.vVendorWithContacts%'
GROUP BY st.query_hash;
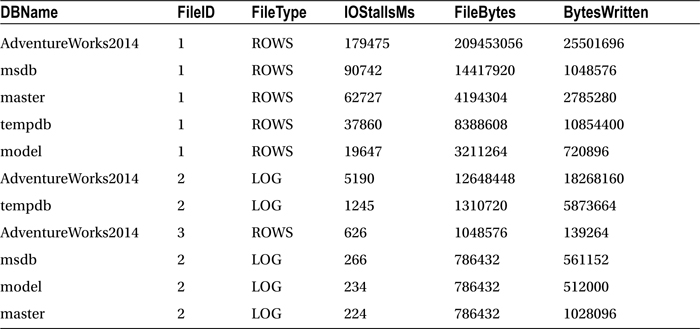
This query returns the following:
query_ text             query_count      total_logical_reads
SELECT BusinessEntityID 3                36
How It Works
I started the recipe by executing three queries that were identical with the exception of the literal values defined for the EmailAddress column in the WHERE clause. After that, I demonstrated querying the sys.dm_exec_query_stats DMV to view the logical read statistics for each query. Three separate rows were generated for each query against Purchasing.vVendorWithContacts, instead of showing an aggregated single row. This can be problematic if you are trying to capture the TOP X number of high-resource-usage queries, because your result may not reflect the numerous variations of the same query that exist in the query plan cache.
To address this problem, I demonstrated using the query_hash column that was introduced to the sys.dm_exec_query_stats DMV back in SQL Server 2008.
Walking through the query, the SELECT clause of the query referenced the text column and produced a COUNT of the distinct queries using different literal values and a SUM of the logical reads across these queries:
SELECT MAX(t.text) as query_text,
COUNT(t.text) query_count, SUM(st.total_logical_reads) total_logical_reads
The FROM clause referenced the sys.dm_exec_query_stats DMV and used CROSS APPLY to access the query text based on the sql_handle:
FROM sys.dm_exec_query_stats st
CROSS APPLY sys.dm_exec_sql_text(st.sqljandle) t
I narrowed down the result set to those queries referencing the Purchasing.vVendorWithContacts view:
WHERE text LIKE '%Purchasing.vVendorWithContacts%'
Lastly, since I was aggregating the statistics by the query_hash, I used a GROUP BY clause with the query_hash column:
GROUP BY st.query_hash
The query_hash value of 0x5C4B94191341266A was identical across all three queries, allowing me to aggregate each of the individual rows into a single row and properly sum the statistic columns I was interested in. Aggregating by the query_hash or query_plan_hash improves visibility for specific query or plan patterns and their associated resource costs.
22-7. Identifying the Top Bottleneck
Problem
Have you ever been approached by a customer or coworker who reports that “SQL Server is running slow”? When you ask for more details, that person may not be able to properly articulate the performance issue, or may attribute the issue to some random change or event without having any real evidence to back it up.
In this situation, your number one tool for identifying and narrowing down the field of possible explanations is the sys.dm_os_wait_stats DMV. This DMV provides a running total of all waits encountered by executing threads in the SQL Server instance. Each time SQL Server is restarted, or if you manually clear the statistics, the data is reset to zero and accumulates over the uptime of the SQL Server instance.
SQL Server categorizes these waits across several different types. Some of these types only indicate quiet periods on the instance where threads lay in waiting, whereas other wait types indicate external or internal contention on specific resources.
![]() Tip The technique described here is part of the Waits and Queues methodology. An in-depth discussion of this methodology can be found under the Technical White Papers section at http://technet.microsoft.com/en-us/sqlserver/bb671430.
Tip The technique described here is part of the Waits and Queues methodology. An in-depth discussion of this methodology can be found under the Technical White Papers section at http://technet.microsoft.com/en-us/sqlserver/bb671430.
The following recipe shows the top two wait types that have accumulated for the SQL Server instance since it was last cleared or since the instance started (the waits in the exclusion list are not comprehensive, and rather are just an example of what can be excluded). See the following:
USE AdventureWorks2014;
GO
SELECT  TOP 2
wait_type, wait_time_ms FROM sys.dm_os_wait_stats WHERE wait_type NOT IN
('LAZYWRITER_SLEEP', 'SQLTRACE_BUFFER_FLUSH', 'REQUEST_FOR_DEADLOCK_SEARCH', 'LOGMGR_QUEUE'
, 'CHECKPOINT_QUEUE', 'CLR_AUTO_EVENT','WAITFOR', 'BROKER_TASK_STOP', 'SLEEP_TASK', 'BROKER_TO_FLUSH'
,'HADR_FILESTREAM_IOMGR_IOCOMPLETION','SQLTRACE_INCREMENTAL_FLUSH_SLEEP','QDS_CLEANUP_STALE_QUERIES_TASK_MAIN_LOOP_SLEEP'
,'DIRTY_PAGE_POLL','XE_TIMER_EVENT','QDS_PERSIST_TASK_MAIN_LOOP_SLEEP')
ORDER BY wait_time_ms DESC;
This returns the following (your results will vary based on your SQL Server activity):
|
wait_type |
wait_time_ms |
|---|---|
|
LCK_M_U |
31989 |
|
LCK_M_S |
12133 |
In this case, the top two waits for the SQL Server instance are related to requests waiting to acquire update and shared locks. You can interpret these wait types by looking them up in SQL Server Books Online or in the Waits and Queues white papers published by Microsoft. In this recipe’s case, the top two wait types are often associated with long-running blocks. This result is an indication that if an application is having performance issues, you would be wise to start looking for additional evidence of long-running blocks using more granular tools (DMVs, SQL Profiler). The key purpose of looking at sys.dm_os_wait_stats is that you troubleshoot the predominant issue, not just the root cause of an unrelated issue or something that is a lower-priority issue.
If you want to clear the currently accumulated wait-type statistics, you can then run the following query:
DBCC SQLPERF ('sys.dm_os_wait_stats', CLEAR);
Clearing the wait-type statistics allows you to later provide a delta of accumulated wait statistics based on a defined period of time.
How It Works
This recipe demonstrated using the sys.dm_os_wait_stats DMV to help determine what the predominant wait stats were for the SQL Server instance.
The SELECT clause chose the wait type and wait time (in milliseconds) columns:
SELECT  TOP 2
wait_type, wait_time_ms FROM sys.dm_os_wait_stats
Since not all wait types are necessarily indicators of real issues, the WHERE clause was used to filter out nonexternal or nonresource waits (although this isn’t a definitive list of those wait types you would need to filter out). See the following:
WHERE wait_type NOT IN
('LAZYWRITER_SLEEP', 'SQLTRACE_BUFFER_FLUSH', 'REQUEST_FOR_DEADLOCK_SEARCH', 'LOGMGR_QUEUE'
, 'CHECKPOINT_QUEUE', 'CLR_AUTO_EVENT','WAITFOR', 'BROKER_TASK_STOP', 'SLEEP_TASK', 'BROKER_TO_FLUSH'
,'HADR_FILESTREAM_IOMGR_IOCOMPLETION','SQLTRACE_INCREMENTAL_FLUSH_SLEEP','QDS_CLEANUP_STALE_QUERIES_TASK_MAIN_LOOP_SLEEP'
,'DIRTY_PAGE_POLL','XE_TIMER_EVENT','QDS_PERSIST_TASK_MAIN_LOOP_SLEEP')
ORDER BY wait_time_ms DESC;
The DMV’s data is grouped at the instance level, not at the database level, so it is a good first step in your performance troubleshooting mission. It is not your end-all be-all solution, but rather a very useful tool for helping point you in the right direction when troubleshooting a poorly defined performance issue. This DMV also comes in handy for establishing trends over time. If a new wait type arises, it may be a leading indicator of a new performance issue.
22-8. Identifying I/O Contention by Database and File
Problem
Assume for a moment that you queried sys.dm_os_wait_stats and found that most of your waits are attributed to I/O. Since the wait stats are scoped at the SQL Server instance level, you now need to identify which databases are experiencing the highest amount of I/O contention.
One method you can use to determine which databases have the highest number of read, write, and I/O stall behaviors is the sys.dm_io_virtual_file_stats DMV (this DMV shows data that is equivalent to the fn_virtualfilestats function).
This recipe demonstrates viewing database I/O statistics, ordered by I/O stalls. I/O stalls are measured in milliseconds and represent the total time users had to wait for read or write I/O operations to complete on a file since the instance was last restarted or the database was created:
USE master;
GO
SELECT DB_NAME(ifs.database_id) AS DBName,
ifs.file_id AS FileID,
mf.type_desc AS FileType,
io_stall AS IOStallsMs,
size_on_disk_bytes AS FileBytes,
num_of_bytes_written AS BytesWritten,
num_of_bytes_read AS BytesRead,
io_stall_queued_read_ms AS RGStallReadMS,
io_stall_queued_write_ms AS RGStallWriteMS
FROM sys.dm_io_virtual_file_stats(NULL, NULL) ifs
    Inner Join sys.master_files mf
        On ifs.database_id = mf.database_id
        And ifs.file_id = mf.file_id
ORDER BY io_stall DESC;
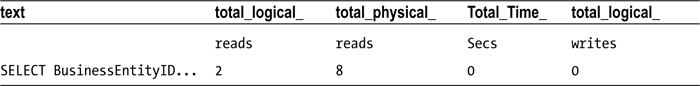
This query returns (your results will vary):
How It Works
This recipe demonstrated using the sys.dm_io_virtual_file_stats DMV to return statistics about each database and file on the SQL Server instance. This DMV takes two input parameters: the first is the database ID, and the second is the file ID. Designating NULL for the database ID shows results for all databases. Designating NULL for the file ID results in showing all files for the database.
In this recipe, I designated that all databases and associated files be returned:
FROM sys.dm_io_virtual_file_stats(NULL, NULL)
I also ordered the I/O stalls in descending order so as to see the files with the most I/O delay activity first:
ORDER BY io_stall DESC
These results showed that the highest number of stalls were seen on file ID 1 for the AdventureWorks2014 database, which in this example is one of the data files. If you have identified that I/O is the predominant performance issue, using sys.dm_io_virtual_file_stats is an efficient method for narrowing down which databases and files should be the focus of your troubleshooting efforts.
This recipe also introduced two new fields that are new as of SQL Server 2014: io_stall_queued_read_ms and io_stall_queued_write_ms. These fields will help determine the latency that is attributed to the use of Resource Governor. Resource governor will be discussed in more detail later in this chapter in other recipes.
The next several recipes detail techniques that don’t cleanly fall under any of the previous sections in this chapter. These recipes will demonstrate how to do the following:
- Employ an alternative to dynamic SQL and stored procedures using the sp_executesql system stored procedure
- Force a query to use a specified query plan
- Apply query hints to an existing query without having to actually modify the application’s SQL code using plan guides
- Create a plan guide based on a pointer to the cached plan
- Check the validity of a plan guide (in case reference objects have rendered the plan invalid)
- Force parameterization of a nonparameterized query
- Use the Resource Governor feature to limit query resource consumption (for both CPU and memory)
I’ll start this section by describing an alternative to using dynamic SQL.
22-9. Parameterizing Ad Hoc Queries
You have an application that performs queries using dynamic SQL and ad hoc queries. You are required to provide a means of preventing SQL injection for use by this application.
Solution
If stored procedures are not an option for your application, an alternative, the sp_executesql system stored procedure, addresses the dynamic SQL performance issue by allowing you to create and use a reusable query execution plan where the only items that change are the query parameters. Parameters are also type safe, meaning you cannot use them to hold unintended data types. This is a worthy solution when given a choice between ad hoc statements and stored procedures.
Using the EXECUTE command, you can execute the contents of a character string within a batch, procedure, or function. You can also abbreviate EXECUTE to EXEC.
For example, the following statement performs a SELECT from the Sales.Currency table:
EXEC ('SELECT CurrencyCode FROM Sales.Currency')
Although this technique allows you to dynamically formulate strings that can then be executed, this technique has some major hazards. The first and most concerning hazard is the risk of SQL injection. SQL injection occurs when harmful code is inserted into an existing SQL string prior to it being executed on the SQL Server instance. Allowing user input into variables that are concatenated to a SQL string and then executed can cause all sorts of damage to your database (not to mention the potential privacy issues). The malicious code, if executed under a context with sufficient permissions, can drop tables, read sensitive data, or even shut down the SQL Server process.
The second issue with character-string execution techniques concerns their performance. Although the performance of dynamically generated SQL may sometimes be fast, the query performance can also be unreliable. Unlike with stored procedures, dynamically generated and regular ad hoc SQL batches and statements will cause SQL Server to generate a new execution plan each time they are run.
![]() Caution sp_executesql addresses some performance issues but does not entirely address the SQL injection issue. Beware of allowing user-passed parameters that are concatenated into a SQL string! Stick with the parameter functionality described next.
Caution sp_executesql addresses some performance issues but does not entirely address the SQL injection issue. Beware of allowing user-passed parameters that are concatenated into a SQL string! Stick with the parameter functionality described next.
The syntax for sp_executesql is as follows:
sp_executesql [ @stmt = ] stmt
[
        {,  [@params=] N'@parameter_name data_type [ OUT | OUTPUT ][,...n]' }
        {, [ @param1 = ] 'value1' [ ,...n ] }
]

 sp_executesql [ (@stmt = ] stmt [
{, [|@params=] N'@parameter_name data_type [ OUT | OUTPUT ][,...n]' } {, [ (@param1 = ] 'value1' [ ,...n ] } ]
Table 22-1 describes the arguments of this command.
Table 22-1. sp_executesql Arguments
|
Argument |
Description |
|---|---|
|
stmt |
The string to be executed |
|
@parameter_name data_type [ [ OUTPUT ][,...n] |
One or more parameters that are embedded in the string statement. OUTPUT is used similarly to a stored procedure OUTPUT parameter. |
|
'value1' [ ,...n ] |
The actual values passed to the parameters |
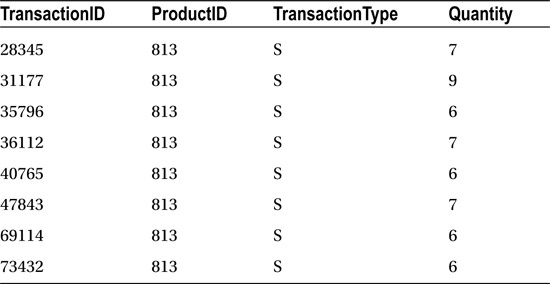
In this example, the Production.TransactionHistoryArchive table is queried based on a specific ProductID, TransactionType, and minimum Quantity values:
USE AdventureWorks2014;
GO
EXECUTE sp_executesql N'SELECT TransactionID, ProductID, TransactionType, Quantity FROM Production.TransactionHistoryArchive WHERE   ProductID = @ProductID AND
TransactionType = @TransactionType AND Quantity > @Quantity', N'@ProductID int, @TransactionType char(1), @Quantity int', @ProductID =813, @TransactionType = 'S', @Quantity = 5
;
This returns the following results (your results will vary):
How It Works
The sp_executesql procedure allows you to execute a dynamically generated Unicode string. This system stored procedure allows parameters, which in turn allow SQL Server to reuse the query execution plan generated by its execution.
Notice in the recipe that the first parameter was preceded with the N' Unicode prefix, because sp_executesql requires a Unicode statement string. The first parameter also included the SELECT query itself, as well as the parameters embedded in the WHERE clause:
USE AdventureWorks2014;
GO
EXECUTE sp_executesql N'SELECT TransactionID, ProductID, TransactionType, Quantity FROM Production.TransactionHistoryArchive WHERE ProductID = @ProductID AND
TransactionType = @TransactionType AND Quantity > @Quantity',
The second argument further defined the data type of each parameter that was embedded in the first parameter’s SQL statement. Each parameter is separated by a comma:
N'@ProductID int,
@TransactionType char(1),
@Quantity int',
The last argument assigned each embedded parameter a value, which was put into the query dynamically during execution:
@ProductID =813,
@TransactionType = 'S',
@Quantity = 5
The query returned eight rows based on the three parameters provided. If the query is executed again, but with different parameter values, it is likely that the original query execution plan will be used by SQL Server (instead of a new execution plan being created).
22-10. Forcing the Use of a Query Plan
You suspect that a less than optimal query plan is being used for a poorly performing query. You want to test the query by using different query plans.
Solution
The USE PLAN command allows you to force the query optimizer to use an existing, specific query plan for a SELECT query. You can use this functionality to override SQL Server’s choice in those rare circumstances when SQL Server chooses a less efficient query plan over one that is more efficient. Like plan guides (covered later), this option should be used only by an experienced SQL Server professional, because SQL Server’s query optimizer usually makes good decisions when deciding whether to reuse or create new query execution plans. The syntax for USE PLAN is as follows:
USE PLAN N'xml_plan'
The xml_plan parameter is the XML data-type representation of the stored query execution plan. The specific XML query plan can be derived using several methods, including SET SHOWPLAN_XML, SET STATISTICS XML, the sys.dm_exec_query_plan DMV, sys.dm_exec_text_query_plan, and via SQL Server Profiler’s Showplan XML events.
In this example, SET STATISTICS XML is used to extract the XML-formatted query plan for use in the USE PLAN command:
SET STATISTICS XML ON;
GO
USE AdventureWorks2014;
GO
SELECT TOP 10 Rate
FROM HumanResources.EmployeePayHistory
ORDER BY Rate DESC
SET STATISTICS XML OFF;
The XML document results returned from SET STATISTICS XML are then copied to the next query. Note that all the single quotes (') in the XML document have to be escaped with an additional single quote (except for the quotes used for USE PLAN):
USE AdventureWorks2014;
GO
SELECT TOP 10 Rate
FROM HumanResources.EmployeePayHistory
ORDER BY Rate DESC
OPTION (USE PLAN
'<ShowPlanXML xmlns="http://schemas.microsoft.com/sqlserver/2004/07/showplan" Version="1.2" Build="12.0.2000.8">
  <BatchSequence>
    <Batch>
      <Statements>
        <StmtSimple StatementText="SELECT TOP 10 Rate
FROM HumanResources.EmployeePayHistory
ORDER BY Rate DESC" StatementId="1" StatementCompId="1" StatementType="SELECT" RetrievedFromCache="true" StatementSubTreeCost="0.019825" StatementEstRows="10" StatementOptmLevel="TRIVIAL" QueryHash="0xF837F06798E85035" QueryPlanHash="0x65B8DEE1A2B5457C" CardinalityEstimationModelVersion="120">
          <StatementSetOptions QUOTED_IDENTIFIER="true" ARITHABORT="true" CONCAT_NULL_YIELDS_NULL="true" ANSI_NULLS="true" ANSI_PADDING="true" ANSI_WARNINGS="true" NUMERIC_ROUNDABORT="false" />
          <QueryPlan DegreeOfParallelism="1" MemoryGrant="1024" CachedPlanSize="16" CompileTime="0" CompileCPU="0" CompileMemory="96">
            <MemoryGrantInfo SerialRequiredMemory="16" SerialDesiredMemory="24" RequiredMemory="16" DesiredMemory="24" RequestedMemory="1024" GrantWaitTime="0" GrantedMemory="1024" MaxUsedMemory="16" />
            <OptimizerHardwareDependentProperties EstimatedAvailableMemoryGrant="30720" EstimatedPagesCached="15360" EstimatedAvailableDegreeOfParallelism="4" />
            <RelOp NodeId="0" PhysicalOp="Sort" LogicalOp="TopN Sort" EstimateRows="10" EstimateIO="0.0112613" EstimateCPU="0.00419345" AvgRowSize="15" EstimatedTotalSubtreeCost="0.019825" Parallel="0" EstimateRebinds="0" EstimateRewinds="0" EstimatedExecutionMode="Row">
              <OutputList>
                <ColumnReference Database="[AdventureWorks2014]" Schema="[HumanResources]" Table="[EmployeePayHistory]" Column="Rate" />
              </OutputList>
              <MemoryFractions Input="1" Output="1" />
              <RunTimeInformation>
                <RunTimeCountersPerThread Thread="0" ActualRows="10" ActualRebinds="1" ActualRewinds="0" ActualEndOfScans="1" ActualExecutions="1" />
              </RunTimeInformation>
              <TopSort Distinct="0" Rows="10">
                <OrderBy>
                  <OrderByColumn Ascending="0">
                    <ColumnReference Database="[AdventureWorks2014]" Schema="[HumanResources]" Table="[EmployeePayHistory]" Column="Rate" />
                  </OrderByColumn>
                </OrderBy>
                <RelOp NodeId="1" PhysicalOp="Clustered Index Scan" LogicalOp="Clustered Index Scan" EstimateRows="316" EstimateIO="0.00386574" EstimateCPU="0.0005046" AvgRowSize="15" EstimatedTotalSubtreeCost="0.00437034" TableCardinality="316" Parallel="0" EstimateRebinds="0" EstimateRewinds="0" EstimatedExecutionMode="Row">
                  <OutputList>
                    <ColumnReference Database="[AdventureWorks2014]" Schema="[HumanResources]" Table="[EmployeePayHistory]" Column="Rate" />
                  </OutputList>
                  <RunTimeInformation>
                    <RunTimeCountersPerThread Thread="0" ActualRows="316" ActualEndOfScans="1" ActualExecutions="1" />
                  </RunTimeInformation>
                  <IndexScan Ordered="0" ForcedIndex="0" ForceScan="0" NoExpandHint="0" Storage="RowStore">
                    <DefinedValues>
                      <DefinedValue>
                        <ColumnReference Database="[AdventureWorks2014]" Schema="[HumanResources]" Table="[EmployeePayHistory]" Column="Rate" />
                      </DefinedValue>
                    </DefinedValues>
                    <Object Database="[AdventureWorks2014]" Schema="[HumanResources]" Table="[EmployeePayHistory]" Index="[PK_EmployeePayHistory_BusinessEntityID_RateChangeDate]" IndexKind="Clustered" Storage="RowStore" />
                  </IndexScan>
                </RelOp>
              </TopSort>
            </RelOp>
          </QueryPlan>
        </StmtSimple>
      </Statements>
    </Batch>
  </BatchSequence>
</ShowPlanXML>'),
How It Works
USE PLAN allows you to capture the XML format of a query’s execution plan and then force the query to use it on subsequent executions. In this recipe, I used SET STATISTICS XML ON to capture the query’s XML execution plan definition. That definition was then copied into the OPTION clause. The USE PLAN hint requires a Unicode format, so the XML document text was prefixed with an N'.
Both USE PLAN and plan guides should be used only as a last resort after you have thoroughly explored other possibilities, such as query design, indexing, database design, index fragmentation, and out-of-date statistics. USE PLAN may have short-term effectiveness, but as data changes, so too will the needs of the query execution plan. In the end, the odds are that, over time, SQL Server will be better able, than you, to dynamically decide on the correct SQL plan. Nevertheless, Microsoft provided this option for those advanced troubleshooting cases when SQL Server doesn’t choose a query execution plan that’s good enough.
22-11. Applying Hints Without Modifying a SQL Statement
You are experiencing performance issues in a database in which you are not permitted to make code changes.
Solution
As was discussed at the beginning of this chapter, troubleshooting poor query performance involves reviewing many areas, such as database design, indexing, and query construction. You can make modifications to your code, but what if the problem is with code that you cannot change?
If you are encountering issues with a database and/or queries that are not your own to change (in shrink-wrapped software, for example), then your options become more limited. In the case of third-party software, you are usually restricted to adding new indexes or archiving data from large tables. Making changes to the vendor’s actual database objects or queries is most likely off-limits.
SQL Server provides a solution to this common issue that uses plan guides. Plan guides allow you to apply hints to a query without having to change the actual query text sent from the application.
Plan guides can be applied to specific queries that are embedded within database objects (stored procedures, functions, triggers) or to specific stand-alone SQL statements.
A plan guide is created using the sp_create_plan_guide system stored procedure:
sp_create_plan_guide [ @name = ] N'plan_guide_name'
    ,  [  @stmt = ] N'statement_text'
    ,  [  @type = ] N' { OBJECT | SQL | TEMPLATE }'
    ,  [  @module_or_batch = ]
        {
        N'[ schema_name.]object_name'
        |  N'batch_text'
        |  NULL
        }
    ,  [  @params = ] { N'@parameter_name data_type [,...n ]' | NULL }
    ,  [  @hints = ] { N'OPTION ( query_hint [,...n ] ) ' | N'XML_showplan' | NULL }
Table 22-2 describes the arguments of this command.
Table 22-2. sp_create_plan_guide Arguments
|
Argument |
Description |
|---|---|
|
plan_guide_name |
This defines the name of the new plan guide. |
|
statement_text |
This specifies the SQL text identified for optimization. |
|
OBJECT | SQL | TEMPLATE |
When OBJECT is selected, the plan guide will apply to the statement text found within a specific stored procedure, function, or DML trigger. When SQL is selected, the plan guide will apply to statement text found in a stand-alone statement or batch. The TEMPLATE option is used to either enable or disable parameterization for a SQL statement. Note that the PARAMETERIZATION option, when set to FORCED, increases the chance that a query will become parameterized, allowing it to form a reusable query execution plan. SIMPLE parameterization, however, affects a smaller number of queries (at SQL Server’s discretion). The TEMPLATE option is used to override a database’s SIMPLE or FORCED parameterization option. If a database is using SIMPLE parameterization, you can force a specific query statement to be parameterized. If a database is using FORCED parameterization, you can force a specific query statement to not be parameterized. |
|
N'[schema_name.]object_name' | N'batch_text' | NULL |
This specifies the name of the object the SQL text will be in, the batch text, or NULL, when TEMPLATE is selected. |
|
N'@parameter_name data_type [,...n ]' | NULL N'OPTION ( query_hint [,...n ] )' | N'XML_showplan' | NULL |
This defines the name of the parameters to be used for either SQL or TEMPLATE plan guide types. This defines the hint or hints to be applied to the statement, the XML query plan to be applied, or NULL, which is used to indicate that the OPTION clause will not be employed for a query. |
![]() Note In SQL Server 2014, the @hints argument accepts XML Showplan output as direct input.
Note In SQL Server 2014, the @hints argument accepts XML Showplan output as direct input.
To remove or disable a plan guide, use the sp_control_plan_guide system stored procedure:
sp_control_plan_guide [ @operation = ] N'<control_option>'
    [  ,  [  @name = ] N'plan_guide_name' ]

<control_option>::=
{
        DROP
    |  DROP ALL
    |  DISABLE
    |  DISABLE ALL
    |  ENABLE
    |  ENABLE ALL
}
Table 22-3 describes the arguments of this command.
Table 22-3. sp_control_plan_guide Arguments
|
Argument |
Description |
|---|---|
|
DROP |
The DROP operation removes the plan guide from the database. |
|
DROP ALL |
DROP ALL drops all plan guides from the database. |
|
DISABLE |
DISABLE disables the plan guide but doesn’t remove it from the database. |
|
DISABLE ALL |
DISABLE ALL disables all plan guides in the database. |
|
ENABLE |
ENABLE enables a disabled plan guide. |
|
ENABLE ALL |
ENABLE ALL does so for all disabled plan guides in the database. |
|
plan_guide_name |
plan_guide_name defines the name of the plan guide on which to perform the operation. |
In this recipe’s example, I’ll create a plan guide in order to change the table join type for a stand-alone query. In this scenario, assume the third-party software package is sending a query that is causing a LOOP join. In this scenario, I want the query to use a MERGE join instead.
![]() Caution SQL Server should almost always be left to make its own decisions regarding how a query is processed. Only under special circumstances (and only when administered by an experienced SQL Server professional) should plan guides be created in your SQL Server environment.
Caution SQL Server should almost always be left to make its own decisions regarding how a query is processed. Only under special circumstances (and only when administered by an experienced SQL Server professional) should plan guides be created in your SQL Server environment.
In this example, the following query is executed using sp_executesql:
USE AdventureWorks2014;
GO
EXEC sp_executesql
N'SELECT v.Name ,a.City
FROM Purchasing.Vendor v
INNER JOIN [Person].BusinessEntityAddress bea
ON bea.BusinessEntityID = v.BusinessEntityID
INNER JOIN Person.Address a
ON a.AddressID = bea.AddressID';;
Looking at a snippet of this query’s execution plan using SET STATISTICS XML ON shows that the Vendor and BusinessEntityAddress tables are joined together through the use of a nested loop operator.
<RelOp AvgRowSize="93" EstimateCPU="0.000440767" EstimateIO="0" EstimateRebinds="0" EstimateRewinds="0" EstimatedExecutionMode="Row" EstimateRows="105.447" LogicalOp="Inner Join" NodeId="0" Parallel="false" PhysicalOp="Nested Loops" EstimatedTotalSubtreeCost="0.323111">
If, for example, I want SQL Server to use a different join method, but without having to change the actual query sent by the application, I can enforce this change by creating a plan guide. The following plan guide is created to apply a join hint to the query being sent from the application:
USE AdventureWorks2014;
GO
EXEC sp_create_plan_guide
@name = N'Vendor_Query_Loop_to_Merge',
@stmt =
N'SELECT v.Name ,a.City
FROM Purchasing.Vendor v
INNER JOIN [Person].BusinessEntityAddress bea
ON bea.BusinessEntityID = v.BusinessEntityID
INNER JOIN Person.Address a
ON a.AddressID = bea.AddressID',
@type = N'SQL', @module_or_batch = NULL, @params = NULL, @hints = N'OPTION (MERGE JOIN)';
I can confirm that the plan guide was created (as well as confirm the settings) by querying the sys.plan_guides catalog view:
USE AdventureWorks2014;
GO
SELECT name, is_disabled, scope_type_desc, hints
FROM sys.plan_guides;
This query returns the following:

After creating the plan guide, I execute the query again using sp_executesql. Looking at the XML execution plan, I now see that the nested loop joins have changed into merge join operators—all without changing the actual query being sent from the application to SQL Server.
<RelOp AvgRowSize="93" EstimateCPU="0.0470214" EstimateIO="0" EstimateRebinds="0" EstimateRewinds="0" EstimatedExecutionMode="Row" EstimateRows="105.447" LogicalOp="Inner Join" NodeId="0" Parallel="false" PhysicalOp="Merge Join" EstimatedTotalSubtreeCost="0.495179">
In fact, all joins in the query were converted from loops to merge joins, which may not be a desired effect of designating the hint for a multijoin statement! If it is decided that this merge join is no longer more effective than a nested loop join, you can drop the plan guide using the sp_control_plan_guide system stored procedure, as follows:
USE AdventureWorks2014;
GO
EXEC sp_control_plan_guide N'DROP', N'Vendor_Query_Loop_to_Merge';
How It Works
Plan guides allow you to add query hints to a query being sent from an application without having to change the application itself. In this example, a particular SQL statement was performing nested loop joins. Without changing the actual query, SQL Server “sees” the plan guide and matches the incoming query to the query in the plan guide. When matched, the hints in the plan guide are applied to the incoming query.
The sp_create_plan_guide stored procedure allows you to create plans for stand-alone SQL statements, SQL statements within objects (procedures, functions, DML triggers), and SQL statements that are either being parameterized or not, because of the database’s PARAMETERIZATION setting.
In this recipe, the first parameter sent to sp_create_plan_guide was the name of the new plan guide:
USE AdventureWorks2014;
GO
EXEC sp_create_plan_guide
@name = N'Vendor_Query_Loop_to_Merge',
The second parameter was the SQL statement to apply the plan guide to (whitespace characters, comments, and semicolons will be ignored):
@stmt =
N'SELECT v.Name ,a.City
FROM Purchasing.Vendor v
INNER JOIN [Person].BusinessEntityAddress bea
ON bea.BusinessEntityID = v.BusinessEntityID
INNER JOIN Person.Address a
ON a.AddressID = bea.AddressID',
The third parameter was the type of plan guide, which in this case was stand-alone SQL:
@type = N'SQL',
For the fourth parameter, since it was not for a stored procedure, function, or trigger, the @module_or_batch parameter was NULL:
@module_or_batch = NULL,
The @params parameter was also sent NULL since this was not a TEMPLATE plan guide:
@params = NULL,
The last parameter contained the actual hint to apply to the incoming query—in this case forcing all joins in the query to use a MERGE operation:
@hints = N'OPTION (MERGE JOIN)'
Finally, the sp_control_plan_guide system stored procedure was used to drop the plan guide from the database, designating the operation of DROP in the first parameter and the plan guide name in the second parameter.
22-12. Creating Plan Guides from Cache
Problem
You are planning the migration of a database to a new server. You want to ensure that a particular query continues to perform the same on the new server as it does the current server.
Solution
In SQL Server (since SQL Server 2008), you have the ability to create plan guides based on existing query plans found in the query plan cache. You do this by using the sp_create_plan_guide_from_handle system stored procedure. Consider using this functionality under the following circumstances:
- You need a query plan (or plans) to remain stable after an upgrade or database migration.
- You have a specific query that uses a “bad” plan, and you want it to use a known “good” plan.
- Your application has mission-critical queries that have service-level agreements regarding specific response times, and you want to keep those times stable.
- You need to reproduce the exact query execution plan on another SQL Server instance (test or QA, for example).
- You have a query that needs to execute predictably but not necessarily perform as optimally as it always could.
![]() Caution You should almost always let SQL Server compile and recompile plans as needed instead of relying on plan guides. SQL Server can adapt to any new changes in the data distribution and objects referenced in the query by recompiling an existing plan when appropriate.
Caution You should almost always let SQL Server compile and recompile plans as needed instead of relying on plan guides. SQL Server can adapt to any new changes in the data distribution and objects referenced in the query by recompiling an existing plan when appropriate.
The syntax for the sp_create_plan_guide_from_handle system stored procedure is as follows:
sp_create_plan_guide_from_handle [ @name = ] N'plan_guide_name' , [ @plan_handle = ] plan_handle , [ [ @statement_start_offset = ] { statement_start_offset | NULL } ]
Table 22-4 describes the arguments of this command.
Table 22-4. sp_create_plan_guide_from_handle Arguments
|
Argument |
Description |
|---|---|
|
plan_guide_name |
This defines the name of the new plan guide. |
|
plan_handle |
This designates the plan handle from the sys.dm_exec_query_stats DMV. |
|
statement_start_offset | NULL |
The statement start offset designates the starting position within the query batch. If NULL, the query plan for each statement in the batch will have a plan guide created for it. |
This functionality allows you to preserve desired query plans for future reuse on the SQL Server instance. In this recipe, I’ll demonstrate creating a plan guide from the cache for the following query (which I will execute first in order to get a plan created in cache):
USE AdventureWorks2014;
GO
SELECT
p.Title,
p.FirstName,
p.MiddleName,
p.LastName
FROM HumanResources.Employee e
INNER JOIN Person.Person p
ON p.BusinessEntityID = e.BusinessEntityID
WHERE Title = 'Ms.';
GO
After executing the query, I can retrieve the plan handle pointing to the query plan in the cache by executing the following query:
USE AdventureWorks2014;
GO
SELECT plan_handle
FROM sys.dm_exec_query_stats qs
CROSS APPLY sys.dm_exec_sql_text(plan_handle) t
WHERE t.text LIKE 'SELECT%p.Title%'
AND t.text LIKE '%Ms%';
This query returns the following (your results will vary):
Plan_handle
0x06000800AEC42626F0F03B020100000001000000000000000000000000000000000000000000000000000000
Next, I will create a plan guide based on the plan handle (returned in the previous query) using the sp_create_plan_guide_from_handle system stored procedure:
EXEC sp_create_plan_guide_from_handle 'PlanGuide_EmployeeContact',
@plan_handle = 0x06000600AEC426269009DAFC0200000001000000000000000000000000000000000000000000000000000000,
@statement_start_offset = NULL;
Querying the sys.plan_handles system catalog view, I can confirm that the plan guide was created properly (results not displayed, because of the query plan and text display issues on the printed page). See here:
USE AdventureWorks2014;
GO
SELECT name, query_text, hints
FROM sys.plan_guides;
The hints column from sys.plan_guides actually contains the query execution plan in XML format.
![]() Tip You can confirm whether your plan guide is being successfully used by tracking the SQL Server Profiler events “Plan Guide Successful” and “Plan Guide Unsuccessful.”
Tip You can confirm whether your plan guide is being successfully used by tracking the SQL Server Profiler events “Plan Guide Successful” and “Plan Guide Unsuccessful.”
How It Works
This recipe demonstrated how to preserve an existing cached plan as a plan guide. This is the execution plan that will be used for the query matching the query text of the plan guide. Even after a SQL Server instance restart or the flushing of the procedure cache, the associated plan guide query plan will still be used.
I started off the recipe by executing the SELECT query so that a query plan would be cached on the SQL Server instance. After doing that, I can search for the plan handle of the cached plan by querying sys.dm_exec_query_stats. I also used CROSS APPLY with sys.dm_exec_sql_text so that I could search for text that contained the start and end of my query.
Once I had the plan handle, I executed the sp_create_plan_guide_from_handle system stored procedure. The first parameter was the name of the plan guide:
EXEC sp_create_plan_guide_from_handle 'PlanGuide_EmployeeContact',
The second parameter contains the plan handle (note that I could have placed the plan handle in a local variable and then fed it to the stored procedure in a single batch with the sys.dm_exec_query_stats query).
Lastly, I designated the statement start offset as NULL. This is because the cached plan contained only a single statement. If this were a multistatement batch, I could have used this parameter to designate the statement start offset number:
@statement_start_offset = NULL
Once the plan guide is created, any matching SQL that is executed will use the query execution plan designated in the plan guide (look at the hints column of the sys.plan_guides system catalog view to confirm). This allows you to keep a plan stable across several scenarios—for example, after a database migration to a new SQL Server instance, service pack upgrade, or version upgrade. Highly volatile query execution plans (recompiled often with varying execution plan performance impacts) can benefit from the “freezing” of the most efficient or best-performing plan for the associated query.
22-13. Checking the Validity of a Plan Guide
Problem
You want to confirm that existing plan guides are still valid after having made significant object changes in the database.
Solution
Use the system function sys.fn_validate_plan_guide, which allows you to check the validity of existing plan guides. SQL Server typically does a great job of compiling and recompiling query execution plans based on changes to objects referenced within a query. Plan guides, on the other hand, are not automatically modified based on changing circumstances.
The sys.fn_validate_plan_guide is a table-valued function that takes a single argument, the plan_guide_id. In this recipe, I demonstrate validating all plan guides within the database context I am interested in (for example, AdventureWorks2014):
USE AdventureWorks2014;
GO
SELECT pg.plan_guide_id, pg.name, v.msgnum,
v.severity, v.state, v.message
FROM sys.plan_guides pg
CROSS APPLY sys.fn_validate_plan_guide(pg.plan_guide_id) v;
If this query returns no rows, it means there are no errors with existing plan guides. If rows are generated, you will need to recreate a valid plan guide based on the changed circumstances.
How It Works
This recipe demonstrated how to check the validity of each plan guide in a specific database. The SELECT statement referenced the plan guide ID and name, along with the message number, severity, state, and message if errors exist:
SELECT pg.plan_guide_id, pg.name, v.msgnum, v.severity, v.state, v.message
The FROM clause included sys.plan_guides, which returns all plan guides for the database context:
FROM sys.plan_guides pg
Since this is a table-valued function expecting an input argument, I used CROSS APPLY against sys.fn_validate_plan_guide and used the plan guide from sys.plan_guides as input:
CROSS APPLY sys.fn_validate_plan_guide(pg.plan_guide_id) v
This query returns rows for any plan guides invalidated because of underlying object changes.
22-14. Parameterizing a Nonparameterized Query Using Plan Guides
You have been monitoring server health and have noticed that there is a very large query cache filled with nearly identical queries.
Solution
When I am evaluating the overall performance of a SQL Server instance, I like to take a look at the sys.dm_exec_cached_plans DMV to see what kind of plans are cached on the SQL Server instance. In particular, I’m interested in the objtype column and seeing whether the applications using the SQL Server instance are using mostly prepared statements, stored procedures, or ad hoc queries.
For applications that make heavy use of ad hoc queries, I’ll often see a very large query cache filled with nearly identical queries. For example, the following query shows the object type and associated query text:
USE AdventureWorks2014;
GO
SELECT cp.objtype, AdHocText
FROM sys.dm_exec_cached_plans cp
CROSS APPLY (SELECT text AS [processing-instruction(definition)]
            FROM sys.dm_exec_sql_text(cp.plan_handle) st
            WHERE st.text LIKE 'SELECT BusinessEntityID%'
            FOR XML PATH(''), TYPE
      ) AS st(AdHocText)
WHERE st.AdHocText IS NOT NULL;
GO
In my database, I see three rows returned.
objtype        AdHocText
Adhoc   SELECT BusinessEntityID
        FROMHumanResources.Employee
        WHERE NationalIDNumber = 509647174
Adhoc   SELECT BusinessEntityID
        FROM HumanResources.Employee
        WHERE NationalIDNumber = 245797967
Adhoc   SELECT BusinessEntityID
        FROM HumanResources.Employee
        WHERE NationalIDNumber = 295847284
Notice that each row is almost identical, except that the NationallDNumber value is different. Ideally, this form of query should be encapsulated in a stored procedure or be called using sp_executesql in order to prevent identical plans in the cache and to encourage plan reuse.
If you cannot control the form in which queries are called by the execution, one option you have is to use a plan guide to force parameterization of the query, which I will demonstrate in this recipe.
In Recipe 22-11, I introduced the sp_create_plan_guide system stored procedure. The TEMPLATE option in that procedure is used to override a database’s SIMPLE or FORCED parameterization option. If a database is using SIMPLE parameterization, you can force a specific query statement to be parameterized. If a database is using FORCED parameterization, you can force a specific query statement to not be parameterized.
The sp_get_query_template system stored procedure makes deploying template plan guides a little easier by taking a query and outputting the parameterized form of it for use by sp_create_ plan_guide. The syntax for this procedure is as follows:
sp_get_query_template
[ @querytext = ] N'query_text' , @templatetext OUTPUT , @parameters OUTPUT
Table 22-5 describes the arguments of this command.
Table 22-5. sp_get_query_template Arguments
|
Argument |
Description |
|---|---|
|
querytext |
The query you want to parameterize |
|
templatetext |
The output parameter containing the parameterized form of the query |
|
parameters |
The output parameter containing the list of parameter names and data types |
In this recipe, I’ll start by populating the template SQL and parameters using sp_get_query_template and then I will send these values to sp_create_plan_guide (I’ll walk through the code step by step in the “How It Works” section). See here:
DECLARE @sql  nvarchar(max) DECLARE @parms nvarchar(max)
EXEC sp_get_query_template
N'SELECT BusinessEntityID FROM HumanResources.Employee WHERE NationalIDNumber = 295847284',
@sql OUTPUT,
@parms OUTPUT;

EXEC sp_create_plan_guide N'PG_Employee_Contact_Ouery', @sql,
N'TEMPLATE', NULL, @parms, N'OPTION(PARAMETERIZATION FORCED)';
After the plan guide is created, I can execute three different versions of the same query (with three different values for NationalIDNumber—each executed separately and not as part of the same batch). See the following:
USE AdventureWorks2014;
GO
SELECT BusinessEntityID
        FROM HumanResources.Employee
        WHERE NationalIDNumber = 509647174;
GO
SELECT BusinessEntityID
        FROM HumanResources.Employee
        WHERE NationalIDNumber = 245797967;
GO
SELECT BusinessEntityID
        FROM HumanResources.Employee
        WHERE NationalIDNumber = 295847284;
GO
After executing these queries, I will check the cache to see whether there is a prepared plan for this query:
USE AdventureWorks2014;
GO
SELECT usecounts,objtype,PreparedText
FROM sys.dm_exec_cached_plans cp
CROSS APPLY (SELECT text AS [processing-instruction(definition)]
            FROM sys.dm_exec_sql_text(cp.plan_handle) st
            WHERE st.text LIKE '%SELECT BusinessEntityID%'
            FOR XML PATH(''), TYPE
      ) AS st(PreparedText)
WHERE st.PreparedText IS NOT NULL
AND objtype = 'Prepared';
This returns the number of times the prepared plan has been used (three times since the plan guide was created), the object type, and the parameterized SQL text.
|
usecounts |
objtype |
PreparedText |
|---|---|---|
|
3 |
Prepared |
(@0 int)Select BusinessEntityID from HumanResources.Employee WHERE NationalIDNumber = @0 |
How It Works
In this recipe, I demonstrated how to force parameterization for a single query. Near-identical queries such as the one I demonstrated can unnecessarily expand the cache, consuming memory and creating excessive compilation operations. By reducing compilation and encouraging the use of prepared plans, you can improve the performance of the query itself and reduce resource consumption on the SQL Server instance.
I started off by declaring two local variables to be used to hold the template SQL and associated parameters:
DECLARE @sql nvarchar(max)
DECLARE @parms nvarchar(max)
I then executed a call against the sp_get_query_template system stored procedure:
EXEC sp_get_query_template
The first parameter of this procedure expects the SQL to be converted to template format:
N'SELECT BusinessEntityID
FROM HumanResources.Employee
WHERE NationalIDNumber = 295847284',
The second parameter is used for the output parameter that will contain the template SQL:
@sql OUTPUT,
The third parameter is used for the output parameter containing the parameters used in association with the template SQL:
@parms OUTPUT
Next, I called sp_create_plan_guide to create a plan guide:
EXEC sp_create_plan_guide
The first parameter of this procedure took the name of the new plan guide:
N'PG_Employee_Contact_Ouery',
The second parameter took the value of the template SQL:
@sql,
The third parameter designated that this would be a TEMPLATE plan guide:
N'TEMPLATE',
The @module_or_batch parameter was given a NULL value, which is the required value for TEMPLATE plan guides:
NULL,
The next parameter contained the definition of all parameters associated with the template SQL:
@parms,
The last parameter designated the hints to attach to the query. In this case, I asked that the query use forced parameterization:
N'OPTION(PARAMETERIZATION FORCED)'
Once the plan guide was created, I executed the query in three different forms, each with a different NationalIDNumber literal value. I then checked sys.dm_exec_cached_plans to see whether there was a new row for a prepared plan. I confirmed that the usecounts column had a value of 3 (one for each query execution I had just performed), which helped me confirm that the newly parameterized prepared plan was being reused.
22-15. Limiting Competing Query Resource Consumption
You have various processes that regularly compete for CPU resources. You need to implement a solution that will limit the resource consumption of some of these processes.
Solution
Utilize the Resource Governor to constrain resource consumption for workloads. Resource Governor allows you to define resource pools that constrain the minimum and maximum CPU task-scheduling bandwidth and memory reserved.
![]() Tip CPU task scheduling is limited only when there is CPU contention across all available schedulers.
Tip CPU task scheduling is limited only when there is CPU contention across all available schedulers.
SQL Server provides two resource pools out of the box: default and internal. The internal resource pool, which cannot be modified, uses unrestricted resources for SQL Server ongoing process activity. The default resource pool is used for connections and requests prior to Resource Governor being configured, and by default it has no limitations on resources (although you can change this later).
You can create your own resource pools by using the CREATE RESOURCE POOL command. The syntax for this command is as follows:
CREATE RESOURCE POOL pool_name [ WITH
( [ MIN_CPU_PERCENT = value ]
[ [ , ] MAX_CPU_PERCENT = value ]
[ [ , ] CAP_CPU_PERCENT = value ]
[ [ , ] AFFINITY {SCHEDULER = AUTO | (Scheduler_range_spec)
      | NUMANODE = (NUMA_node_range_spec)} ]
[ [ , ] MIN_MEMORY_PERCENT = value ]
[ [ , ] MAX_MEMORY_PERCENT = value ] )]
[ [ , ] MIN_IOPS_PER_VOLUME = value ]
[ [ , ] MAX_IOPS_PER_VOLUME = value ]
Table 22-6 describes the arguments of this command.
Table 22-6. CREATE RESOURCE POOL Arguments
|
Argument |
Description |
|---|---|
|
Pool_name |
This defines the name of the resource pool. |
|
MIN_CPU_PERCENT = value |
When there is query contention, this defines a minimum guaranteed average CPU task-scheduling percentage, ranging from 0 to 100. |
|
MAX_CPU_PERCENT = value |
When there is query contention, this defines the maximum CPU task-scheduling percentage for all query requests in the resource pool. |
|
CAP_CPU_PERCENT = value |
This is a hard cap for CPU task-scheduling percentage that all requests in the resource pool will receive. This is a new option in SQL Server 2012. |
|
AFFINITY {SCHEDULER = AUTO | (Scheduler_range_spec) | NUMANODE = (NUMA_node_range_spec)} |
As of SQL Server 2012, this option allows you to specify schedulers for each resource pool. |
|
MIN_MEMORY_PERCENT = value |
This specifies the minimum percentage of reserved memory for the resource pool. |
|
MAX_MEMORY_PERCENT = value |
This specifies the maximum percentage of server memory that can be used for query requests in the pool. |
|
MIN_IOPS_PER_VOLUME =value |
This specifies the minimum boundary to reserve for IO operations (IOPS) per disk volume. Zero is the default. |
|
MAX_IOPS_PER_VOLUME =value |
This specifies the upper boundary to reserve for IO operations (IOPS) per disk volume. Zero is the default and specifies an unlimited threshold. |
Once you create one or more resource pools, you can then associate them with workload groups. One or more workload groups can be bound to a single resource pool. Workload groups allow you to define the importance of requests within the pool, maximum memory-grant percentage, maximum CPU time in seconds, maximum memory-grant time out, maximum degree of parallelism, and maximum number of concurrently executing requests. You can create resource pools using the CREATE WORKLOAD GROUP command. The syntax for this command is as follows:
CREATE WORKLOAD GROUP group_name
[  WITH
        (  [  IMPORTANCE = { LOW | MEDIUM | HIGH } ]
        [  [  ,  ]      REQUEST_MAX_MEMORY_GRANT_PERCENT = value ]
        [  [  ,  ]  REQUEST_MAX_CPU_TIME_SEC = value ]
        [  [  ,  ]      REQUEST_MEMORY_GRANT_TIMEOUT_SEC = value ]
        [  [  ,  ]  MAX_DOP = value ]
        [  [  ,  ]  GROUP_MAX_REQUESTS = value ] )]
[  USING { pool_name | "default" } ]
Table 22-7 describes the arguments of this command.
Table 22-7. CREATE WORKLOAD GROUP Arguments
|
Argument |
Description |
|---|---|
|
group_name |
Defines the name of the workload group |
|
IMPORTANCE = {LOW | MEDIUM | HIGH} |
Defines the importance of requests within the workload group. If two workloads share the same resource pool, the importance of each workload can determine which requests have a higher priority. |
|
REQUEST_MAX_MEMORY_GRANT_PERCENT = value |
Caps maximum memory a request can use from the resource pool |
|
REQUEST_MAX_CPU_TIME_SEC = value |
Caps maximum CPU time (seconds) a single request can use from the resource pool |
|
REQUEST_MEMORY_GRANT_TIMEOUT_SEC = value |
Caps maximum seconds a request will wait for memory before failing |
|
MAX_DOP = value |
Defines maximum degree of parallelism allowed for requests in the workload group |
|
GROUP_MAX_REQUESTS = value |
Caps concurrently executing requests in the workload group |
|
USING { pool_name | "default" } |
Designates to which pool the workload group will be bound |
![]() Note Multiple workload groups can be associated with a single resource pool, but a workload group cannot be associated with multiple resource pools.
Note Multiple workload groups can be associated with a single resource pool, but a workload group cannot be associated with multiple resource pools.
Just as there are the internal and default resource pools, there are also the internal and default workload groups. The default workload group is used for any requests that are not covered by the classifier user-defined function (a function that determines which pool a workload group’s incoming connections are assigned to, demonstrated later in this recipe).
After creating user-defined workload groups and binding them to resource pools, you can then create a single classifier user-defined function that will help determine which workload group an incoming SQL Server connection and request belongs to.
For example, if you have a SQL login named Sue, you can assign that login via the classifier function to belong to a specific workload group that is associated with a specific resource pool.
The classifier user-defined function is created in the master database and returns the workload group name that the incoming SQL Server connection will use. To activate the classifier for incoming connections, the ALTER RESOURCE GOVERNOR command is used, which I’ll demonstrate later in this recipe.
Beginning the recipe, let’s assume I have a SQL Server instance that is used by an application with two general types of activity. The first type of activity relates to the application. The application uses ongoing automated processes with specific connection qualities and must run reliably. The second type of activity comes from ad hoc query users. These are users who require periodic information about transactional activity, but getting that information must never hamper the performance of the main application. Granted, the best practice would be to separate this activity onto two SQL Server instances; however, if this isn’t possible, I can use Resource Governor to constrain resources instead.
I’ll start by creating two separate user-defined resource pools for the SQL Server instance. The first pool will be used for the high-priority application. I will make sure that this pool reserves at least 25% of CPU and memory during times of query contention:
USE master;
GO
CREATE RESOURCE POOL priority_app_queries WITH ( MIN_CPU_PERCENT = 25,
MAX_CPU_PERCENT = 75,
MIN_MEMORY_PERCENT = 25,
MAX_MEMORY_PERCENT = 75);
GO
Next, I will create a second resource pool that will be reserved for ad hoc queries. I will cap the maximum CPU and memory of these pools at 25% during times of high query contention in order to preserve resources for the previously created resource pool. This pool will also take advantage of one of the new options in SQL Server 2014 that will allow you to limit IO on queries during times of high query contention:
USE master;
GO
CREATE RESOURCE POOL ad_hoc_queries WITH ( MIN_CPU_PERCENT = 5,
MAX_CPU_PERCENT = 25,
MIN_MEMORY_PERCENT = 5,
MAX_MEMORY_PERCENT = 25,
MAX_IOPS_PER_VOLUME = 50);
GO
I can change the values of the resource pools using the ALTER RESOURCE POOL command. For example, I am now going to change the minimum memory for the ad hoc query pool to 10% and maximum memory to 50%:
USE master;
GO
ALTER RESOURCE POOL ad_hoc_queries
WITH ( MIN_MEMORY_PERCENT = 10, MAX_MEMORY_PERCENT = 50, MAX_IOPS_PER_VOLUME = 75);
GO
Once I have created the pools, I can now confirm the settings by using the sys.resource_ governor_resource_pools catalog view:
USE master;
GO
SELECT pool_id,name AS PoolName
,min_cpu_percent,max_cpu_percent
,min_memory_percent,max_memory_percent, max_iops_per_volume
FROM sys.resource_governor_resource_pools rp
WHERE rp.pool_id > 2;
GO
This query returns the following:
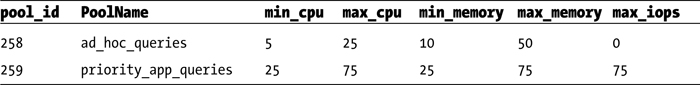
Now that I have created the resource pools, I can bind workload groups to them. In this case, I will start by creating a workload group for my highest-priority application connections. I will set this workload group to a high importance and be generous with the maximum memory-grant percentage and other arguments:
USE master;
GO
CREATE WORKLOAD GROUP application_alpha WITH
( IMPORTANCE = HIGH,
REQUEST_MAX_MEMORY_GRANT_PERCENT = 75,
REQUEST_MAX_CPU_TIME_SEC = 75,
REQUEST_MEMORY_GRANT_TIMEOUT_SEC = 120,
MAX_DOP = 8,
GROUP_MAX_REQUESTS = 8 ) USING priority_app_queries;
GO
Next, I will create another workload group that will share that same resource pool with application_alpha, but with a lower IMPORTANCE level and less generous resource consumption capabilities:
USE master;
GO
CREATE WORKLOAD GROUP application_beta WITH
( IMPORTANCE = LOW,
REQUEST_MAX_MEMORY_GRANT_PERCENT = 50,
REQUEST_MAX_CPU_TIME_SEC = 50,
REQUEST_MEMORY_GRANT_TIMEOUT_SEC = 360,
MAX_DOP = 1,
GROUP_MAX_REQUESTS = 4 ) USING priority_app_queries;
GO
I can modify the various limits of the workload group by using ALTER WORKLOAD GROUP. Here’s an example:
USE master;
GO
ALTER WORKLOAD GROUP application_beta WITH ( IMPORTANCE = MEDIUM);
GO
The prior two workload groups will share the same resource pool. I will now create one more workload group that will bind to the ad hoc resource pool I created earlier. This workload group will be able to use the maximum memory available to the ad hoc pool:
USE master;
GO
CREATE WORKLOAD GROUP adhoc_users WITH
( IMPORTANCE = LOW,
REQUEST_MAX_MEMORY_GRANT_PERCENT = 100,
REQUEST_MAX_CPU_TIME_SEC = 120,
REQUEST_MEMORY_GRANT_TIMEOUT_SEC = 360,
MAX_DOP = 1,
GROUP_MAX_REQUESTS = 5 ) USING ad_hoc_queries;
GO
Once finished, I can confirm the configurations of the workload groups by querying the sys.resource_governor_workload_groups catalog view:
USE master;
GO
SELECT name AS GrpName,
Importance AS impt,
request_max_memory_grant_percent AS max_m_g,
request_max_cpu_time_sec AS max_cpu_sec,
request_memory_grant_timeout_sec AS m_g_to,
max_dop,
group_max_requests AS max_req,
pool_id
FROM sys.resource_governor_workload_groups
WHERE pool_id > 2;
This query returns the following:
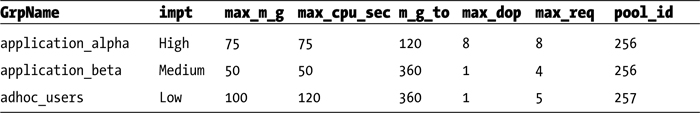
Now I am ready to create the classifier function. This function will be called for each new connection. The logic of this function will return the workload group where all connection requests will be sent. The classifier function can use several different connection-related functions for use in its logic, including HOST_NAME, APP_NAME, SUSER_NAME, SUSER_SNAME, IS_SRVROLEMEMBER, and IS_MEMBER.
![]() Caution Make sure this function is tuned properly and executes quickly.
Caution Make sure this function is tuned properly and executes quickly.
I create the following function that looks at the SQL Server login name and connection host name in order to determine which workload group the new connection should be assigned to:
USE master;
GO
CREATE FUNCTION dbo.RECIPES_classifier()
RETURNS sysname
WITH SCHEMABINDING
AS
BEGIN
DECLARE @resource_group_name sysname;
IF SUSER_SNAME() IN ('AppLoginl', 'AppLogin2')
    SET @resource_group_name = 'application_alpha';
IF SUSER_SNAME() IN ('AppLogin3', 'AppLogin4')
    SET @resource_group_name = 'application_beta';
IF HOST_NAME() IN ('Workstationl234', 'Workstation4235')
    SET @resource_group_name = 'adhoc_users';
-- If the resource group is still unassigned, use default
IF @resource_group_name IS NULL
    SET @resource_group_name = 'default';
RETURN @resource_group_name;
END
GO
Now that I’ve created the classifier function, I can activate it using ALTER RESOURCE GOVERNOR and the CLASSIFIER_FUNCTION argument:
USE master;
GO
-- Assign the classifier function
ALTER RESOURCE GOVERNOR
WITH (CLASSIFIER_FUNCTION = dbo.RECIPES_classifier);
GO
To enable the configuration, I must also execute ALTER RESOURCE GOVERNOR with the RECONFIGURE option:
USE master;
GO
ALTER RESOURCE GOVERNOR RECONFIGURE;
GO
I’ll validate the settings using the sys.resource_governor_configuration catalog view:
USE master;
GO
SELECT OBJECT_NAME(classifier_function_id,DB_ID('master')) FuncName,
is_enabled
FROM sys.resource_governor_configuration;
This query returns the following:
|
FuncName |
is_enabled |
|---|---|
|
RECIPES_classifier |
1 |
Incoming activity for new connections will now be routed to the appropriate workload groups and will use resources from their associated resource pools.
![]() Tip You can monitor the incoming request statistics for resource pools and workload groups using the sys.dm_resource_governor_resource_pools and sys.dm_resource_governor_workload_groups DMVs.
Tip You can monitor the incoming request statistics for resource pools and workload groups using the sys.dm_resource_governor_resource_pools and sys.dm_resource_governor_workload_groups DMVs.
To disable the settings, I can execute the ALTER RESOURCE GOVERNOR with the DISABLE argument:
USE master;
GO
ALTER RESOURCE GOVERNOR DISABLE;
GO
I can remove the user-defined workload groups and resource pools by executing DROP WORKLOAD GROUP and DROP RESOURCE POOL:
USE master;
GO
DROP WORKLOAD GROUP application_alpha;
DROP WORKLOAD GROUP application_beta;
DROP WORKLOAD GROUP adhoc_users;
DROP RESOURCE POOL ad_hoc_queries;
DROP RESOURCE POOL priority_app_queries;
I can also drop the classifier function once it is no longer being used:
USE master;
GO
ALTER RESOURCE GOVERNOR
WITH (CLASSIFIER_FUNCTION = NULL);
DROP FUNCTION dbo.RECIPES_classifier;
GO
How It Works
This recipe demonstrated how to use Resource Governor to allocate memory and CPU resources into separate user-defined resource pools. Once the resource pools were defined, I created workload groups, which in turn had associated limits within the confines of their assigned user-defined resource pool. I then created a classifier user-defined function, which was used to assign workload groups to incoming connection requests. This allowed me to limit the resources available to lower-priority requests to free up resources for higher-priority requests.
This functionality allows you to maintain significant control over SQL Server instances that have varying workload requirements and limited system resources. Even on systems with generous system resources, you can use Resource Governor to protect higher-priority workloads from being negatively impacted by lower-priority requests.