Security monitoring is the automated process of collecting and analyzing potential security threats and taking appropriate actions to create secure applications. Nowadays, more and more companies are entering the market with cloud adoptions. Monitoring this cloud workload is a must in order to create secure and safe applications.
The previous chapter took a quick tour of threat modelling and securing infrastructure deployment, including security testing, key management, and disaster recovery.
Setting up security policies
Advanced observability
Azure Monitor
Azure Sentinel
Setting Up Security Policies

A screenshot represents the policy definitions, initiative definitions, export definitions, refers, diagnostic settings sentinel, and diagnostic settings of security policies and initiatives.
Security policies and initiatives
Security policy: An Azure security policy is a rule about the specific security conditions that the security team wants to control. There are also various built-in definitions available to control what type of resources can be deployed or enforce tags on various resources. Apart from the built-in policies, you can also create custom security policies . See Figure 7-2.

A screenshot depicts the policy getting started, real time control and compliance assessment, assignment of policies in that view definitions, and assessment of compliance in the overview of security policies.
Overview of security policies
Security policy initiative: Azure policy initiative is a collection of policy definitions or rules that are grouped together for a specific goal. This simplifies the management of policies by grouping policies together into a single item. It also helps ensure the security requirements of the regulators. Figure 7-3 shows an example overview of the security initiatives .

A screenshot depicts the policy, initiative, export definitions, and refresh contains scope, definition type, and category as well as a name, definition location, and policies of the overview security initiative.
Overview of security initiative
With security initiatives, you can define the desired configurations of the workloads to ensure the security compliance of the company. You can use Azure Policy to manage policies and initiatives and assign them to subscriptions or management groups.
Security recommendations : Defender for cloud periodically analyzes the compliance status of the resources to identify potential security misconfigurations and weakness. Azure Defender for cloud also provides recommendations to fix these security issues. These recommendations mainly come by validating the policies against the resources that don't meet the requirements. See Figure 7-4.
- You can take required actions based on the recommendations from the Defender cloud. Each recommendation has the following information:
Short description
Steps to implement the recommendation
Impacted resources

A screenshot depicts the Microsoft defender for cloud recommendations, which contains a C S V report, open query, governance report, guides and feedback, active recommendations, and resource health.
Recommendations by Defender for cloud
Understand the current security situation
Effectively and efficiently improve the security

A screenshot represents the Microsoft defender for cloud, overview, security posture, 10 by 10 unassigned, and 0 by 0 overdue recommendations, secure score is 0 percent, azure, A W S, and G C P.
Posture score
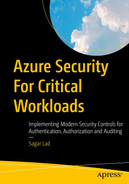
Once you open the overview page of Microsoft Defender for cloud, you can view the secure score for the security posture. The secure score is represented as a percentage.
A screenshot represents the azure environment, secure score N by A, the environment contains management groups 8, subscriptions 12, unhealthy resources 28 by 288, and recommendations 33.
Security posture details
Advanced Observability
In order to proactively monitor applications, you need to monitor resources to maintain security posture and check the vulnerabilities. You can enable alerts for suspicious activities to find security issues and events.
Use Azure Native tools to monitor the application, infrastructure, and workload
Create a security operations center or SecOps team
Monitor the traffic and access requests for the application
Identify and discover common risks to improve the security score in Microsoft Defender
Use industry standard protocols and benchmarks to improve the security posture of an organization
Send logs and alerts to the central log management system
Enable frequent internal and external audit compliance
Regularly test security design and implementation
Microsoft Defender for cloud : This is a cloud security posture management and cloud workload protection platform for on-premises as well as public cloud resources. See Figure 7-7.

Three model diagrams represent the continuous assessment, security, and defence of Microsoft Defender for the cloud lifecycle.
Microsoft Defender for cloud lifecycle
Defender for cloud secure score: It continuously assesses the security posture so that you can track and improve security efforts.
Defender for cloud recommendations: It secures the application or workload by providing step-by-step actions that can protect the application from known security risks.
Defender for cloud alerts: This defends your workload in real-time so your team can act immediately and prevent security events. See Figure 7-8.

A screenshot represents the Microsoft defender for cloud, overview, inventory, unmonitored V M s 0, total resources 439, unhealthy 210, healthy 42, and not applicable 187.
Microsoft Defender for cloud
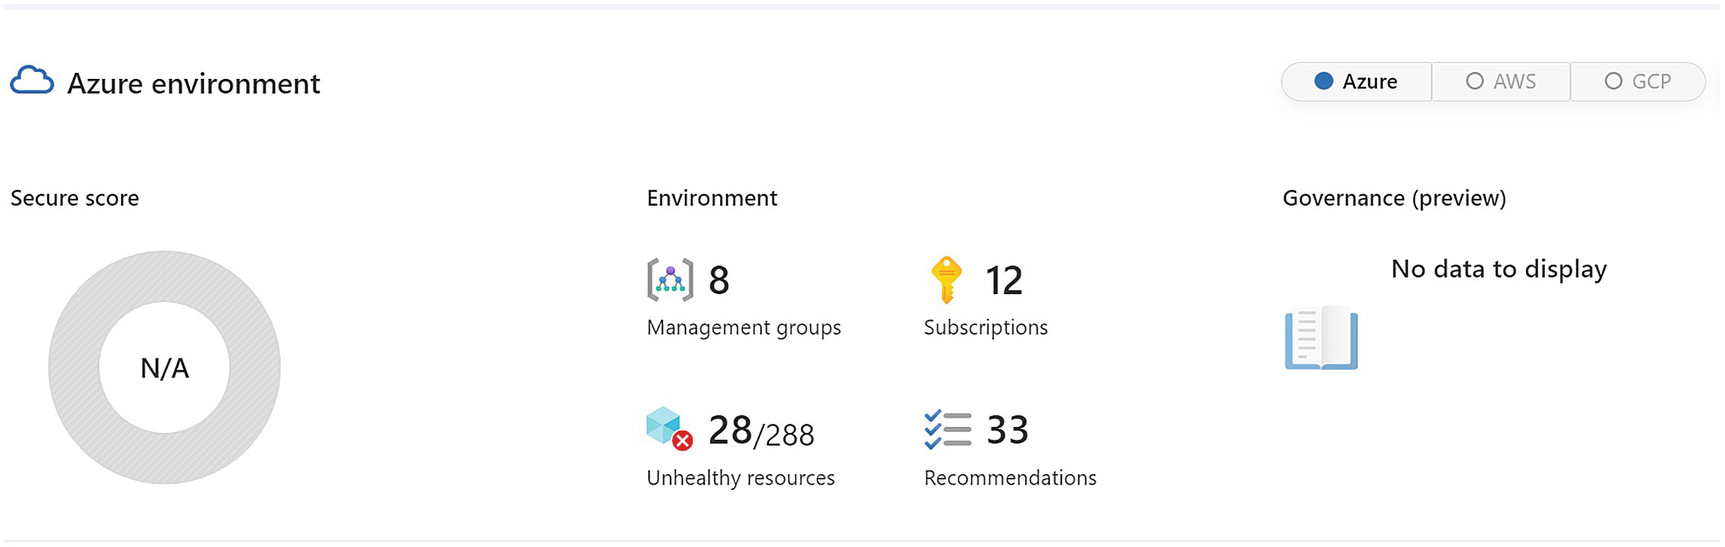
Microsoft Sentinel: Sentinel uses native security information event management (SIEM) and security orchestration solutions in Azure. It provides a bird’s eye view across the enterprise to monitor and detect volumes of alerts and resolution of the issues. See Figure 7-9.
A circular model reads, responds, collects, detects, and investigates Microsoft sentinel cloud native S I E M plus S O A R.
Microsoft Sentinel
Collect data at a scale
Detect undetected threats if any
Check threats with artificial intelligence
Act on the incidents rapidly
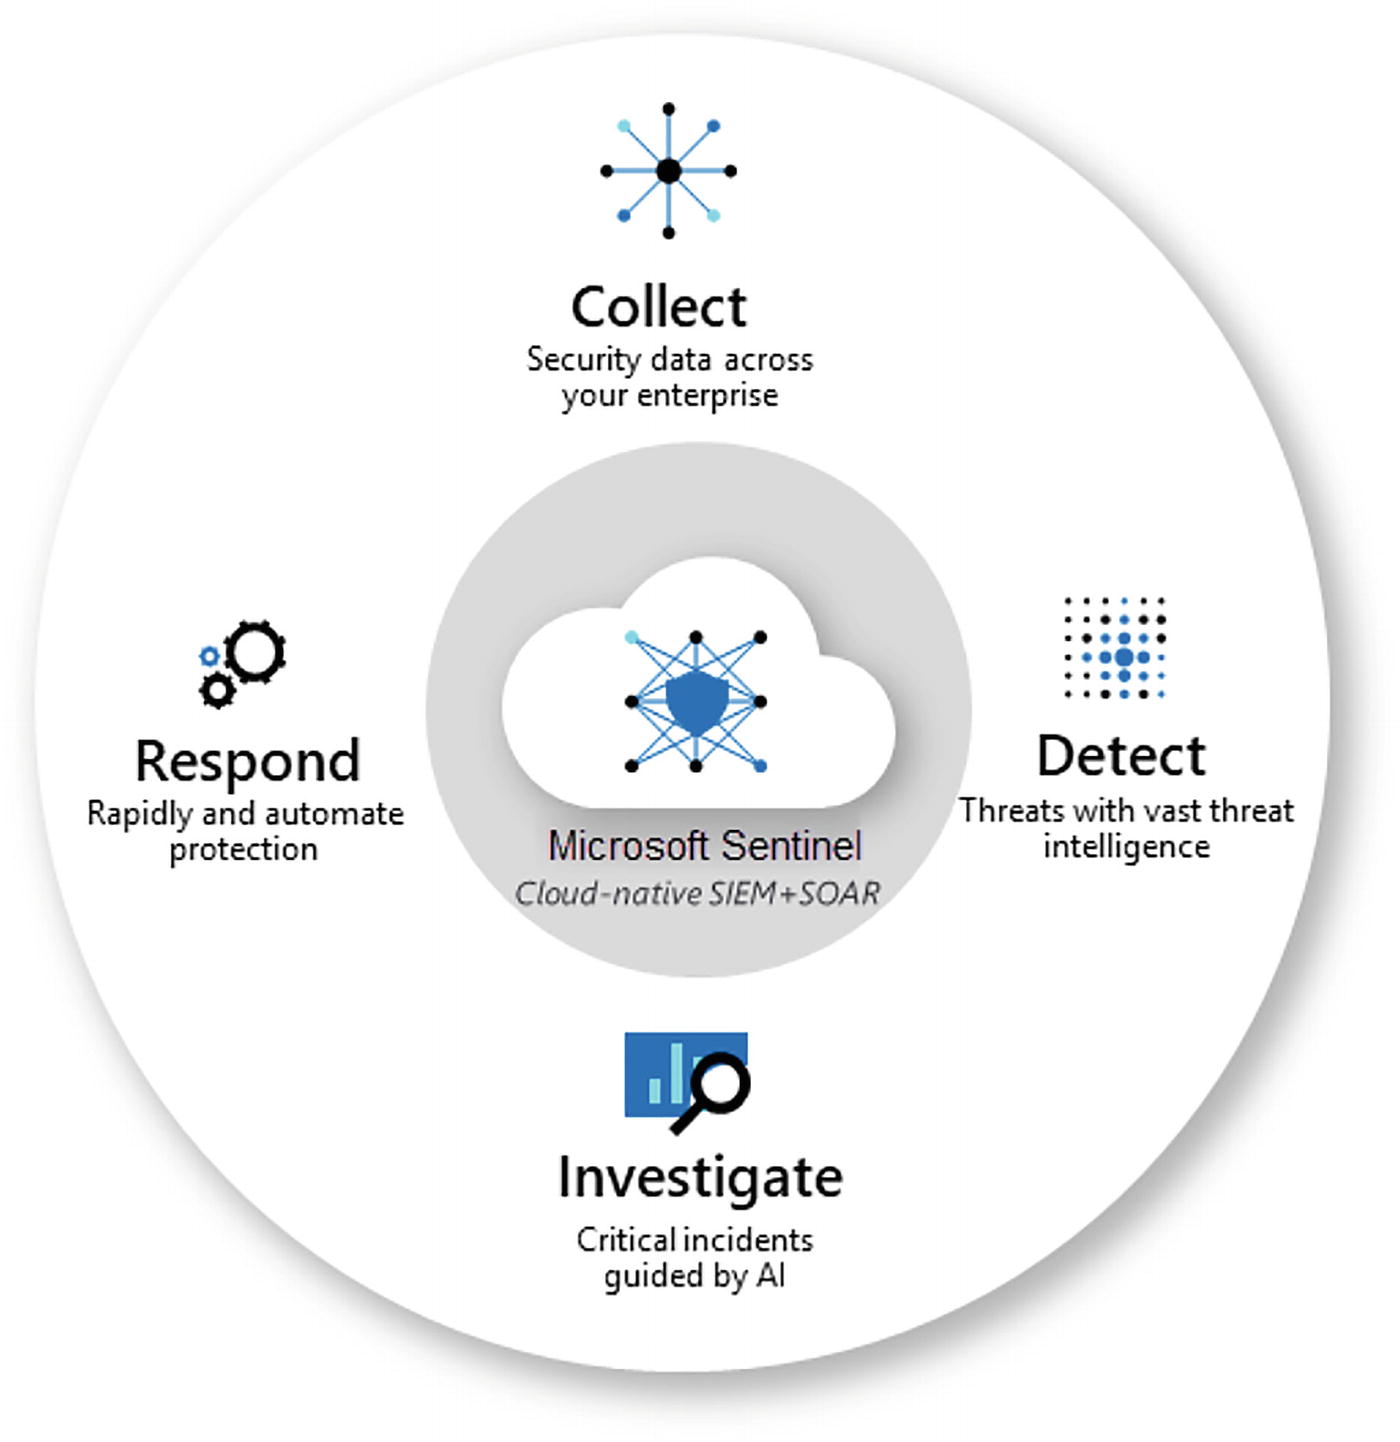
Azure DDOS protection , which mainly focuses on defending against distributed denial of service attacks; see Figure 7-10.
A screenshot represents the firewall manager, clear all filters, virtual networks, azure firewall policy, D D o S protection plan, and subscription is multiple select.
Azure DDOS Protection
Azure Rights Management : Protects files and emails across multiple devices.
Azure Governance Visualizer : Collects insights and information into the policies, and includes role-based access control, Azure blueprints, and subscriptions
IaaS and PaaS Security: In the IaaS model, you can create various infra services and they will be hosted on Azure. Microsoft Azure provides assurance that the resources will be isolated and security patches and updates will be done in a timely manner. In order to control this in a better manner, you can host the complete IaaS solution on-premises or in a data center. For example, you can create your own virtual network, storage, and host entities. You have a shared responsibility when you consider the reference of PaaS components . See Figure 7-11.

A model diagram depicts the P a a S, S a a S, and I a a S, which contain quickly deployed, unique apps, rapidly scalable, connected factories, customizable, enhanced flexibility, and lower overhead.
Azure PaaS/SaaS responsibility
Virtual machines : For Windows and Linux VMs , use Microsoft Defender to take the advantage of free services for missing OS patching, security misconfigurations, and network security. For example, virtual machines don’t have vulnerability scanning solutions to check for security threats. Microsoft Defender for servers watches network movement to and from these virtual machines.
Observability means how well you understand what is happening in the system by collecting logs, metrics, and traces. Observability in the cloud is very hard to achieve.
Azure Monitor

A model diagram depicts the data platform including metrics, logs, traces, experiences containing application, container, V M, network, visualize contains workbooks, dashboards, power B l, Grafana, and Analyze.
Azure Monitor: Applications
Metrics
Logs

A model diagram depicts the data platform including metrics, logs, traces, experiences containing application, container, V M, network, visualize contains workbooks, dashboards, power B l, Grafana, and Analyze.
Azure Monitor metrics and logs

An illustration of Azure monitor metrics explorer flows from azure resources, applications, virtual machine agents, data collector A P I to the logs database, log query, and finally to insights, dashboards, workbooks, log analytics, log alerts, and services.
Azure Monitor metrics explorer
Logs collected by Azure Monitor will be analyzed with queries to get, consolidate, and collect data. You can create and test queries using log analytics. You can use the kusto query language, which is similar to the SQL language, to log queries.
Application monitoring data: Collects data about the performance and functionality of the source code written on various Azure services.
Operating system logs: Collect all the logs of the guest operating system data running on Azure, on-premises, or on another public cloud.
Azure service monitoring data: Contains all the monitoring data from various Azure services.
Azure subscription monitoring data: Contains all data about the operation and management of the Azure subscription and related information. You can enable diagnostics to extend the data you collect by Azure Monitor. You can also enable logging with Application Insights to collect exceptions, requests, and page views. See Figure 7-15.
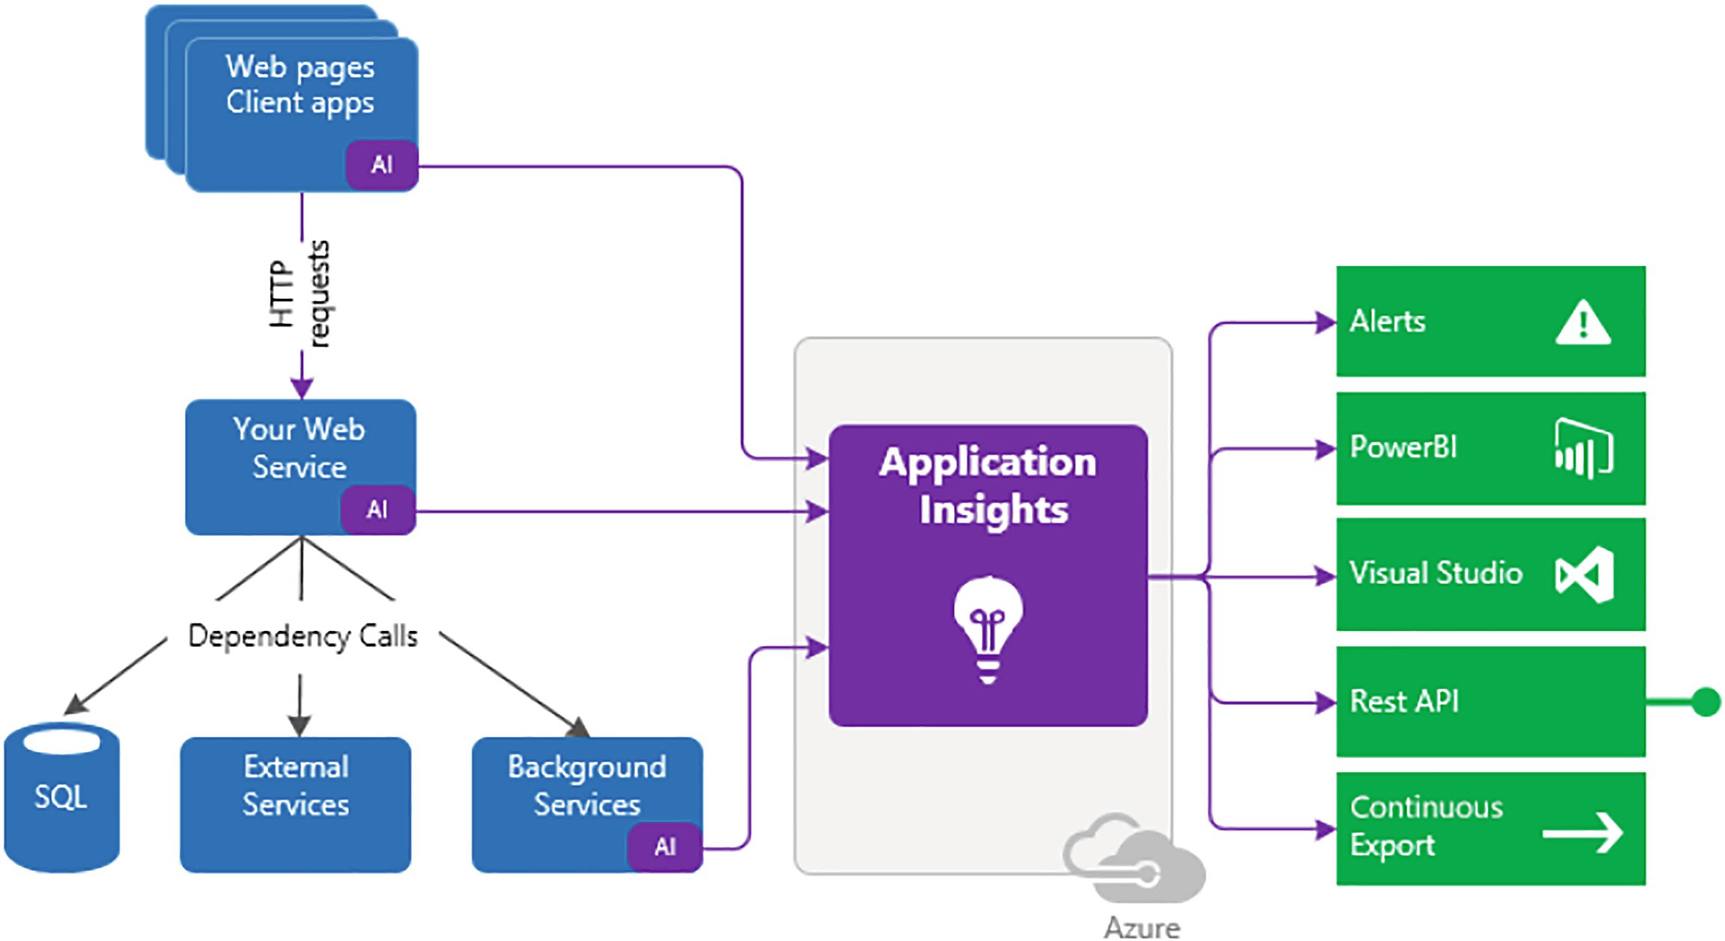
A flow diagram depicts the web page's client apps, your web service, S Q L, external, and background services to application insights to alerts, power B l, visual studio, rest A P I, and continuous export.
Application Insights
With Application Insights , you can monitor extensible application performance. Application Insights supports various platforms like .NET, Node.Js, Java, and Python. Application Insights can be used with on-premises or public cloud sources. You can also easily integrate application insights with DevOps processes.
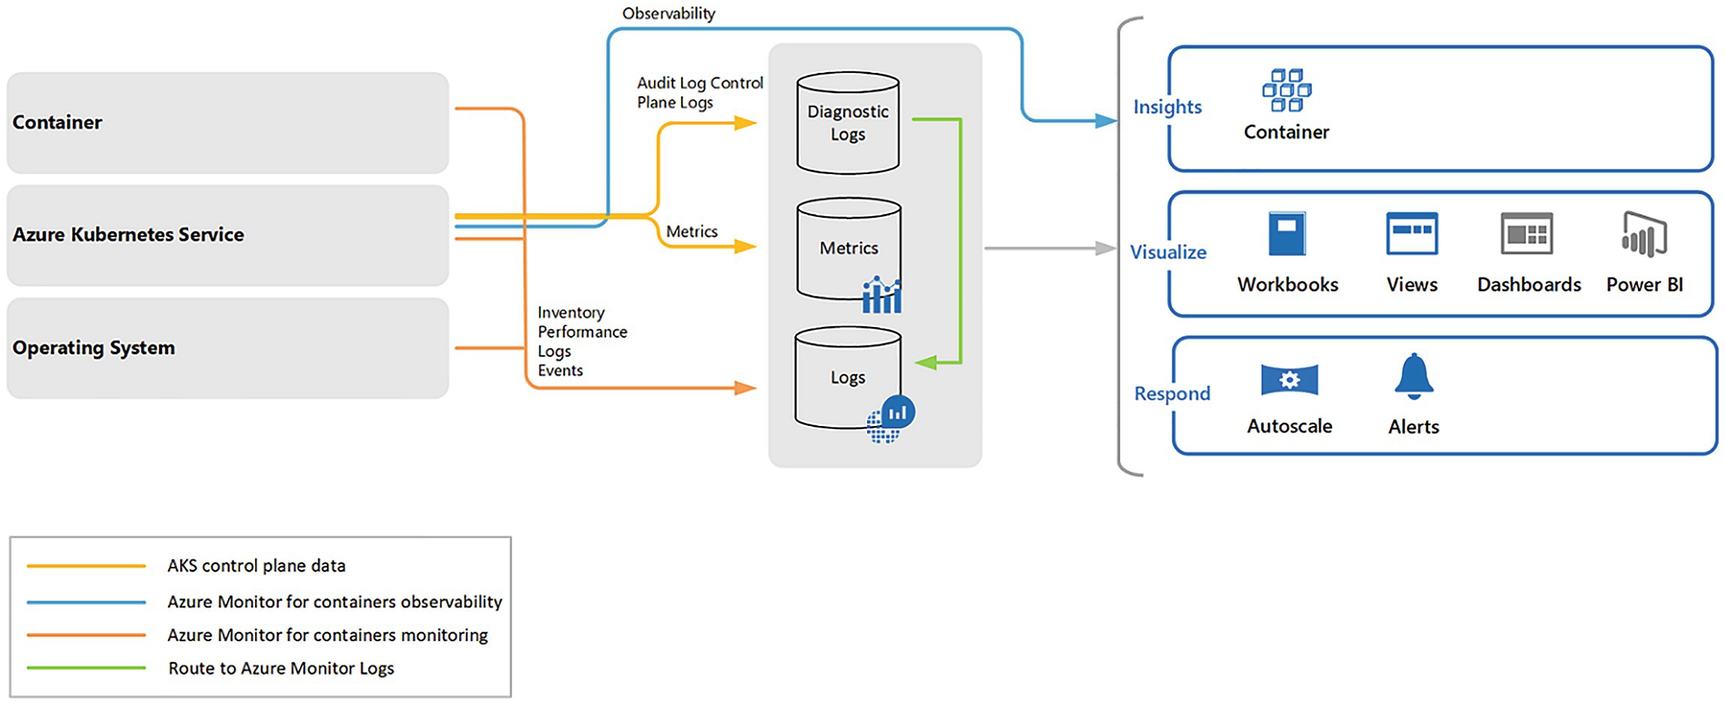
A model diagram depicts the container, operating system, observability, diagnostic, metrics, logs insights, visualize, respond, A K S control plane data, and azure monitor for containers observability and monitoring.
Container Insights
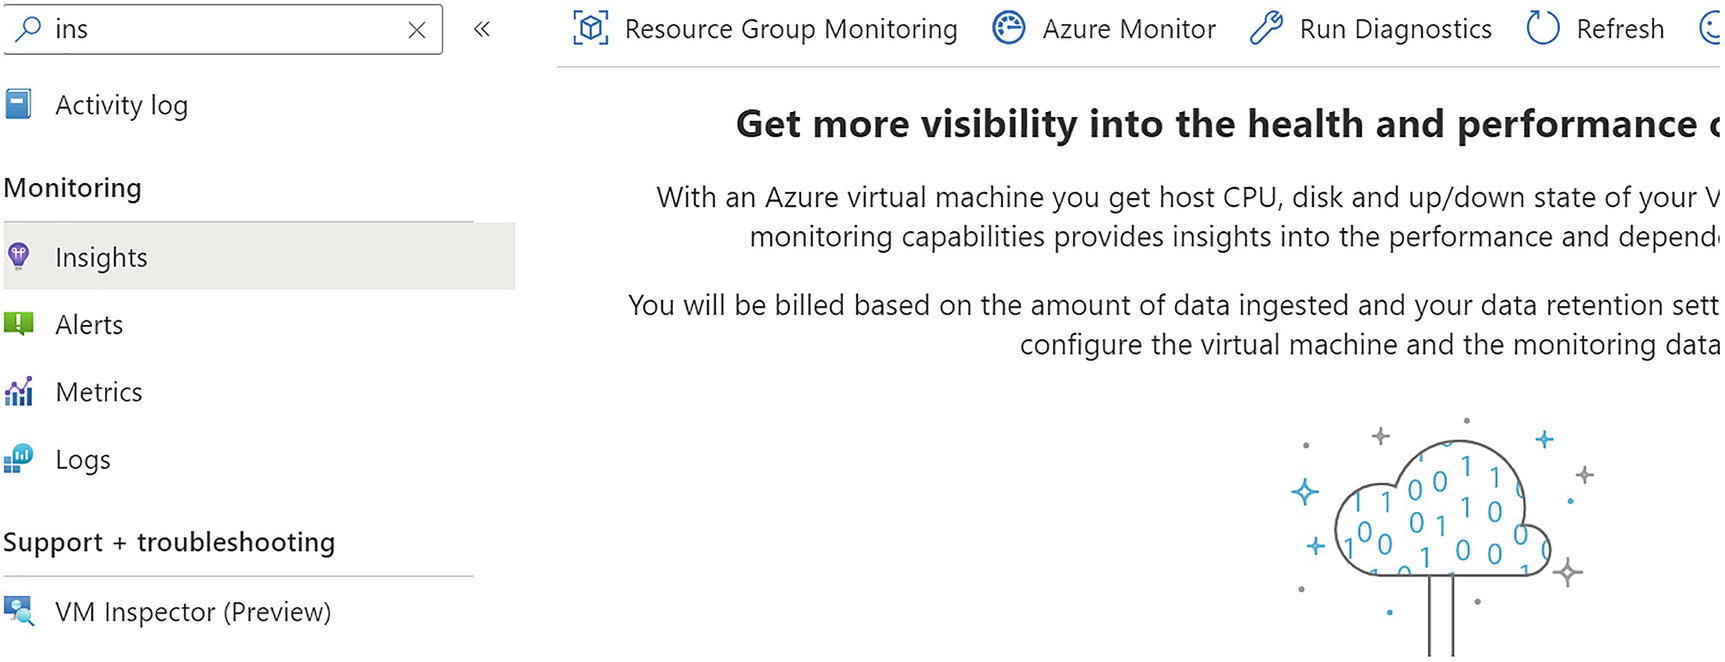
A screenshot represents the monitoring, insights, resource group, and Azure monitoring, running diagnostics, refreshing, and getting more visibility into the health and performance.
VM Insights
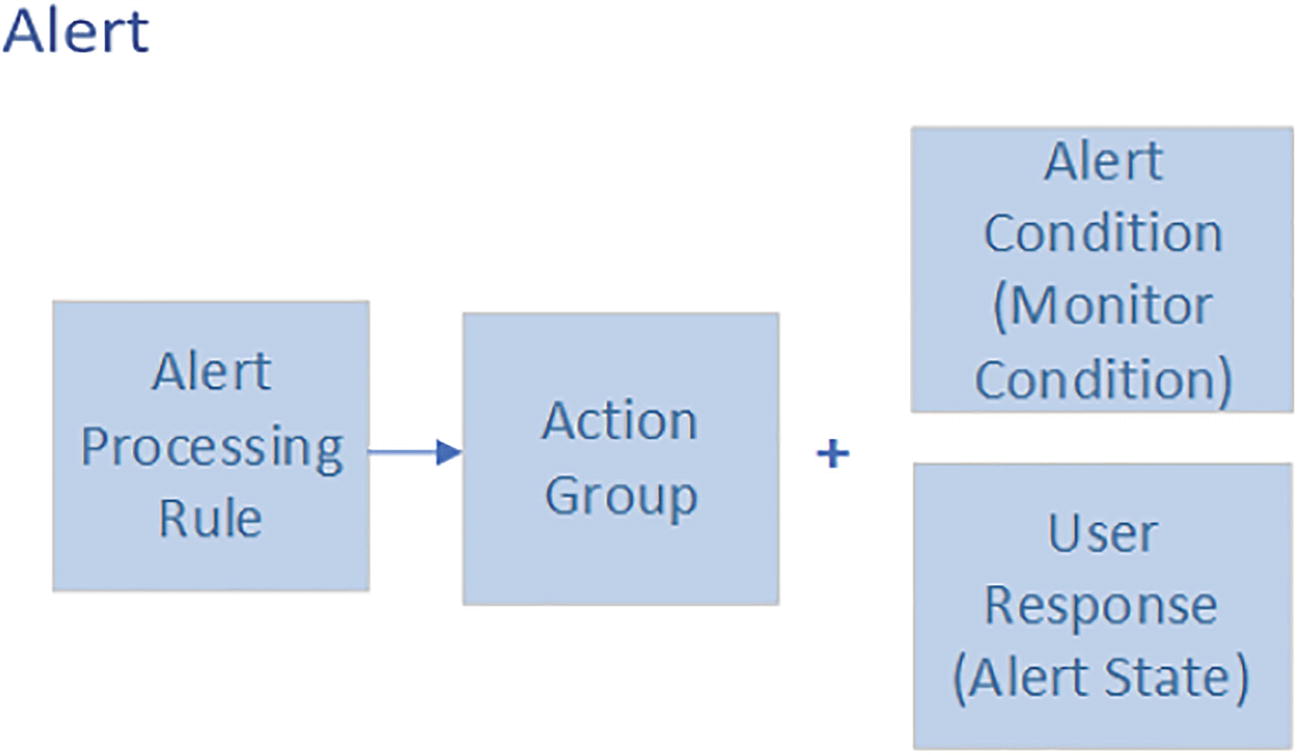
A block diagram represents the alert azure monitor, which includes the alert processing rule to action group plus alert condition or monitor condition and user response or alert state.
Alerts

A screenshot represents the azure monitor alerts, total alerts are 8, critical is 0, the error is 0, a warning is 0, informational is 0, verbose is 8, and the time range is past 24 hours.
Azure Monitor Alerts
Resources to be monitored
Signal from the resource
Conditions
The alert processing rule applies the fired alerts. With alert processing rules, you can add or suppress the action groups and apply filters or rules based on a predefined schedule.
- Actions groups trigger the notification based on the workflow to inform the users that alerts have been triggered.
Notifications methods such as email, SMS, or push notifications
Automation Runbooks
Azure functions
ITSM incidents
Logic apps
Webhooks
Secure webhooks
Event hubs
An alert condition is set by the system. When the alert is fired, the alert monitor’s condition is set to fired.

A model diagram represents the processor time is greater than 80 percent, minimum equal to 2, current capacity equal to 3, and maximum equal to 5 of auto-scaling.
Auto-scaling

A screenshot depicts the two spike graphs transactions by A P I name with four curves of append block, entity group transaction, create a container, get blob properties, and ingress with two curves ingress, and egress.
Azure Dashboards

A bar graph represents the two bars, whereas deny 1.24 M and allow 201 K of the azure workbook.
An Azure workbook
You can use an Azure workbook with Insights or create your own predefined templates.

Two model diagrams represent the dummy plus active nodes containing dummy 38424 and active 501216, and missing relations containing missing 205827 and expected 1325029 of the power B i reports.
Power BI reports
Azure Sentinel
Azure Sentinel is a cloud-native, security information, and event management (SIEM) solution, as well as a security orchestration, automation, and response (SOAR) solution.

A screenshot represents products, nonregional, azure stack hub, South Africa north, east Asia, Southeast Asia, Australia central, Australia east, Australia southeast, and Brazil south in columns.
Azure Sentinel regional availability
Log analytics workspace
Azure subscription
Contributor permission for the subscription where you want to deploy Microsoft Sentinel
Contributor or reader permission to the resource group
Additional permission to connect to the data sources

A screenshot represents the Azure services in that create a resource, sentinel contains all, services, marketplace, documentation, resource groups, and services contain Microsoft sentinel.
Enable Azure Sentinel

A screenshot depicts choosing a workspace to add to Microsoft Sentinel, previewing, searching workspaces, and creating a new workspace to enable Azure Sentinel.
Enable Azure Sentinel
Select Add Microsoft Sentinel. Microsoft Sentinel ingests data from various services by connecting services and sending the events and logs to itself. For physical and virtual machines, you can install a log analytics agent, which will collect the logs and forward them to Microsoft Sentinel.
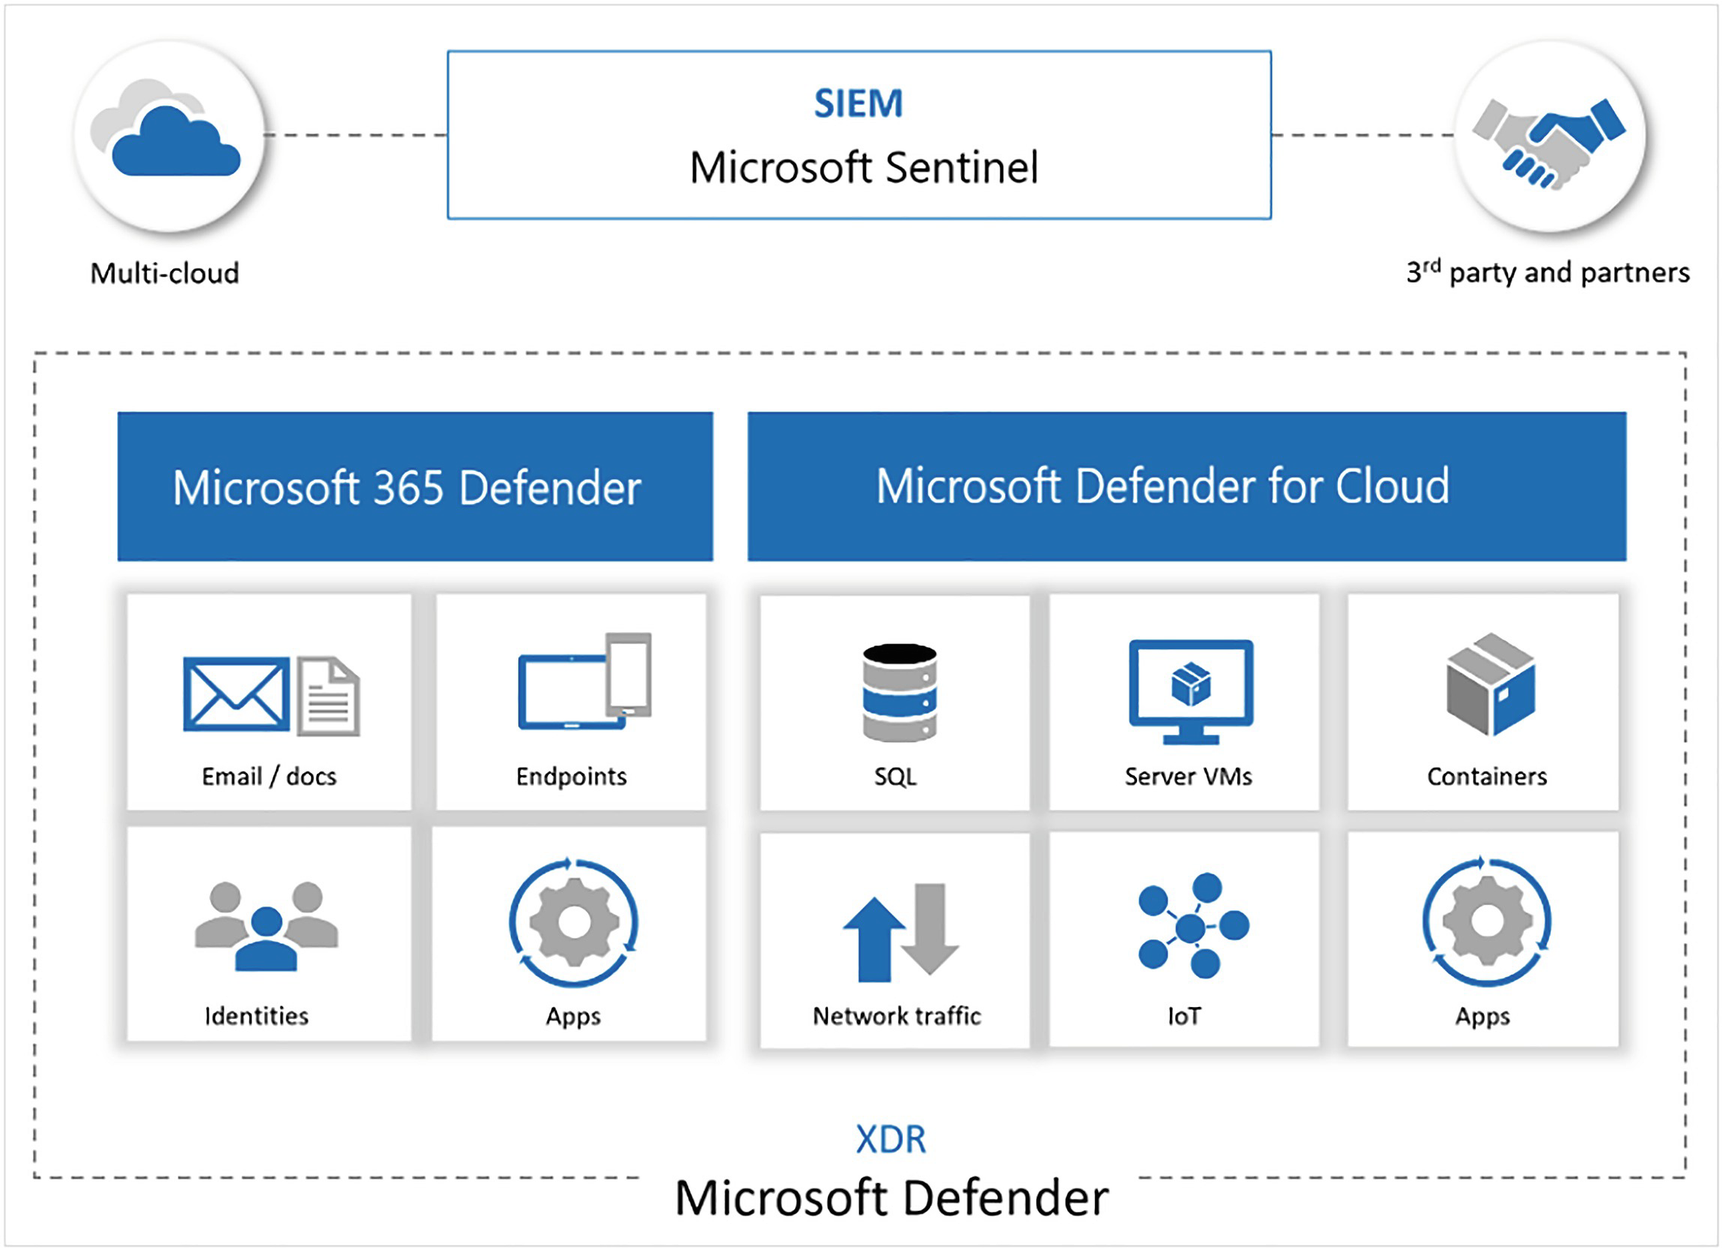
A model diagram represents the multi-cloud, S I E M Microsoft sentinel, third party and partners, Microsoft 365 defender, Microsoft defender for cloud, and X D R.
Azure Sentinel with Microsoft Defender
Apart from sending data, Microsoft Sentinel has various other features :
Uses information with machine learning
Creates visualizations with workbooks
Runs playbooks with alerts
Integrates with partner platforms
Integrates and fetches enrichment feeds from threat intelligence platforms
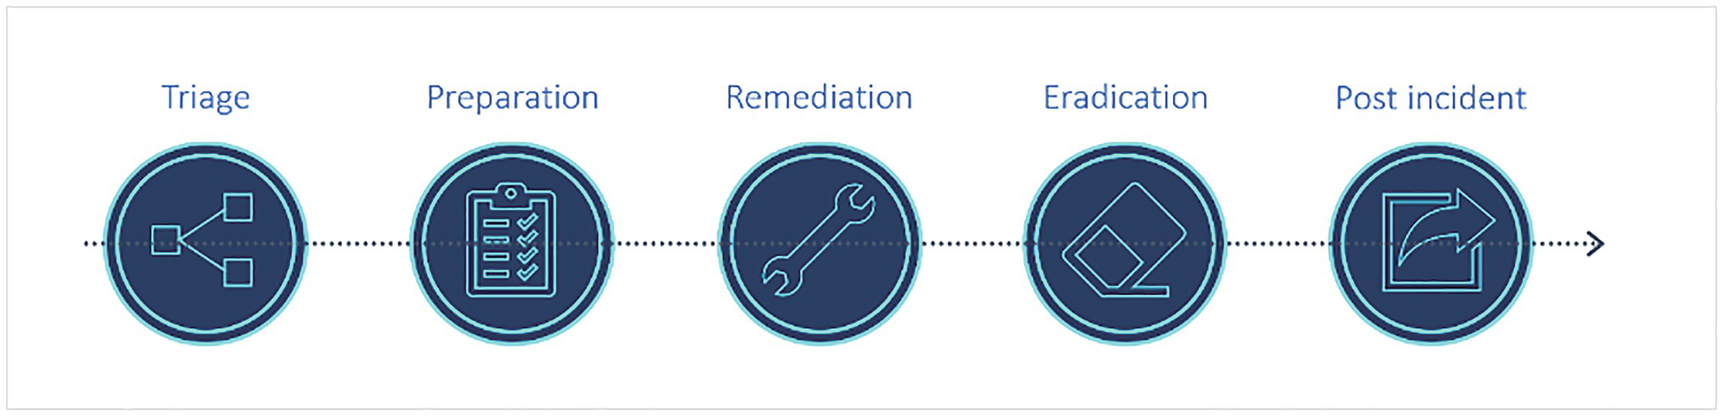
Five model diagrams represent the triage, preparation, remediation, eradication, and post-incident incident management and response process.
Incident management and response process
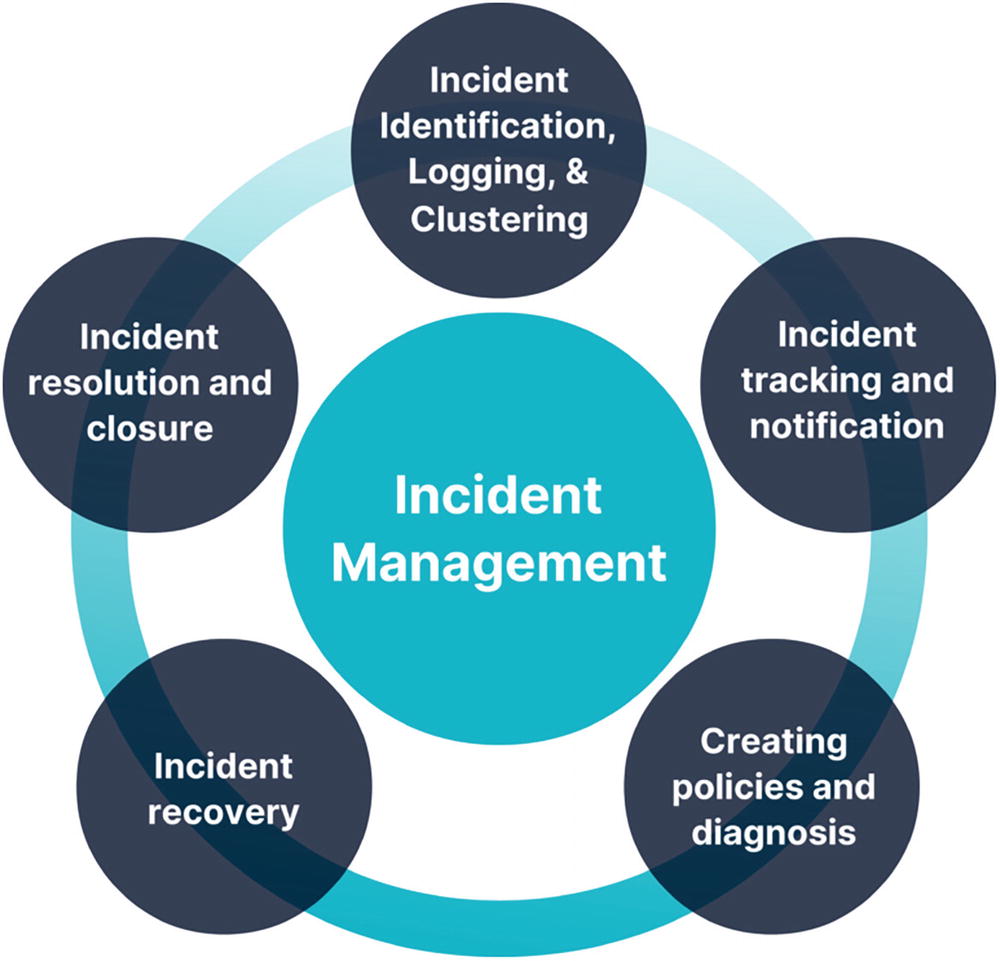
A circle diagram of the incident management and its responses. It includes incident identification, logging and clustering, incident tracking and notification, creating policies and diagnosis, incident recovery, and incident resolution and closure.
Incident management and response process
Data connectors: Microsoft Sentinel has many out-of-the-box connectors to start ingesting data to Microsoft Sentinel. For example, Microsoft 365 Defender connector is a service to the service connector that integrates data from Office 365, Azure AD, and so on. See Figure 7-30.
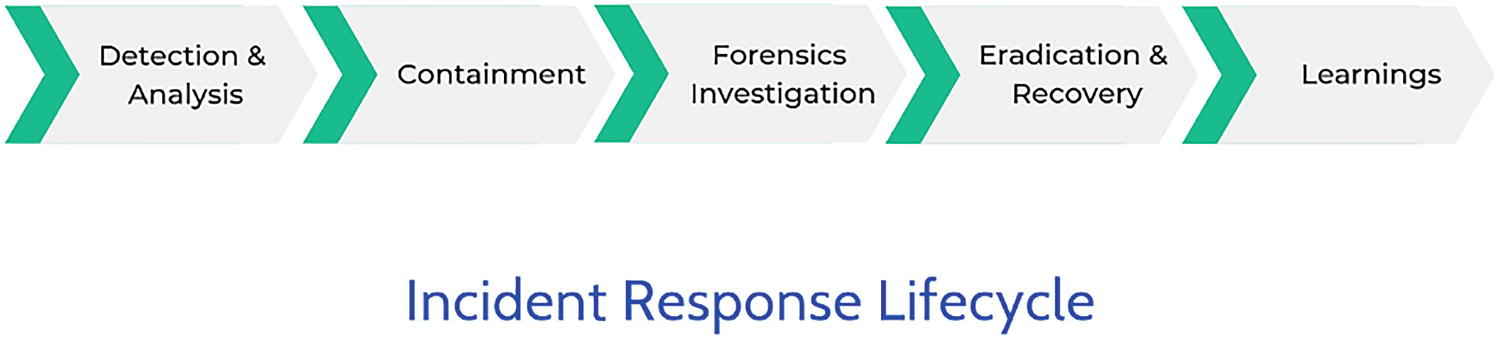
A value chain diagram of the incident response lifecycle. It includes detection and analysis, containment, forensics investigation, eradication and recovery, and learning.
Azure Sentinel connectors
Parsers: These parsers provide log formatting in the Advanced Security Information Model (ASIM) formats to support their use across Microsoft Sentinel.
Workbooks: These provide monitoring , visualization, and interactivity with data using Microsoft Sentinel. See Figure 7-31.

Five symbols represent the events 4.5 M, alerts 89, new 29, investigated 3 and closed 9.
Workbooks visualization
Hunting queries: These queries are used by the Security Operations Team (SOC) team to hunt for threats in Microsoft Sentinel. See Figure 7-32.

A screenshot represents the Microsoft sentinel, hunting, active by total queries is 224 by 249, result count by queries run is 0 by 0, queries, Livestream, and bookmarks.
Microsoft Sentinel hunting queries

A screenshot depicts the queries, Livestream, and bookmarks, which contains values of preattack 1, initial Ac 36, execution 31, persiste 57, privilege 31, query, provider, and changes made to A W S.
Microsoft Sentinel hunting custom queries
You can also create custom queries or modify existing queries and then share them with users who belong to the same tenant.
To create a new query, select New Query and then select Create. Click the Create Entity Mapping and then select the entity type, identifiers, and columns.

A screenshot depicts the delete query, name, description, custom query, view query results, azure resource, cloud application, D N S, file, file hash, host, I P, mailbox, a mail cluster, and message.
Microsoft Sentinel hunting create new queries
Playbooks and Azure Logic App custom connector: This provides features for the automated investigations, remediations, and response scenarios in Microsoft Sentinel. Playbooks in Microsoft Sentinel are based on workflows, like Azure logic apps, which can be used to schedule, automate, and orchestrate workflow across the enterprise.
Custom connectors
Managed connectors
Microsoft Sentinel connectors
Triggers
Actions
Dynamic fields
Conclusion
This chapter explained how to secure data stored in the cloud and how to provide secure access to that data. You also learned about the various ways to classify data and make it available for downstream users and applications in a secure manner. Finally, you also learned about the various data encryption patterns and related models used while working with public cloud providers, such as Azure, Google, AWS, and so on.