Chapter 6. Ideation
Generating, diversifying, developing, sorting, and selecting ideas.
Expert comments by:
Chris Ferguson | Belina Raffy | Jürgen Tanghe | Mauro Rego | Satu Miettinen
-
Pre-ideation: Slicing the elephant and splitting the ideation challenge
Pre-ideation: “How might we …?” questions from insights and user stories
Adding depth and diversity: Ideation based on analogies and association
Understanding, clustering, and ranking options: Octopus clustering
Understanding, clustering, and ranking options: Benny Hill sorting (“Thirty-Five”)
Understanding, clustering, and ranking options: Idea portfolio
This chapter also includes
Where Ideas Come From
The world will tell you that creativity is all about having the best ideas. People who work in arts or any type of creative profession – even designers – are always being asked, “Where do your ideas come from?” And when organizations initially approach service designers for help, they often say something like, “We want to kick off by generating some good ideas.” Ideas are seen as the precious starting point of value generation.
Let’s start by challenging that belief. Of course, producing ideas is a vital part of any service design project – but it is not as all-important as many people seem to think. 1 In service design, ideas represent one point (or usually several points) in an evolutionary process, and are a critical part of problem solving. They concretize aspects of what has come before, and are the sparks of what comes after them. Ideas are not especially valuable in themselves – they are neither good nor bad, but they might be useful.
So, to the surprise of many newcomers, service design does not set out to find one killer idea as a starting point. Instead, ideas are generated en masse at various stages in the process, mixed, recombined, culled, distilled, and evolved or parked. We call this process ideation, and it never stops.
Ideas
Although ideation is often shown as a discrete process step – you will usually see a main phase of idea generation marked on the project plan, and it’s there in the visualizations in this book – it is not the only time we generate ideas. We will have ideas all through the project. Our brain’s determination to churn out ideas is valuable, but we should differentiate carefully between ideas from different contexts, as each context brings its own bias. Very early ideas might be useful – but do we really understand the challenge yet? Ideas often pop up in research – but is the data or situation which prompted that idea valid or representative? For many “tinkerers,” the prototyping bench is the ultimate idea generator as we think with our hands – but are we in love with a clever prototype feature, or are we addressing a real customer need?
So all through the project, we will be creating ideas which might be useful – we should make sure we preserve them. Our idea management system might be as simple as an idea wall – a simple sticky note “parking place” – or a more structured layout. More ambitiously, we can adopt collaboration platforms and techniques from knowledge management. We might note the original context of each idea, so it can carry the appropriate bias warnings. It’s wise to treat all unproven ideas with skepticism anyway.
 Expert Tip
“Don’t get attached to individual ideas. You are there to broaden the field of possibility. Later, you will come back and might find treasure – but for now, keep planting seeds.”
— Belina Raffy
Apart from the inevitable spontaneous ideas, there will be times when we deliberately try to generate ideas or fixes. These are generally the divergent phases of our project, and we use divergent techniques, aiming for quantity, not quality – at least at first. It is often said that a high quantity of ideas leads to later success. 2 Whether this is true or not, it’s not the only reason to aim for idea volume in a service design project.
The process of generating ideas is a valuable way for participants to begin to explore a theme cognitively. Aiming for quantity will help them move beyond the obvious to more interesting, radical ideas. Group ideation is also a good way to develop shared ownership of ideas, as participants build on each other’s input. Later, no one can say whom the idea belongs to. Generating many ideas can be good training for divergent thinking, as the team practice temporarily suspending judgment. And, crucially, it can help break habits of perfectionism and ownership. If project participants are encouraged to generate a heap of ideas in a short time, they find it easier to accept that many of those ideas will be sketchy and imperfect, though perhaps still useful. And if we start with a big pile of ideas, it is easy to abandon most of them. Learning to let go of ideas to make way for new ones is a crucial skill of service design, and one that needs practice.
The Basic Process of Ideation
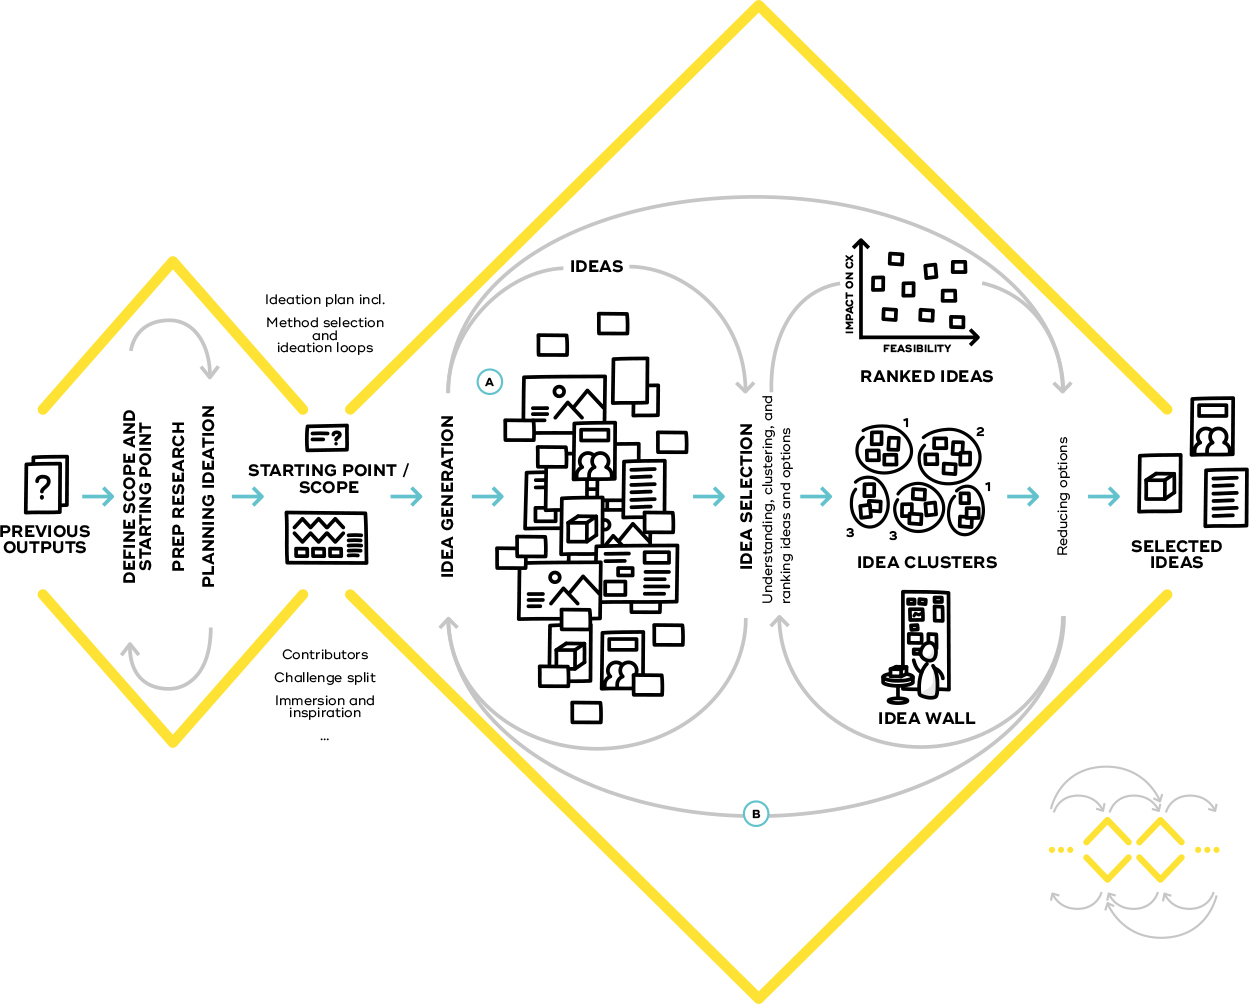
Figure 6-1. Ideation activities are embedded in an iterative sequence with other activities of research, prototyping, and implementation.
Other ideas: Ideas will also arise naturally during research. They can be parked, then added to the pool of ideas generated in formal ideation. Ideas which arise during prototyping can also be parked and added to a later ideation iteration, or they can be immediately prototyped.
Iteration and ideation loops: Ideation is often an iterative process with a sequence of loops – iterations within one activity, such as idea generation – as well as loops which return to idea generation after selection or prototyping takes place.
Decisions
As well as periods when we generate ideas, there will also be times when we want to reduce our number of options, to converge in on the most useful content. We will need to decide.
In business life, decision making is seen as one of the most important skills we can have. Decisiveness is understood to be a key skill of leadership; decisions in business are often momentous, and the very term “decision maker” implies a senior role.
In service design, decisions are seen differently. We are not deciding the future of our company or project. Instead, we are merely successively and routinely narrowing down options in the convergent phases of our work. We attempt to avoid making big, weighty choices whenever possible. Instead, we set up many small, low-risk, provisional decisions, usually along the lines of “Where are some places we could start?” or “What experiments do we try next?” This can be difficult for people who are new to this way of working. Many participants will want to spend a long time on selecting the “best” idea – or even a perfect one. They may feel that they are not ready to make a choice or do not have enough information.
Teams will need to learn that in a design process, we are not trying to choose the perfect idea, the silver bullet, then immediately investing massive resources in implementing it. Instead, we are trying to quickly spot a few ideas which are interesting, which seem to fit the project goals, or which are “good enough” to kick off an experimental, evolutionary process.
These quick decisions sound risky, but they are not. We will rely on the later parts of the project – especially prototyping and testing – and on later iterations to confirm the quality of ideas and to improve them. 3 It’s another way of working which is unfamiliar to many co-creative partners, and may feel uncomfortable. 4 Idea selection methods can help formalize that choice and reassure them, but some inexperienced partners may still need frequent reminders that this will not be the last opportunity to change or replace key ideas – we are ideating and evolving ideas all through the project.
Because our choices are lower risk and more frequent than in traditional project management, the responsibility for making decisions often devolves to the project team. 5 The members of the team are preloaded with information, impressions, and inspiration. Their knowledge has been built up from a thousand details of the project and cannot be meaningfully communicated in a quick management briefing – or even in a lengthy document or discussion – because it is implicit, emergent, empathic, or abstract.
This necessity to keep implicit knowledge inside the process leads to one of the key concepts of decision making in service design: the people who are close to the project and who understand both the origin and implications of the choices need to be involved in all major decisions.
The difficulty of communicating implicit knowledge – especially across silos – is the reason why a continuity of personnel is crucial in service design projects.
While the relative makeup of the team may shift throughout the project, we make sure that at least some of the people who will implement the project are there in the earliest phases, and that the people who understand the customer needs are still around during implementation. In a digital project, at least one coder needs to sit on the customer’s sofa in the initial research; and at least one customer insights specialist should be there when the software is built and rolled out.
They might not be alone, as the decision will sometimes need to involve people who were not part of the ideation or prototyping process. Experts on technical, strategic, or brand issues, senior management, the legal team, and more might be brought in at particular moments, but these valuable “outsiders” should not decide in a vacuum.
The rich supply of details and strength of impressions carried by the team is valuable, but it can also make decision making cumbersome. How can they sift through the data to focus on what is important? How can they step back and leave behind ideas they love? We need a set of tools and methods to protect the team from decision paralysis, and to help them co-decide with outsiders while making the most of their hard-won knowledge and empathy. These tools can be relatively lightweight – there is rarely need for complex analysis when you are merely deciding “which five ideas do we try next?”.

Figure 6-3. Decision time is often a critical moment for a team as it moves from a divergent phase into a convergent phase.01
The Process of Ideation
Even if many “spontaneous” ideation activities will often be carried out without extensive planning, systematic ideation can still benefit from a clearly articulated process.
Planning ideation
When you are setting up a divergent ideation activity, it pays to lay some groundwork. In a service design project, you will usually have done some research beforehand and will be well prepared for ideation, perhaps after insight generation. Or you might be coming back from a prototyping phase, ready to use what you have learned. Your starting point will be some kind of ideation challenge or question, made by reframing your insights. In planning your ideation activities, you will often be building from observations and data through insights and questions towards ideas, and then diversifying and filtering those ideas in a series of loops. Here are some things to think about when planning.
Expert Tip
“Need a bunch of ideas? Build some prototypes and mess around – ideation doesn’t only happen on sticky notes.”
– Belina Raffy
A Starting point/scope
Re-examine the previous work (e.g., research or prototyping results) – it can be helpful to immerse the core project team in it. Then decide on the starting point and scope of your ideation. 7 At times, you may like to leave some fuzziness within the scope, to increase the chance of disruptive or more novel solutions. For example, you might explicitly not brief some contributors on your research, add activities which use random input, allow opportunities for productive misunderstanding, 8 and so on. Based on your starting point, you might do some additional preparatory research to check for existing solutions or analogous problems. 9
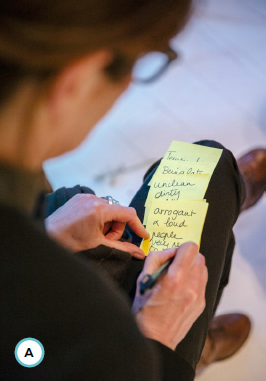
B Immersion and inspiration
Consider how to bring in the essence and raw data from your previous work. Apart from including people who were active in the research or prototyping phase, you might show artifacts, videos, and quotes, keeping the raw data hidden but accessible. You could also develop key insights from your data. Also consider which inspiration elements or activities can be valuable prior to the actual ideation session.
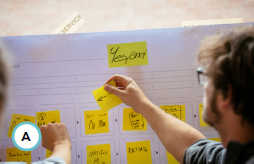
C Split the challenge
You do not need to think about everything at once, and you will probably want to split your ideation (and indeed the whole project) into multiple manageable tracks. Use “slicing the elephant” techniques,or cluster “How might we …” questions into opportunity areas that suggest directions for potential ideation. 10
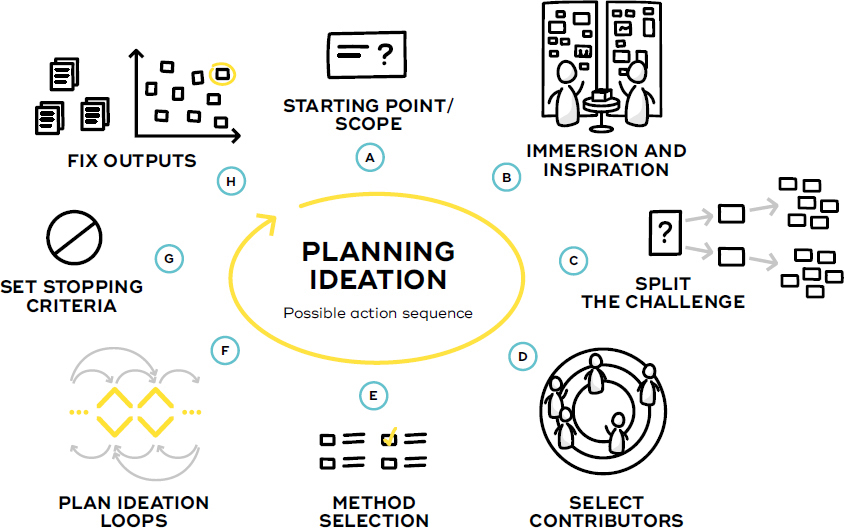
D Select contributors
Do a stakeholder mapping session for each of the opportunity areas to find out who could meaningfully contribute to that area. Make sure you are balancing the needs of end users, key participants, and your own organization. A mix of insiders, outsiders, experts, and users works well. Our natural tendency is to make heterogeneous groups – but homogeneous groups will often get you more extreme ideas. And while experts are good at spotting minefields, they can sometimes be too dominant. You might mix and remix the groups in different sessions to get the best from the people you have. 11
E Method selection
Line up a sequence of ideation and decision methods to fill your idea portfolio and select them. 12
F Plan ideation loops
Ask yourself how the different ideation and decision-making sessions feed into each other. Be ready to be flexible, changing methods during the sessions if necessary. Remember to plan time between the activities and sessions for reflection and ideation “out of action.” 13
G Set stopping criteria
It can be useful to define criteria for when to stop. This can be as simple as setting the number of ideas you want to achieve, or deciding to rely on expert assessment. Like with theoretical saturation in research, you might stop when further ideation produces (essentially) no new original ideas. 14 You should also assess the dependencies for doing prototyping or further research as you can be sure new questions will arise.
Expert Tip
“Participation in ideation – and the design process in general – can be confusing and exhausting for non-practitioners. There are many new terms and activities that are mentally taxing, and the process can be unpredictable and uncomfortable. Prepare people with one-on-one meetings or comfort calls ahead of time. Let them know that they are being selected to participate because they are creative (even if they don’t think they are!) and important to the success of the project.”
— Chris Ferguson
H Fix outputs
Decide how many selected ideas you will eventually need (e.g., how many prototypes you want to later build) and what format the ideas need to have so they can be pushed forward.
Idea generation
Briefing and inspiring participants
If there has not been formal research – or if you are in a preparatory ideation phase and research will come later in the project – you might fall back on other methods to connect with reality. You can give the participants homework – perhaps not to generate ideas, 15 but to put themselves in the shoes of the customers. 16 An alternative is storytelling, where participants share their own experiences or listen to customers or colleagues from the front line.
You can also introduce participants to the theme of your ideation activity by giving them background information on what is happening currently in that field and in other useful contexts, and letting them explore this information – for example, using a World Café format. 17 As well as sparking ideas, this can also help put participants “on the same page,” giving them all at least a basic grounding in the important themes. 18
Method selection
Always consider a mix of methods. Like research methods, many ideation methods have their own inherent bias, perhaps allowing different types of people to contribute to varying degrees. While many people feel comfortable writing ideas on sticky notes, others might be more creative when you allow them to express themselves using visuals (e.g., sketching), mock-ups, 19 or movement (e.g., bodystorming).
A good mix of ideation methods levels out potential biases and invites the diverse talents of your contributors. Depending on the complexity of your ideation challenge or problem, pick one or more methods from the following categories. 20
Yet, Becky Currano from Stanford has discovered 21 that a major part of the innovative ideas of Silicon Valley designers were produced during reflection out of action in situations such as in the park, in the shower, or while doodling or jogging.
When we work with ideation in service design, it would make a lot of sense to mix in methods and processes to support not only in-action time but also out-of-action reflection.
The combination of in-action ideation with a team or group and out-of-action solo reflection helps you to understand and process large information clusters and do the slow thinking 22 that is supported by enjoyable out-of-action activities. You can have an idea log in your phone, window pens in the bathroom, or a notebook in a car where you can note the innovative ideas when they pop up.

Figure 6-4. Intentionally plan time for out-of-action reflection during workshop situations. For example, include solo outdoor activities between sessions.
→ Pre-ideation: Slicing the elephant, ideas from future-state journey mapping or future-state system mapping, “How might we …?” questions from insights
→ Generating many ideas: Brainstorming, brainwriting, 10 plus 10
→ Adding depth and diversity: Bodystorming, using cards and checklists, ideation based on association and analogies
Expert Tip
“When the participants are ready to start ideating, wait a little (you might give some more input), and then let them start ideation. The ideas will be ready to boil over. Over-draw the bow before you shoot.”
– Belina Raffy
Simple challenges can be approached with a quick 15-minute ideation session with a simple activity. More complex questions might involve sessions with different stakeholders spread over a couple of weeks, perhaps first splitting up the challenge into distinct development directions, then running multiple ideation sessions with employees, customers, and experts. Each session might build directly on the output from the previous ones to diversify and evolve ideas.
Managing energy
There is growing evidence that boredom can lead to good ideas. 23 While this deserves exploration (perhaps you can use a long drive or repetitive preparation tasks as part of your process), deliberately boring participants will not make your project popular. Instead, warm-ups can help us feel more energetic and productive – they are especially valuable before ideation sessions. Just as importantly, they can also help us establish the safe space 24 which makes us more ready to fail and helps us with more radical thinking. In each ideation workshop, you should choose one or more suitable warm-ups for your group, and consider carefully when to place them. It’s usual to do warm-ups at the very beginning of a workshop, but there is plenty of evidence 25 that delay or deliberate distraction can improve the results of ideation sessions. 26 This might suggest placing the warm-up after you set the challenge for the ideation, but before you start to generate ideas.
Idea selection
The groan zone
Many representations of the service design process, like the famous Double Diamond, 27 show convergent phases following immediately on the heels of divergent phases. This abrupt change can be very hard, or even distressing, for project participants. Often, participants do not feel ready to start abandoning these fresh new options yet. 28
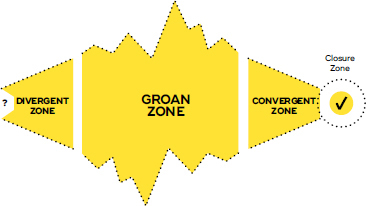
Figure 6-5. The Groan Zone in the “Diamond of Participatory Decision-Making” by Kaner and colleagues. 29 It’s hard to go straight from divergent to convergent activities.
Before participants feel ready to make a decision, they might need to develop a mutual understanding of the options open to them. Their ideas will probably be at different levels – some will be concepts or systems, some features or details. Some might be reframed needs, some might be very concrete solutions. Teams might need to explore and organize their thinking by asking each other questions, sorting items, or perhaps developing some boundary objects 30 to bring clarity. Or participants might just need a break, a game to distract them, or a good night’s sleep. Consider this when planning your process.
But don’t give them too long. The more time we spend considering, explaining, and shaping our thoughts, the more we feel invested in them – and the more we fall in love. If the team has difficulty letting go of ideas, this can be a problem. So sometimes it makes sense to acknowledge that other ideas also deserve more time, but to keep moving anyway, taking just a few ideas forward and asking participants to park the others. Even if you don’t come back to them formally, the best aspects of abandoned ideas will bubble up in the DNA of future iterations.
Physical context of decisions
The physical context of decisions is important. Many people like to have a “clear head” and make decisions in a relatively neutral environment – which is why we take walks in the woods and cogitate on beaches. But in service design projects, it is less about making a single weighty decision, and more about running a decision-guiding process and the conversations it throws up. It’s going to be useful to have our assets nearby, so we can quickly return to any points which come up, pointing at the sticky notes and turning the prototype around once more. It also seems that visually complex environments lead to better cognitive function, and ultimately to better decisions. 31 See what works for your team.
Agreeing to decide and selecting methods
Many decision-making tools do not actually make a decision. Instead, they prepare the ground by sorting information, flagging favorites, or slicing the big decision elephant into smaller, more manageable questions. In some cases, the method will make the decision very clear, and a glance around the room will show that you can just move on. But often there will still be the need for some discussion or voting before the course is clear.
One of the best things that a group can do in this situation is to decide in advance how and when the decision will be made, and what happens to the ideas left “on the cutting room floor.” Before using a method, participants can decide what decision factors will be most important, and how long they will spend on the decision. Several of the methods presented in this section will be helpful – but no method in the world should decide for you. They can only support and facilitate your decision process.
As a rule of thumb, if you want to reduce friction it makes sense to break down the decision-making process into several steps and select one or more methods from each of the following categories: 32
→ Understanding, clustering, and ranking options such as octopus clustering, Benny Hill sorting (“Thirty-Five”), idea portfolio, decision matrix
→ Reducing options such as quick voting methods, physical commitment
Documentation
Ideation is a process which soon becomes complex and rather wasteful as you abandon far more ideas than you use. The ultimate documentation of your ideation process is the prototypes which come out of it, but they can never contain all the complexity of what has gone before. It is worth thinking about keeping track of what ideation activities you have done, and mapping where your idea assets are.
At the simplest level, you might just keep the physical artifacts of your ideation on display, evolving ideas along the wall – like a research wall, this supports conversations and the discovery of connections. You might digitize the results of each round for future reference. Or, you might use more complex indexing methods, connecting ideas to their project origins. It’s very powerful when you can say, “This prototype comes from this idea, which comes from this partial idea, which comes from this ‘How might we …’ question, which comes from this strategic opportunity area, which comes from this insight, which comes from this original customer statement. 33Let me play you the recording.” On the other hand, indexing also takes a lot of work. 34 Find what…
Methods
Read more on methods and tools in our free online resources at:
![]() www.tisdd.com
www.tisdd.com
Ideation Methods
There is a whole industry around idea generation and selection. Ideas are usually seen as the cornerstone of creativity and countless methods exist, often under multiple names, to create, filter, and select them. Here, we introduce some favorites, structured into categories:
Expert Tip
“Deciding in advance how decisions will be made is essential for process transparency, security, and perceived fairness. Who will decide, and how? We know from research that design by committee is often a recipe for poor design, yet service design is at its core participative and inclusive, so it is somewhat of a paradox. Some organizations use adults – lead designers or executives who can set direction and decide from options presented by the team.”
— Jurgen Tanghe
→ Pre-ideation: Slicing the elephant and splitting the ideation challenge, ideas from journey mapping, ideas from system mapping, “How might we …?” questions from insights and user stories
→ Generating many ideas: Brainstorming and brainwriting, 10 plus 10
→ Adding depth and diversity: Bodystorming, using cards and checklists, ideation based on analogies and association
→ Understanding, clustering, and ranking options: Octopus clustering, Benny Hill sorting (“Thirty-Five”), idea portfolio, decision matrix
→ Reducing options: Quick voting methods, physical commitment
Pre-Ideation Slicing the elephant and splitting the ideation challenge 
Making one big ideation challenge into a series of more manageable ones.
Often, the theme of ideation is too large or abstract to get a grip on. You can help the team by using techniques to limit or split ideation into more manageable subtasks. Famous examples include the Six Thinking Hats, where participants ideate from different viewpoints (process, facts, feelings, creativity, caution, and benefits); attribute listing, where you start with the attributes (physical, procedural, etc.) of a challenge; 5 Ws + H, which invites teams to start from the who, where, what, why, when, and how; and the Five Whys, where we ask ourselves “Why?” five times. Each answer is a starting point for ideation.
Prepare and use: The process depends on the method used. Generally start by inviting the right people (people who know the background or will implement and deliver the service, experts, users, management, etc.). Prepare the participants 38 and run the method. Now examine your ideas. What do they suggest? Should you repeat? When ready, move into idea selection.
Expected output: More manageable challenges, more diverse approaches.
Throw together some quick new future-state journey maps to start exploring your ideas.
Look for opportunities to add value by strengthening relationships shown in system maps.

Generating some first “How might we …?” questions, based on the insights in the background.
Pre-Ideation Ideas from journey mapping
Using the classic visualization tool to generate ideas around experience and process.
Starting with a current-state map, or using your research and experience, you create new future-state journey maps. On the way, you generate many ideas which may be diversified or prototyped. With groups who are comfortable thinking in journeys, this lets you think about orchestration and expectations early on. 39
Prepare and use: Let the group look at your current-state journey maps and, if practical, the research behind them. (If you have no maps, storytelling offers a weaker alternative). Taking one map at a time, use the best information you have to spot critical steps in the journey by referring to your research, stepping into the shoes of your personas, or simulating process and experience using desktop walkthroughs, investigative rehearsal, or bodystorming. Use other ideation techniques to ideate around each critical step, recording insights, ideas, and new questions. Now draw some rough new maps with your most promising ideas. How does the change affect the rest of the journey (technology, process, experience, dramatic arc, expectations)?
Expected output: Idea descriptions (text), idea sketches (visualizations).
Pre-Ideation Ideas from system mapping
Using a classic visualization to generate ideas based on relationships.
The group try to add value to an existing (or quickly created) system map by adding, removing, or replacing elements, and examining the exchange between stakeholders.
Prepare and use: Let the group look at some current-state system maps and, if practical, the research behind them (a weaker alternative is to make some quick assumption- based maps). Take one map at a time – it’s faster if you physicalize using Business Origami or a stakeholder constellation 40 – and ask: Can we strengthen a relationship? How could a key person become a hero? Which exchange could we facilitate? How could the network still function if some elements were removed, added, or changed?
Write down your insights, ideas, and questions. Use other ideation methods to diversify, then draw up new future-state system maps for the most interesting ideas. How can you make each map work? Is something still missing or imbalanced? Dig deeper using new journey maps, service blueprints, or prototyping.
Expected output: Idea descriptions (text), idea sketches (visualizations)
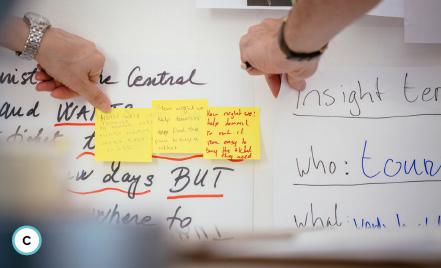
Pre-Ideation “How might we …?” questions from insights and user stories
A systematic method to base ideation on research and knowledge. 41
Use this systematic method when you have research or experience to build on, or when you need to step back from ideas and return to needs and opportunities.
Prepare and use: Start with the insights or user stories developed in your research activities. Look at the individual parts within each insight or user story, and convert each insight or story into several trigger questions, perhaps starting with “How might we …” Sort and group the questions into useful clusters or “opportunity areas.” Invite strategic specialists and senior management to help you prioritize them.
Look at the questions inside the clusters and decide what specialists you should invite to enrich your usual ideation cast of researchers, people who will implement and deliver the service, users, management, etc. Ideate around the questions inside your most important clusters, then move to idea selection.
Expected output: Trigger questions (text), map of idea clusters
Generating Many Ideas Brainstorming and brainwriting
Two famous methods which help teams stay in divergent mode while generating ideas quickly.
Use verbal brainstorming 42 to find a starting point for your work, to get to grips with the theme, to boost energy, or to add options. Use the silent, more thoughtful brainwriting 43 when ideas are more complex, when diversity is key, when the group is large, or to empower quiet participants.
Prepare and use: Prepare your group with information 44 and remind them to refrain from criticism, be open to wild ideas, focus on quantity, and build on the ideas of others. Show the ideation theme, then do a distracting warm-up before the exercise starts. In brainstorming, ask the group to shout ideas while you write them on the board. In brainwriting, ask participants to silently and individually write or sketch their ideas, one idea per page. They can pass them on to others for development, post them on a wall, or keep them secret for a while. At the end, display the ideas on the wall, cluster, discuss, and begin selection.
Expected output: Idea descriptions (text), idea sketches (visualizations), map of idea clusters
Generating Many Ideas 10 plus 10
A fast visual ideation method which combines breadth and depth of ideas.
The 10 plus 10 exercise 45 is a strong method for ideating around physical or digital situations and interfaces. It helps teams to quickly generate a broad variety of concepts, and to get some depth in understanding. The very visual approach helps them be specific.
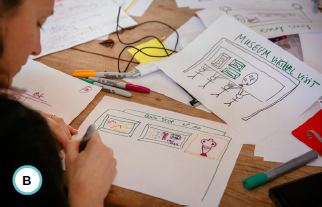
Prepare and use: Pick a challenge and do a warm-up before dividing into table-sized teams. Give the teams just a few minutes to individually, silently, and very roughly sketch 10 concepts per team that address the challenge. They should draw real-world implementations, not metaphors or concepts. When the time is up, they can each briefly explain their sketches to their immediate team members. Then each team should quickly choose one sketch which seems interesting, before sketching silently again, making 10 variations of this. After sharing the results, they now have 20 sketches from two rounds – one broad, and one deep – to take into idea selection.
Expected output: Idea sketches (visualizations)
Brainwriting in silence produces more diverse output than brainstorming, and gives less assertive team members a voice.
10 plus 10 sketching produces a wide range of concrete ideas rapidly. Go for quantity, and encourage sh!tty first drafts.
Bodystorming ideas for a machine interface by playing through some quick scenarios. Ideas come thick and fast, so one team member is busy recording them.
Adding Depth and Diversity Bodystorming
A physical ideation method, sometimes called “brainstorming for the body.” 46
Use this physical exploration method to help understand, ideate, and show problems. It is very useful when the challenge has physical or interpersonal aspects, or when a session needs empathy, energy, or a highlight. Bodystorming is simpler and faster than investigative rehearsal, 47 but has less depth.
Prepare and use: Immerse the group in the context of the challenge via research or site visits. If the group know the context well, storytelling might be enough. Make a list of interesting situations or ideas. In the original context or in a workshop space, take one situation at a time and act it out. 48 There will be lots of laughter at the beginning, but remember that this is work and challenge the group if they make their lives too easy or slip into discussion mode. As alternatives come up, try them out or park them. Take notes to help the group remember what they discovered, and repeat for other situations or ideas. Reflect, and take ideas forward into idea selection.
Expected output: Video/photo documentation of bodystorming sessions, documentation as idea descriptions (text), bug lists (text) or idea sketches (visualizations)
Adding Depth and Diversity Using cards and checklists
Cards (and checklists) focus an ideation session on one question or inspiration, with surprising results.
Ideation, creativity, brainstorming, and method cards (there are many names) can be used when the group feels stuck, or can’t move away from familiar thinking. They promote discussion, to suggest new avenues of exploration, to structure thinking, and to spark ideas. There are many sets – and similar lists – available, or you can make your own. Card sets can also function as a checklist – work through the cards, and you won’t forget anything important. The cards can also be used to prioritize by sorting out the most important ones, or they can form the headings around which you cluster your ideas and observations.
Prepare and use: The process will vary, so read the instructions. Warm-ups will be useful if you aim to ideate, especially warm-ups around making associations and building on each other’s ideas. To push beyond the obvious, spend a little longer on each card than the group wants to.
Expected output: Idea descriptions (text), idea sketches (visualizations)
Adding Depth and Diversity Ideation based on analogies and association
Ideate by translating existing solutions or looking for links to random stimuli.
Analogies are a way to translate ideas which already exist. Instead of struggling with new Problem A, adapt known solutions to the essentially similar (analogous) but familiar Problem B. 49 Associations work in a similar way to analogies, but help us reframe the problem and think in new ways by trying try to find associations with a randomly chosen word or image. These methods are best used after other, simpler methods.
Prepare and use: Good analogies are powerful, and preparing them gets easier with experience. Basically, you reduce the challenge to its essential characteristics, separate it from its context, and look for problems with similar characteristics in other fields. Choose the best analogies, and think about the analogy, not the initial challenge. What worked there? Make notes, and try various analogies. Can the ideas and experience be translated?
Random association has the same basic process, but starts with a random word, phrase, or image. Open a book at random, or use one of the many random word and image generators online.
Expected output: Idea descriptions (text), idea sketches (visualizations)
Octopus clustering. In a very large group, five highly engaged rows of participants sort hundreds of sticky notes in minutes.

Card packs can help focus or diversify an ideation session – or break a deadlock.
Random words or images can be used to diversify and unblock ideation.
Understanding, Clustering, and Ranking Options Octopus clustering
A very quick group method to sort and cluster ideas or information. Everyone gets to know the ideas.
Use octopus clustering to sort large numbers of ideas, insights, data – anything which fits on a sticky note. As well as sorting, everyone gets an overview of what the material is and starts to share ownership of ideas.
Prepare and use: Stand people in clear rows in front of a wall of sticky notes. The front row actively sorts the notes; the second row advises, and other rows have various support functions. Every 30 seconds, the front row moves to the back, and everyone steps forward into a new role. Remind them to watch out for “orphans” and break up overlarge clusters. After a few cycles, the notes are sorted and the group knows the content.
In this exercise, people work fast and close to each other, so it also acts as a great warm-up. Also, everyone touches many notes, leaving them crumpled and tired – we lose attachment to the ideas. The new clusters might help us understand the overarching structure of the material, or suggest different directions for the next step.
Expected output: Idea clusters, photo documentation of idea wall
Benny Hill sorting (based on “Thirty-Five”) – Mixing up the papers.
Sharing out the points in Benny Hill sorting.
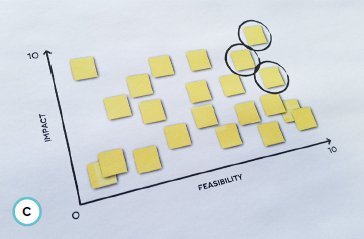
A typical idea portfolio. You will see some quick wins at the top right (circled), but might also choose to explore some long-term goals (top left), and perhaps some important infrastructure tasks which will open up future opportunities (lower left).
Understanding, Clustering, and Ranking Options Benny Hill sorting (“Thirty-Five”)
A fast, high-energy way to choose the most interesting or popular from a large group of options.
This method 50 for bigger groups takes a large number of items and quickly ranks them by whatever criteria you decide. Use it to select ideas or pitches which the group finds most interesting. Or use it to agree on priorities for the session, rules of cooperation, and so on.
Prepare and use: Everyone is standing, each holding a piece of paper, perhaps with a very clear sketch of their idea. When music plays, they move quickly through the group, swapping papers with everyone they meet. When the music stops, they form random pairs, compare their two unfamiliar papers, and have 45 seconds to share 7 points between the ideas. The exercise repeats five times and the results are summed. As well as ranking the items, this exercise also thoroughly mixes them, starts to establish co-ownership, and leaves the idea papers looking tired and used – helpful if the group have trouble letting go. Perhaps you can use a physical commitment method to form work groups around the most interesting ones.
Expected output: Ranked ideas
Understanding, Clustering, and Ranking Options Idea portfolio
A slightly more analytical selection method for quick but reliable sorting.
Ideas are ranked according to two variables and arranged on a portfolio or graph. 51 Because two variables are used, the method can balance different needs and appeals to analytical mindsets. It prepares the groundwork for an informed decision, and even allows a strategic view of the options.
Prepare and use: Decide on your criteria: “Impact on customer experience” against general “Feasibility” works very well. Mark up a portfolio (graph) on the wall or floor. Taking one idea at a time, ask the group (or a subgroup) to assign 0 to 10 points for each variable and position it on the portfolio. The discussion they have now is as important as the tool. When all ideas are laid out, talk about which to investigate. Often the ideas with high impact and high feasibility are the most interesting, but you need a varied selection, so you might include some other ideas for their long-term benefits, or for idea diversity. Take the shortlisted ideas into further exploration, perhaps via journey maps, blueprints, or prototyping.
Expected output: Ranked ideas, visual idea portfolio
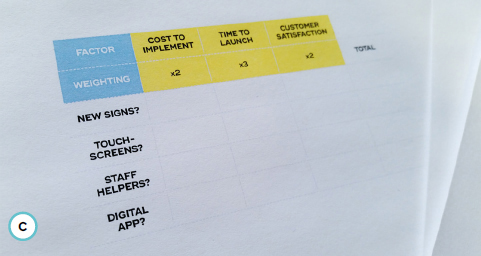
Understanding, Clustering, and Ranking Options Decision matrix
A more analytic, multiple-factor approach to decision making.
This MCDA (multiple criteria decision analysis) method 52 is welcomed by analytical thinkers. It includes several criteria in the decision, but lets us consider them one at a time.
Prepare and use: Collect your options and list them down one side of a table. Write the decision factors as headings for the columns of the table. If you want, give each decision factor a weighting. Be careful – small differences in weighting will strongly affect the outcome. For each idea, assign a value for each factor. Multiply the value by the weighting and write it in the box. The idea with the highest total value is the one to consider first, but you should choose a mixed group to take further.
Like with many “decision” tools, the discussion while using the tool – even while selecting decision factors and weighting – is as important as the tool itself. This tool can lead to very long discussions, where teams are basically guessing values. Point this out, and use the tool to highlight the gaps in understanding, then use research or prototyping to inform or replace the discussion.
Expected output: Ranked ideas or options
Reducing Options Quick voting methods
Quick ways to get the majority view, for larger groups and small teams.
Often, groups faced with options or decisions will slip into discussions, simply out of habit. Adopt quick techniques to explore which ideas, insights, or datapoints are most interesting or see if the group has already made a decision. 53
Prepare and use: Dot voting gives each team member a fixed number of sticky dots or pen marks to show favorites. Barometers let us assess every option by marking ratings on paper labels or holding a stickynote in the air to show approval or disapproval (perhaps with a Likert scale from +2 to –2). “Nose picking” lets teams or small groups see if they already agree. Each team member puts one finger on their nose, and they all count together to three and quickly put that finger on their preferred item. Anyone who hesitates has lost her vote.
Before using techniques like these, you might want to (quickly!) agree on criteria. If in doubt, ask, “What is most promising right now?” Then apply these techniques to support decisions, or see if one has already been made, not to make them. They should not replace important discussions, but can quickly reveal if discussion is necessary.
Expected output: Revealed decisions, ranked ideas or favorites
Reducing Options Physical commitment
A way to quickly pinpoint popular ideas and form teams for the next step.
These physical choice methods let everyone see who supports an idea and who wants to be in which group, and any changes are quick, easy, and obvious. 54
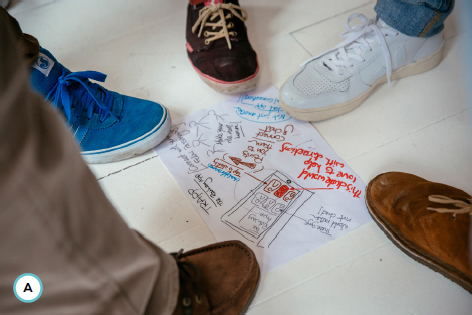
Prepare and use: In a floor gallery, participants browse papers laid out on the floor. They show support or join a group by standing on a piece of paper. Use this when the items are larger or need time to read – like elevator pitches, idea sketches, or service ads.
In Coraling, group members look at items on the wall and put their finger on a favorite. Others join by touching the shoulder of the first person, forming lines and branches like coral. Use this variant for anything which is tricky to take off the wall, like clusters of sticky notes.
If you are forming groups, now look at the groups. Are they viable? Too small, too large? Who might change groups and help out elsewhere? Which important ideas are the group ignoring? If you are selecting ideas, is there enough balance and variation? Which important ideas are missing? What needs more attention?
Expected output: Ranked or selected ideas, new working groups (if used for group forming).
A floor gallery. The options are spread out on the floor, and team members stand on the ones they are interested in.
Coraling to form workgroups. Participants at a workshop start to choose clusters which interest them and place hands on others’ shoulders to “join up.”
A decision matrix. Like all decision tools, this does not make the decision, but supports the process and the conversation around it.
Cases
The cases in this chapter show how formal and informal ideation combines with other activities within a successful project. They discuss ideation and co-design with customers (“Case: Opening the Design Studio to Your Customers”), how ideation methods can be hybridized to fit a project (“Case: Co-Design With Hybrid Methods”), solutions emerging from research (“Case: Building on Solid Research”), idea generation through a mix of methods (“Case: Mixed-Method Ideation”), and the use of visualizations and misunderstandings to encourage creativity (“Case: Supporting Creativity With Trigger Visuals”).
6.5.1 Case: Opening the design studio to your customers
KLM cares: Developing ideas through co-creation with customers
- — Marcel Zwiers, Founding Partner, 31Volts
6.5.2 Case: Co-design with hybrid methods
- — Florian Vollmer, Partner and Chief Experience Officer/CXO, InReality
- — Chris Livaudais, Creative Director, InReality
6.5.3 Case: Building on solid research
Creating digital tools for mental health and employment support in the UK
- — Sarah Drummond, Co-Founder and Managing Director, Snook
- — Valerie Carr, Creative Director, Snook
6.5.4 Case: Mixed-method ideation
- — Marc Garcia, Professional Questioner, We Question Our Project
- — Itziar Pobes, Project Brain, We Question Our Project
6.5.5 Case: Supporting creativity with trigger visuals
Using customer journey mapping to understand cookstove users in Kenya
- — Fiona Lambe, Research Fellow, Stockholm Environment Institute
- — Hannah Wanjiru, Research Associate-Energy, Stockholm Environment Institute Africa Center, Nairobi, Kenya
- — Sophie Andersson, Senior Service Designer, Transformator Design
- — Per Brolund, Senior Concept Designer, Transformator Design
- — Erik Widmark, Co-Founder and Service Designer, Expedition Mondial
- — Susanna Nissar, Co-Founder and CEO, Expedition Mondial
Case: Opening the Design Studio to Your Customers
KLM cares: Developing ideas through co-creation with customers
AUTHOR
Marcel Zwiers Founding Partner, 31Volts
Over the last decade or so, many airlines – including KLM – have focused on providing more and more self-services, empowering their customers to take control of their travel experiences. Services that used to be delivered by the ground stewardesses now belong to the customer, from printing out your boarding pass to labeling and checking in your luggage. Checking passports, printing boarding passes, and lifting suitcases onto conveyor belts became a thing of the past for KLM staff. But what would the future look like? If the the team were no longer depended on to do these tasks, what then?
In many projects, a question or challenge is often answered by a solution. In this case, the idea was to provide the staff with more freedom to provide the KLM customers with a positive travel experience. But what does freedom look like? How much freedom are we talking about? And, even more difficult, who will be managing this newly acquired freedom?
Our main goal was to use (service) design in order to learn as much as we could from the people that KLM cares deeply about: the world travelers entering, leaving, or just transferring through Amsterdam Airport Schiphol. We tried to understand what it was they valued, what was important to them, and what it meant to travel the world.
Let me take you one step back … In 2010, the Eyjafjallajökull volcano in Iceland erupted, putting huge amounts of ash into the atmosphere. For five days, most flights to and from Europe were canceled, leaving many people stranded in airports. The Amsterdam Airport Schiphol was also closed. But something interesting happened – most of the KLM staff headed to the airport. Not because they had to – there were no flights leaving – but because they cared. The KLM staff took their freedom not for their personal benefit but to be there for the people stranded at Amsterdam Airport Schiphol.
This event and the many things that happened after ward meant a lot for KLM. It was also, although indirectly, the starting point of several service design projects we started. from the “Wall of Inspiration,” to the “Idea Canvas,” to the SurpriseUs game, to designing the book No Day Is the Same, for which we collected more than 100 stories.
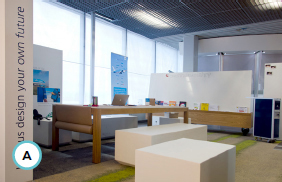
Service Design Studio
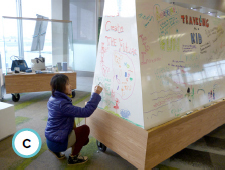
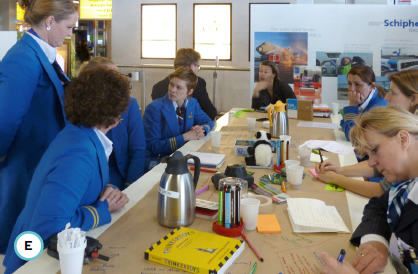
All these small projects led to the Service Design Studio we created for KLM, right in the middle of all the buzz at the airport. For two months in the spring of 2013, we were open almost 24/7 to talk to people. The Service Design Studio was an open space without doors, so everybody could drop by to ask questions and participate.
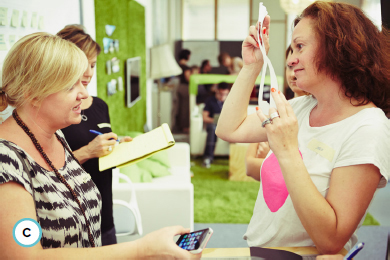
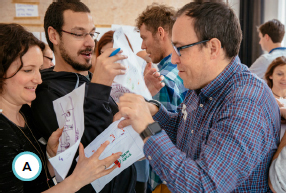
The beautiful Service Design Studio was created in the middle of the airport to engage customers.
The KLM staff worked together to understand their customers.
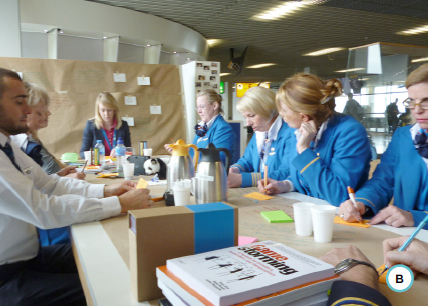
Customers shared their input about their travel experiences.
Eriano Troenokarso, a designer from 31Volts, made a visual summary at the end of every week.
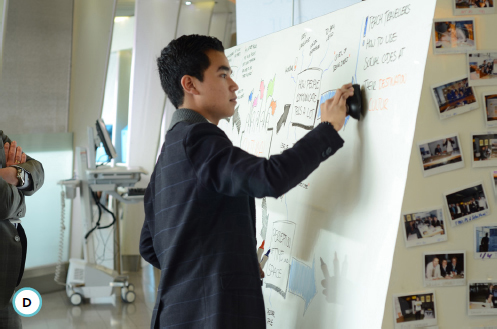
The staff took ownership of all projects.
Design as the language
Talking to people in design means engaging them in activities, using design to help people to express themselves. Every week we picked a relevant topic to work on, from “Traveling with kids” to “Peace of mind” to “Connectivity.” With the studio as a context and using small designerly assignments, we had KLM staff engage with the people traveling through Amsterdam. The design approach and the way of working was new to them. However, the goal was to work together with the people visiting the airport, which was familiar territory.
The combination of the new way of working within a comfortable environment worked surprisingly well. The Service Design Studio turned out to be a safe haven for both the staff and the passengers to have conversations about an even better customer experience.
Conclusion
What about the freedom? All project teams were built around KLM staff taking ownership of the goals we set. They were the true designers.
We are very proud of the Service Design Studio and the things we accomplished together with and for KLM. It hasn’t been an easy path. For an organization that is highly dependent on doing things fast, safely, and on time, the explorative and creative nature of a designerly approach is hard to incorporate – especially when the outcome of the project isn’t clear from the start. And when we finally delivered the more than 50 insights, the question remained, “Who would take the next step?”
Together with KLM, we learned a lot during this time. The most important practical lesson might well be the value of a designerly approach in an open environment to engage people. Talking to people by way of doing things together creates a deep understanding of the relationship your organization has with its customers.
Key Takeaways
01 When a customer-centric organization or customer-centric culture is a key aspect of your service design project, make the project room stand out and ensure that it is accessible to everyone who wants to participate. Make it a project in itself.
02 Designing out in the open and for everyone to see might feel uncomfortable at first. Don’t worry – your vulnerability is your strength. Any discomfort will pass faster than you expect.
03 Provide service design tools for the non-designers from your client organization to guide them. Conversations about innovation are different from daily reality.
04 Set daily or weekly goals (e.g., by introducing themes for working in the studio).
05 “If you don’t do this, you will die,” was the remark one passenger made, referring to the need for listening to your customers in ways that go beyond a regular survey. This was the best compliment the KLM Service Design Studio could wish for.
Case: Co-Design With Hybrid Methods
From vision to reality in 90 days
AUTHORS
Florian Vollmer Partner and Chief Experience Officer/CXO, InReality
Chris Livaudais Creative Director, InReality

Project background
Imagine you are in need of a new kitchen faucet. Where do you start? For many, the answer may be to visit a local kitchen and bath showroom. Once there, you are faced with a sea of options. Shiny fixtures of all shapes and sizes cover the walls. Tiny nameplates, manufacturers’ part numbers, and features too technical to understand flood your senses. Eventually, you might be greeted by a sales associate who, if willing and engaged themselves, begins to help you through this process toward the selection of your dream kitchen faucet. The process leaves consumers overwhelmed and unlikely to stay loyal to any one brand.
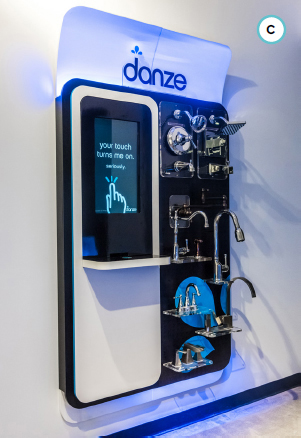
The journey just described happens repeatedly, in variations, all over the world. This was the situation facing Danze, an “affordable luxury” brand in the kitchen and bath space. Danze wanted to become a recognized leader in the industry. They envisioned an innovation that served two purposes: (1) to create such a dramatically better customer experience that (2) a new channel partner is compelled to implement the experience on the showroom floor.
The people and the design brief
A key driver for this project was visionary CEO Michael Werner. He and his team approached InReality, and collaborated actively at all stages of the project. His energy also invigorated his internal sales and marketing team, as well as his operations group – we had a base level of buy-in from the beginning. Outside collaborators such as advertising agency and trade association representatives were important partners early on. In an industry where innovation is moving slowly, this shared authorship helped pave the way to quicker adoption of service innovation. How did we build the vision for this new, reimagined showroom experience?
It was clear that the traditional presentation of products on slat walls left little room for imaginative customer experiences or brand building beyond a simple logo on the wall.
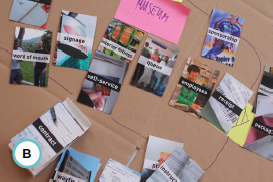
Together, we evaluated the latest innovations in automotive showrooms, best-in-class retail, and leading museum experiences (London’s V&A, amongst others). Interviews with some of the creators of these experiences helped our client understand what it takes to make a bold vision a reality. Observational research and interviews with sales associates rounded out the first phase.
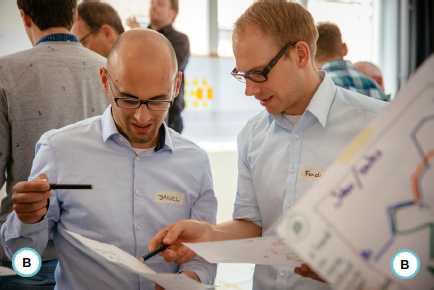
From understanding to creating: Service design tools “out in the wild”
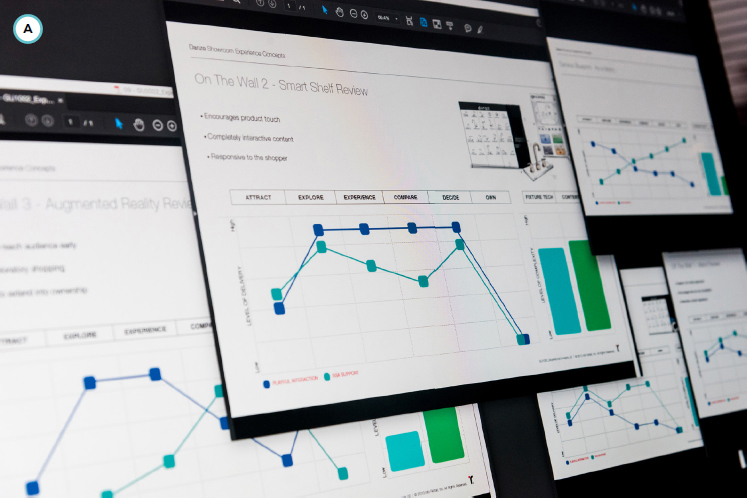
Using co-creation methods, the team at InReality facilitated a collaboration workshop with key stakeholders. Activities moved us quickly from the sharing of objectives into a collaboration space, one that empowered every single participant in the room to contribute and share their voices. The culminating event was a bodystorming/customer journey hybrid – essentially a stop motion of a typical customer journey where our customer would act out journey steps and then state their feelings at each moment in the journey. Participants watching each scene were asked to share insights from their perspectives: brand, product, marketing, operations, sales, and so on.
During a series of pre-meetings, it became clear that we would have to plan for a way to infect all project stakeholders with a passion for what would be possible.
Taking an approach of live journey mapping versus presenting a static slide deck resulted in a heightened level of empathy not only for the user but also for other (internal and external) stakeholders. Participants shared freely what they loved about various steps in the process and what they found challenging, forming a rich design brief for subsequent phases.
The solution
Our co-created customer journey evolved into a service blueprint, outlining requirements for the physical form and digital components. Customer-centric thinking, stake holder awareness, and a sophisticated interpretation of brand form language were merged with a deep understanding of digital technologies.
Product samples are mounted on RFID-enabled, removable bases. Customers or associates can place the product on a “Smart Shelf” containing an RFID reader mounted below the touchscreen display, delivering dynamic content based on the product placed on the shelf. From there, shoppers can navigate through product details, material finishes, coordinating products, and more. The solution allows for a “three-way conversation” between the physical product, the digital content, and the people interacting with it all. When not in use, the screen works as a brand-centric messaging platform, attracting customers and reinforcing top-of-mind brand awareness with showroom representatives.
Throughout our research, we directed the focus on “service design grit” – the hard work of making a service vision a reality. The findings, along with the strategic business requirements, made for a robust design brief from the onset of the project.
The workshop was nothing short of amazing: the energy in the room was immense and a feeling of shared accomplishment by all truly was deep-felt.
The buying experience for the customer and the selling experience for the showroom representative were so dramatically different that our client was easily able to break into the new sales channel, strategically widening its distribution base. The adoption by the showroom partner happened in greater numbers and at a faster pace than initially projected.
The solution requires less linear wall space (less money spent for products on display) and adds a level of engagement previously not seen in these showroom environments. And the digital interactions can be tabulated and analyzed in a way that was never possible before.
Making it a reality
We produced and deployed the system to hundreds of locations in three months. Yet, initial usage of the smart shelf was not as high as anticipated. What was going on? Rather than pointing blame, our collaborative client–agency relationship allowed us to proactively seek a solution. A quick round of heuristic ideation revealed that perhaps the attract loop content did not have the immediate stopping power we desired. We suggested a change to the screen content with a stronger call to action. Working with an agency partner, we redeveloped the narrative and quickly pushed changes to the field. This improved usage rates dramatically.
Using service design tools tightly integrated with traditional marketing and industrial design tools resulted in a rapid development cycle and an industry-leading experience, ultimately exceeding the client’s business goals.
Key Takeaways
01 Live journey mapping can lead to amazing levels of participation and buy-in.
02 Digitally driven experiences offer great value – we can now enter the market with a minimum viable product (MVP) and iterate on it afterward.
03 True partnership with all stakeholders builds a trust and long-term mutual respect that encourages proactive thinking and problem solving.
Case: Building on Solid Research
Creating digital tools for mental health and employment support in the UK
AUTHORS
Sarah Drummond Co-Founder and Managing Director, Snook
Valerie Carr Creative Director, Snook

Mental health in the UK is costing the government around £70 billion per year, 55 and that figure continues to increase. In 2014, the Department of Health (DoH), Department for Work and Pensions (DWP), and RAND Europe report outlined existing evidence around mental health interventions and made a call to “provide access to online mental health and work assessments and support.” 56
Snook was commissioned in partnership with The Point People to conduct research to explore future opportunities for digital products and services, specifically looking at the potential of digital to scale up access to frontline services that exist to support positive mental well-being, and also at self-management and how processes like cognitive behavioral therapy (CBT) could be scaled.
The project was undertaken with sponsorship by the Government Digital Service (GDS) and focused on executing a discovery phase, outlined in the GDS Service Manual. 57 During this phase, our focus was on identifying opportunities and user needs across varying stages of employment that could then be taken forward by design teams to later work up solutions.
As a research and design team, we were focused on not producing “solutions” for two reasons:
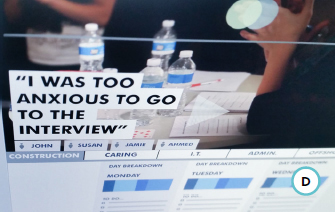
The discovery phase is about the identification of user needs aligned at core stages of employment, such as “As a line manager, I need tools to recognize my employees’ mental well-being so that I can support them before they reach crisis points” and “As someone who is unemployed, I need encouragement and tools that give me belief in my own abilities, because I have low self-esteem.”
The system we were designing for was more complex than one or two products of the Government Digital Service. Our results could end up being used in a variety of contexts, from suggesting content and tools housed on NHS Choices, to creating principles to stimulate the private sector market, to developing digital tools that meet needs.
“If someone is off work with broken arms and legs, people rally around them. If someone is off work with mental health problems, they’re like ‘Oh, they will pull themselves together’ sort of thing … A lot of places need to understand it a little bit more.”
— Charles (research participant), 45 years old
We conducted user research with people throughout the UK, from Dundee to Brighton, to gain understanding of their experience of being in and out of work and the impact on their mental well-being. The people we interviewed were not diagnosed with mental health conditions and a full breakdown of demographics can be found in the project report, including the ability to use technology.
Phases of research
Snook’s research was in two phases:
Discovery phase: User research investigating people’s experiences of accessing support for mental well-being and their current use of digital platforms
Pre-alpha phase: Co-designing digital platforms and tools that could support people to maintain mental well-being throughout their employment journey
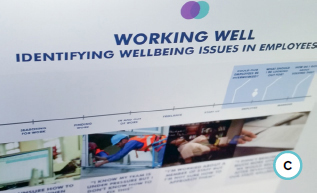
Snook’s sessions included in-depth interviews, focus groups, and workshops, all using bespoke tools developed specifically for the project. These helped in the creation of visual maps of people’s employment history, clearly illustrating highs and lows of mental well-being and opportunities for digital innovation in service delivery. 58
As a discovery project, our core findings were vast, so we split these down according to core stages of employment and user groups. Within the “in work” stage, our core findings highlighted the need for a greater set of resources and tools within the workplace for both line managers and staff to discuss and manage well-being. Our research highlighted key moments where and when this would be needed, from embedding tools into email accounts to annual review processes.
In the “finding work” phase, we highlighted a need to support people in thinking proactively about job searching, including alternative options like networking and skills development and how other people had achieved this in practical terms. Our research therefore picked up both macro and micro needs/insights across the employment journey.
The focus was on three main phases of employment: finding work, being in and out of work, and managing work. Based on extensive user research, we created a set of design briefs presenting needs, insights, and challenges, each with its own case study. In addition, we outlined a list of design principles relevant to anyone developing digital tools in this field.
Key tools and processes
There were three key tools and processes utilized in the project – use cases, life journeys, and low-fidelity wireframes. These were chosen so a product development team could easily build on our framed user needs with deeper research and subsequent service designs by understanding the context to design for.
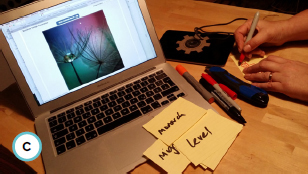
The ideation sessions included a variety of methods, like sketching, looking for analogies in other industries, and creating journey maps and low-fi mock-ups. The designers brought form to ideas through sketching, all of which corresponded to the identified use cases. They developed ideas in timed sessions, working through each use case, identifying useful content for users, or sometimes joining several needs and use cases to form a standalone product or service opportunity.
Showcasing high-fidelity prototypes to user groups.
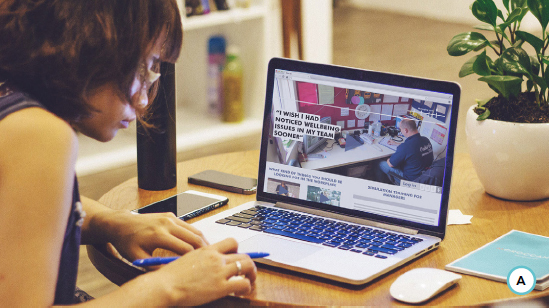
A high-fidelity wireframe showcasing the data hierarchy and a profiling tool to deliver tailored information for user groups.
Mock-ups produced to highlight our strategic recommendations on integrating with existing employment journey tools in the system.
A high-fidelity mock-up showcasing our alpha stage formed concepts from user-led content to tips on reducing anxiety at key moments in the “out of work” stage.
We developed concepts through discussion, utilizing sketching to bring basic form to ideas. We identified one or two key features so we could recognize each idea later on, focus on the function of the concept, and quickly articulate it to others. We also looked for examples of innovations and existing products and services that were used to inspire similar concepts, but applied within the context of mental health and the scenarios we were designing for.
To further concepts, we sketched journeys of users and the concepts we were developing to articulate features of the service concepts and the delivery mechanisms that might be involved to make them a reality. This helped us not only to provide service and product design propositions, but to articulate stakeholders within the system of government, employment, and health who could be the delivery mechanisms.
After our core ideation sessions, we produced low-fidelity mock-ups, focusing only on features. The mock-ups did not include any visible aesthetic design features like color or defined fonts. We used this process to come to concrete design decisions on the core features of the different ideas we were creating and, through this whole process, consider how they might work together in tandem as a system of products and services.
“This research into likely user groups, needs, and preferences for a potential online mental health and work assessment and support tool provides invaluable insight into experience and need within our population. It provides information on people’s experiences of living with a mental health condition and service provision. The research outlines where a digital service could benefit particular groups and through the early design and testing of prototypes provides a range of ideas for potential online tools.”
— Lauren Jones, Policy Lead for Mental Health and Work, Department of Health
Looking ahead
This project was a new way of working for the DoH, which has historically employed market research techniques to inform digital development. The depth of insights generated through this user research exceeded the clients’ original expectations and have been carried forward into various work packages through NHS Choices, the DWP, and the DoH.
The ongoing projects our clients were undertaking at the time were able to utilize the strategic recommendations, ideas, and wider user needs and insights we identified to inform the products and services in current development. Throughout every stage, we sought to ensure there were projects already instigated that could utilize the results to inform their work.
While this was a research project specifically for a digital tool, some of the findings have been useful for informing wider policy decisions and have been presented to Nesta, NHS Choices, and the wider GDS teams. The DoH welcomed these reports and has made them publicly available so that they can inform the future design of mental health and employment support.
Key Takeaways
01 When undertaking discovery research, ensure that you are not forming solutions before identifying user needs and that insights are clearly identified and communicated.
02 Utilize journeys to consider the wider end-to-end remit of where a product or service moment fits in context with the wider system. Use this when researching to uncover insights and also to present needs at a later stage.
03 When “working live,” make sure you understand the wider system of organizations, people, other stakeholders, and ongoing programs of work. This is so you can identify as you go where your developing project knowledge can be fed into (and how) and you can strategically position your work to increase the likelihood of positive impact.
04 Focus on function, not form, especially when testing prototypes. Keep everything low fidelity for as long as you can to ensure you test the proposition.
05 There is no silver bullet to “solve” mental health. The problem of service support is not owned by one department or organization, and you cannot design a “solution.” Ensure the insights about how to design a product or service are clearly articulated and useful for a follow-on team or funder to learn from when embarking on their development within one part of the wider system.
Case: Mixed-Method Ideation
Opportunities for innovation in patient experience
AUTHORS
Marc Garcia Professional Questioner, We Question Our Project
Itziar Pobes Project Brain, We Question Our Project
WE QUESTION OUR PROJECT

Sant Joan de Déu–Barcelona Children’s Hospital is locally seen as a synonym for innovation and empathic care of patients and families. In their own words, it is “a humanistic hospital.”
In 2015, Sant Joan de Déu was the first hospital in Spain to set up a Patient Experience department to systematically rethink – and redo – its care model by involving patients, families, and staff through service design thinking methods.
Uncovering opportunities
Barcelona-based service design studio We Question Our Project collaborated in one of the new department’s foundational projects. It comprised a broad study of the experience of several types of patients and their families: children and young adults up to 18 years old with diabetes or complex chronic conditions, international children with oncological and orthopedic diseases getting specific treatment unavailable in their countries of origin, and pregnant women. The research was aimed at uncovering opportunities for new digital and face-to-face services.
“This is the first time we have seen the patient’s treatment process as a whole.”
—Head of Diabetes Care
Fieldwork included observations, mobile ethnography, and in-depth interviews with families, patients, and almost all the range of professionals that work within the hospital: nurses, doctors, staff of support services (admissions and reception, customer service, social service, coordination of volunteers and donors, communication, digital marketing, and management). We then synthesized all that data into detailed – and valuable – user journey maps.
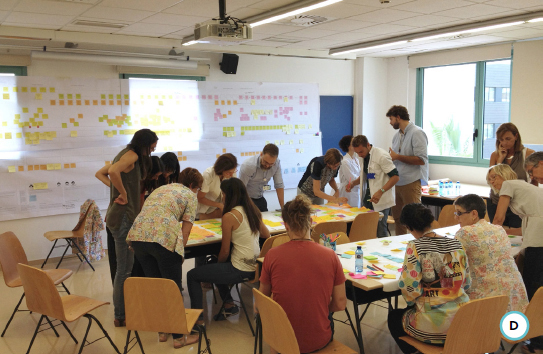
Due to the very tight schedules of hospital staff, it was challenging to involve them actively. We had to fix workshops months in advance and squeeze them into two-hour slots, which included putting everyone back on track, moving forward, and collecting results – there was almost no time left to create a safe space!
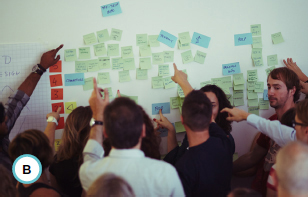
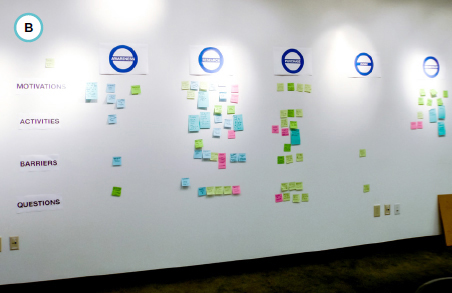
We started by having professionals related to each type of patient observe their corresponding user journey and make an individual traffic light assessment – what was already working (green), what could be improved (amber), and what was not working at all (red) – with an additional round of what was missing. After sharing and clustering everyone’s notes, they translated the categories into ideation questions starting with “How might we …” At that point, we noticed that most of the issues they had identified in separate user journeys were surprisingly similar. There were eight big opportunity areas across patient types and services, such as managing fear and expectations or making children feel normal (as opposed to sick) while in the hospital.
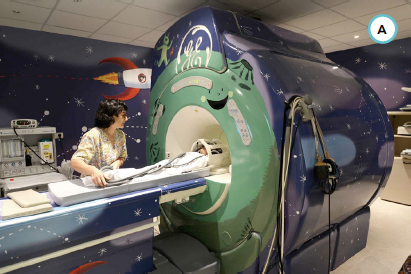
Special facilities, such as this image diagnosis room, and procedures have been part of the Sant Joan de Déu’s efforts to ease children’s time in hospital for years, even before the Patient Experience department was created.
While doing ethnographic research with the Patient Experience team, our project room was set in the hospital nursing school. On the wall, clusterings of pregnant women’s verbatim statements. On tables, early structures of two treatment processes. On the floor, the complex chronic user journey in the making.
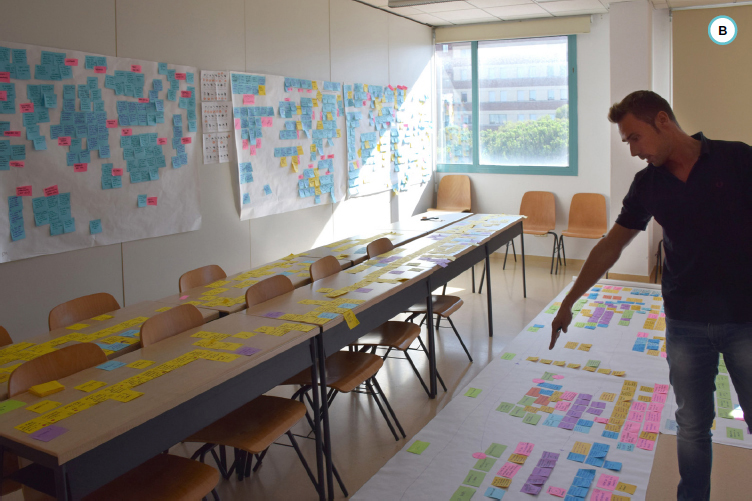
We shared preliminary research results in the form of user journeys with relevant stakeholders and asked them to contribute with additional knowledge. In some cases, reading patients’ own words was a shock, but it sparked meaningful conversations around the need to change procedures or attitudes.
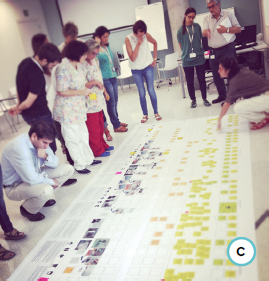
Hospital staff integrated the research results by doing a traffic light assessment of user journeys, and moved into ideation by translating emerging topics into “How might we …?” questions.
Ideas to prototypes
From that moment on, we no longer worked in patient-related teams, but mixed staff from different units. We generated tons of ideas through brainwriting rounds with different angles and prioritized them using a bull’s-eye: most relevant in the center, least relevant outside. Ideas were developed into concepts by quickly sketching and describing how they would work; identifying who would be involved; and considering how innovative, feasible, and impactful they would be.
“I feel hope every time we meet. We are actually working to improve problems I see on a daily basis.”
— Case manager for international patients
Finally, staff also contributed to taking concepts further through prototyping. Some teams sketched new systems and procedures in detail. Others focused on digital tools and were able to produce early versions of interactive mock-ups. We refined those prototypes just enough to check them with patients and families in guerrilla tests around the hospital.
A long-term vision and action
After prioritizing the projects again with an idea portfolio, some are already being put into practice by Patient Experience and the relevant stakeholders – for example, context-sensitive ways for communicating bad news and a resource center for families.
This case also proved the value of a service design approach to the management. Beyond discrete projects, patient experience has become one of the foundations of the new strategic plan of the hospital.
Taking a broader approach was key to building a long-term vision with projects for the next few years. Involving staff from different units and levels both as informants during research and as co-creators since then developed a shared understanding and a goodwill for change.
Key Takeaways
01 Don’t be discouraged if the conditions for collaborating with stakeholders and users of your service design project are not ideal. Embrace the constraints and make the most of people’s commitment.
02 No matter how rigid your schedules, be prepared to come across unexpected results – and to adjust your work accordingly.
03 Participants with little experience in innovation or design tend to mix up opportunities and solutions. Make sure you frame clearly what stage you are at in the ideation process and what you expect to produce.
04 When generating ideas in teams that work together usually, they may have discussed the same topics over and over. Let them express themselves, but make them go beyond complaints and ordinary solutions by asking for more alternatives.
Case: Supporting Creativity With Trigger Visuals
Using customer journey mapping to understand cookstove users in Kenya
AUTHORS
Fiona Lambe Research Fellow, Stockholm Environment Institute
Hannah Wanjiru Research Associate-Energy, Stockholm Environment Institute Africa Center, Nairobi, Kenya
Sophie Andersson Senior Service Designer, Transformator Design
Per Brolund Senior Concept Designer, Transformator Design
Erik Widmark Co-Founder and Service Designer, Expedition Mondial
Susanna Nissar Co-Founder and CEO, Expedition Mondial
Despite decades of donor and government financing, three billion people worldwide still cook on smoky traditional stoves and open fires, and a large-scale shift away from the traditional use of biomass for cooking has yet to occur in many developing countries. This results in 4.3 million annual deaths from respiratory illnesses. Still, typical methods for understanding behavior tend to be quantitative and tell us little about exactly how and why households adopt (or fail to adopt) and use improved cookstoves and cleaner fuels. Service design methods helped to shed new light on the needs and wider contexts of improved cookstove users in Kenya. The work led to concrete insights for the specific context, but could also be used to improve the way in which better cookstove programs are designed and implemented in other developing country settings in the future.
In September 2015, a mixed team of service designers and SEI researchers conducted 19 in-depth interviews with households in Kiambu County, Kenya, with focus on the adoption and usage of a biomass pellet stove from Philips. We partnered with SNV Netherlands Development Organisation, which distributed the stove, and with a local micro-finance institution, VEP (Visionary Empowerment Programme), which provided loans to the women to afford the stove.
“It was really useful for us to see the full journey for the women – not just receiving the stove, but how they get information, how they learn to use the stove, and how they cope if something goes wrong. This helps us to see where problems might pop up now and in the future, and how we might solve them together with our partners.”
— VEP field staff
The interviews were conducted with the help of a local translator, and in order to overcome language barriers we used visual material showing different situations and suggestions related to cooking. This visual material triggered the respondents to share stories and helped us facilitate the interviews. When displaying the visuals, we asked “What is this?” “How would you use this?” or “What if things looked/worked this way?” and they started to share their stories. After our first set of initial interviews, we could see patterns within the customer journey that were not ideal for them as end users. In order to understand more about those problem areas, we used other visual material to show the respondents new situations, new services, or different stove designs.
The overall ideation process
In the first round of interviews, the users claimed to be happy with the usage of the stove and had no suggestions for improvements. But when shown images of stoves with different simple variations in height, width, or fabrication materials, suddenly something happened. Users spontaneously started talking about the pros and cons of the different designs, which also gave clues on how they experienced using the current stove: for example, “Oh, I would love if it was higher, then it wouldn’t burn the food,” or “A wider stove would definitely make less pellets go to waste at the bottom.”

They even started coming up with new suggestions for designs, services, and solutions. When different respondents were presented with ideas for alternative stove designs over and over again, they automatically refined relevant ideas and sorted out the irrelevant ones.
“This was useful for us to understand the daily logistic challenges faced by our field staff in trying to deliver the stoves and how we can address these challenges together to make the system smoother for the customer.”
— VEP Managing Director
Misinterpretations, assumptions, and evaluations of what they saw in the visuals were encouraged. This was an important part of the ideation process, where simple, rough drawings left space for interpretation and allowed the respondents to fill it with their own needs and wishes. The core activity within the ideation process, as any service designer would know, is not to confirm ideas generated by “designer geniuses,” but really to co-create together with the users. Ideas and innovations have no value on their own unless the ideas meet the needs of the user.
Thanks to the iterative process of interviews and ideation, we could both co-define the challenges connected to adopting improved cookstoves and co-create the solutions together with the end users.
Some of the challenges for the end users were hands-on practicalities, such as the logistics of getting the new fuel and stoves to their homes. Others faced challenges in lack of support during the crucial startup phase, where their new habits are beginning to be formed. It was also difficult for the end users to compare and evaluate different types of fuels because of different usage and payment models.
The use of half-finished visual material invited respondents to fill in the gaps. Here, respondents were presented with a mock product presentation leaflet. In response, they would speak about what aspects of the product they would want information about.
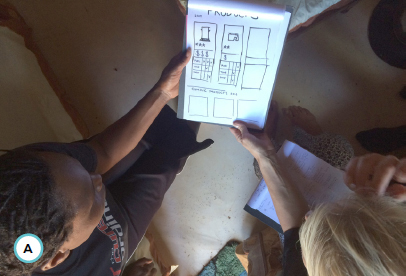
Trigger material was used that pictured products, situations, and themes.
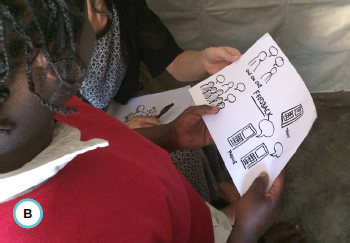
After respondents had built their own customer journey out of pictures and words, they were asked to draw their emotional journey, which resulted in more nuanced and in-depth stories.
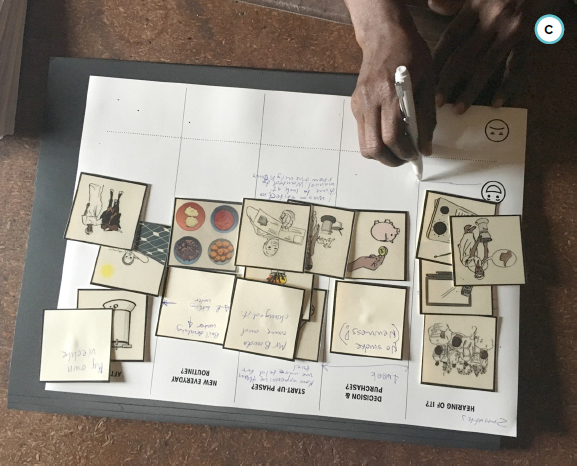
The customer journey map incorporated the experience of stove users, their families and friends, the distributors, NGOs, and the government to fully understand their perspectives.
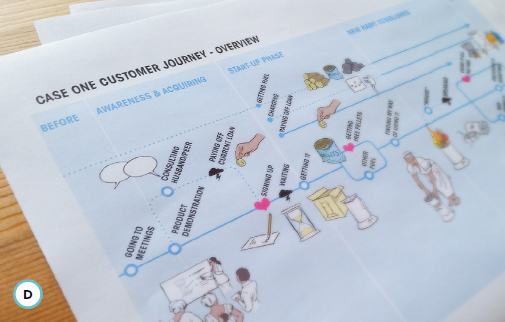
“Starting from the customer journey map is good because it shows how everyone – the stove users, their families and friends, the distributors, NGOs, and even the government – fits into the system and how we can collaborate to improve the user experience.”
— SNV program officer
The CJM as a communication tool for stakeholders
The user’s experience of acquiring and using an improved cookstove was summarized and visualized in a customer journey map. This map showed bottlenecks and thresholds for achieving widespread adoption of improved cookstoves. We used the map in a stakeholder workshop as a base for sorting out roles and relations between stakeholders. It proved to be a crucial communication tool, as it created a common understanding with the end user’s needs and experience as the unifying focus.
Based on the outcomes from this case we were invited to apply the same methods for a cookstove company working in Zambia in spring 2016.
Key Takeaways
01 When interviewing across language barriers, use visuals to start the conversation and make sure translators have an understanding of the methodology.
02 Visual material showing artifacts, situations, or themes related to the topic of interest can help respondents open up and verbalize their thoughts and experiences.
03 The ideation process should not be an isolated phase for designers exclusively. It needs to be embedded within the research phase and end users should be invited in order to find the most relevant solutions.
04 Using the end users’ experience as a reference point helps sort out which actors and aspects in the surrounding service ecosystem are relevant to understand and improve the service or system.
1 In his 2015 TEDTalk “The Single Biggest Reason Why Startups Succeed,” (https://www.ted.com/talks/bill_gross_the_single_biggest_reason_why_startups_succeed) Ted Gross suggests that the main success factor is not idea quality, but the timing and skills of the team. Timing is especially relevant to us, as service design can get prototypes and pilots on the road earlier.
2 The link between idea quantity and idea quality is still debated (for example, see Paulus, P. B., Kohn, N. W., & Arditti, L. E. (2011). “Effects of Quantity and Quality Instructions on Brainstorming.” The Journal of Creative Behavior, 45(1), 38-46) – partly because it is very hard to determine what constitutes a “good” idea without launching all of them. In service design, the question is whether or not an idea is useful in moving forward. Even incomplete, flawed, or impractical ideas can be valuable if they generate useful questions or prototypes.
3 See 6.5.2, Case: Co-design with hybrid methods, for an example of successful postlaunch ideation.
4 In (company) politics, sticking to your ideas is usually seen as a positive characteristic. But in innovation, being ready and willing to switch focus is a key skill. In startups, we talk about the pivot, the “structured course correction designed to test a new fundamental hypothesis about the product, strategy, and engine of growth,” as a key success factor. Quote from Reis, E. (2011). The Lean Startup. New York: Crown Business, p. 149.
5 The role of the design facilitator in decision making is discussed in Chapter 10, Facilitating workshops.
6 See Dorst, K. (2011). “The Core of ‘Design Thinking’ and Its Application,” Design Studies, 32(6), 521-532. See also Kolko, J. (2010). “Abductive Thinking and Sensemaking: The Drivers of Design Synthesis., Design Issues, 26(1), 15-28. And see Martin, R. L. (2009). “The Design of Business: Why Design Thinking Is the Next Competitive Advantage,” Harvard Business Press.
7 The scope of ideation activities is sometimes defined during the previous activity in your project, often research or prototyping.
8 For example, see 6.5.5, Case: Supporting creativity with trigger visuals.
9 Again, you should make a conscious decision about when to share this knowledge with the team.
10 See 6.4, Ideation methods.
11 See Extended project team in 9.2.3 for more on team mixes.
12 See 6.3.2, Idea generation, and 6.3.3, Idea selection.
13 See the textbox Reflection out of action in 6.3.
14 See 5.1.2, Research planning for more on theoretical saturation.
15 It can be useful to give some ideation homework after this research homework. The ideas participants generate at home, outside the groupthink of the sessions, will be diverse and considered. There is a risk that they may fall in love with these ideas, so frame them as springboards for further ideation, or prototype them fast so they can fail and start to evolve.
16 Essentially, this is research. Indeed, many research techniques make great homework – such as autoethnography, service safaris, diary work, cultural probes, or interviews.
17 See http://www.theworldcafe.com.
18 But think twice before tasking all your participants to look at existing solutions, as this can actually reduce the diversity of their ideas. See for example Smith, S. M., Ward, T. B., & Schumacher, J. S. (1993). “Constraining Effects of Examples in a Creative Generation Task.” Memory & Cognition, 21(6), 837-845.
19 See several of these methods used in 6.5.3, Case: Building on solid research.
20 All of these methods are described in detail in 6.4, Ideation methods.
21 Currano, R. M., Steinert, M., & Leifer, L. J. (2011). Characterizing Reflective Practice in Design – What About Those Ideas You Get in the Shower? In DS 68-7: Proceedings of the 18th International Conference on Engineering Design (ICED 11), Impacting Society Through Engineering Design, Vol. 7: Human Behaviour in Design, Lyngby/Copenhagen, Denmark, 15.–19.08. 2011.
22 Kahneman, D. (2011). Thinking, Fast and Slow. Macmillan.
23 For example, see Mann, S., & Cadman, R. (2014). “Does Being Bored Make Us More Creative?” Creativity Research Journal, 26(2), 165-173.
24 For more on safe space, warm-ups, and idea facilitation, see Chapter 10, Facilitating workshops.
25 See, for example, work by Jihae Shin, reported in Grant, A. M., & Sandberg, S. (2016). Originals: How Non-Conformists Move the World. Viking.
26 It is usually suggested that distraction or delay gives the participants’ subconscious time to work on the problem. More modern “honing” theories of creativity suggest that it is more about forgetting barriers. Whichever you prefer, it works.
27 See Chapter 4, The core activities of service design.
28 These participants will be in “the groan zone” – see the accompanying illustration.
29 Kaner, S. (2014). Facilitator’s Guide to Participatory Decision-Making. John Wiley & Sons.
30 See the textbox Boundary objects in 3.2 for more information.
31 Davidson, A. W., & Bar-Yam, Y. (2006). Environmental complexity: information for human-environment well-being. In A. Minai & Y. Bar-Yam (eds.), Unifying Themes in Complex Systems, Vol. IIIB (pp. 157–168). Springer Berlin Heidelberg.
32 All of these methods are described in 6.4 Ideation methods.
33 See the illustration “A breadcrumb chain of evidence” in 9.2.8.
34 You can find more on indexing in 5.1.3, Data collection.
35 The term “products” describes anything a company offers – no matter if this is tangible or not. In academia, products are often divided into goods and services. However, products are usually bundles of services and physical/digital products. As “goods” is colloquially understood as referring to something tangible, we prefer to speak of physical/digital products. Read more on this in the textbox Service-dominant logic in 2.5.
36 Kano, N., Seraku, N., Takahashi, F., & Tsuji, S. (1984). “Attractive Quality and Must-be Quality from the Viewpoint of Environmental Lifestyle in Japan.” In H.-J. Lenz, P.-T. Wilrich, & W. Schmid (eds.), Frontiers in Statistical Quality Control 9 (pp. 315–327). Physica-Verlag HD.
37 The categories often have different names depending on the translation from Japanese, or the influence of other authors.
38 For more, see 10.3.4, Creating a safe space.
39 See 6.5.5, Case: Supporting creativity with trigger visuals, 6.5.4, Case: Mixed-method ideation (for examples), and 6.5.2, Case: Co-design with hybrid methods (for a modified version).
40 A stakeholder constellation is a physical model where people represent different stakeholders, standing arranged in a room just like on a system map. See the online description of this tool for more details.
41 This version of the exercise is based on IDEO’s 2009 Human-Centered Design Toolkit (https://www.ideo.com/post/design-kit), as evolved by minds & makers and others.
42 Osborn, A.F. (1963). Applied Imagination, 3rd ed. New York, NY: Scribner.
43 For more on brainwriting see Rohrbach, B. (1969). “Kreativ nach Regeln – Methode 635, eine neue Technik zum Lösen von Problemen,” Absatzwirtschaft 12, 73-53.
44 See Briefing and inspiring participants in 6.3.
45 Greenberg, S., Carpendale, S., Marquardt, N., & Buxton, B. (2011). Sketching User Experiences: The Workbook. Elsevier.
46 Gray, D., Brown, S., & Macanufo, J. (2010) Gamestorming. O’Reilly.
47 See Chapter 7, Prototyping.
48 Safe space is especially important for this method. See 10.3.4, Creating a safe space.
49 See, for example, 6.5.3, Case: Building on solid research.
50 We use a name which is more familiar to many service designers, but this is actually just a version of the excellent game Thirty-Five by Thiagi. See Thiagarajan, S. (2005). Thiagi’s Interactive Lectures. American Society for Training and Development.
51 The idea portfolio adapts the thinking behind similar decision grids, matrices, or portfolios. See for example Martilla, J. A., & James, J. C. (1977). “Importance-Performance Analysis.” The Journal of Marketing, 77-79. See also the Impact & Effort Matrix in Gray, D., Brown, S., & Macanufo, J. (2010). Gamestorming: A Playbook for Innovators, Rulebreakers, and Changemakers. Sebastopol: O’Reilly.
52 Pugh, S. (1991). Total Design: Integrated Methods for Successful Product Engineering. Addison-Wesley.
53 See also the bull’s-eye sorting method used before an idea portfolio in 6.5.4, Case: Mixed-method ideation.
54 Groups formed this way might be unbalanced (often beneficial in the short term), so use these activities to split up the group for the next task of a workshop, not to form long-term teams for a project.
55 Elliott, L. (2014). “Mental Health Issues ‘Cost UK £70bn a Year,’ Claims Thinktank.” Retrieved March 26, 2016, from http://www.theguardian.com.
56 RAND Europe. (2014). “Psychological Wellbeing and Work: Improving Service Provision and Outcomes.” Retrieved March 26, 2016, from https://www.gov.uk.
57 Government Digital Service (n.d.). “Service Manual” at https://www.gov.uk/service-manual.
58 Throughout the project, Snook held workshops with the funding partners (Department of Health, Department for Work and Pensions, and Government Digital Services) to present findings and identify priorities for research and development.