Chapter 5. Research
Challenge your assumptions; understand people and context.
Expert comments by:
Anke Helmbrecht | Geke van Dijk | Jürgen Tanghe | Maik Medzich | Mauricio Manhães | Phillippa Rose | Simon Clatworthy
5.1 The process of service design research
5.2 Methods of data collection
This chapter also includes
Move Beyond Assumptions
In service design, research is used to understand people, their motivations, and their behavior. Usually research is one of the first activities in a service design project, but it’s not uncommon for ideation, prototyping, or implementation to send a team back to research activities when new questions arise. Design research enables a team to:
→ Empathize with the people they design for and build up a genuine understanding of their practices and routines.
→ Immerse themselves in an unfamiliar area or subject and learn about the specific context they will be working in – which might be quite technical and specialized.
→ Step away from established routines and assumptions, looking at a certain topic with fresh eyes.
Mostly, researchers strive to find out how customers experience a specific physical or digital product, service, or brand (customer experience). Furthermore, research is used to study the experiences and behavior of different employees (employee experience) as well as other involved stakeholders. More generally, it can be used to reveal the ecosystem in which a certain theme, service, good, or product is embedded, including other players, places, artifacts, processes, platforms, and stakeholders, and to see how they are connected.
 Comment
“We view the research phase as a way to understand the world in the same way that the customer or employee does. If you feel that you do this, then you have a platform that makes your ideas and concepts better and more relevant.”
— Simon Clatworthy
Research is crucial in service design, as it helps a design team to move beyond assumptions. There’s a continuum from simple research for the inspiration of a design team to solid data that can reveal (valid) discoveries. Research can be divided into quantitative methods and qualitative methods. Both types are useful in service design. Quantitative research is often a good way to gain insights into the “what” and “how” of an experience, while qualitative research provides insights into the “why” – people’s motivations and needs. However, research can be used in various forms at different stages within a service design project. We might see initial research identifying user needs, discovering experience gaps and other problems. Then we have research testing prototypes, validating implemented solutions and assisting ideation (by systematically gathering existing ideas and avoiding reinventing the wheel). In all stages research is used to inform decisions based on real data and insights, rather than on assumptions that may be biased. 1
Service design research is a structured process with planned iterations. It starts with a research topic or one or more research questions and often aims to derive insights. Design research is based in user/human-centered design and usually includes ethnographic research methods. 2 When you start to explore this field, you might find that the methods and vocabulary used are often quite fuzzy or non-defined – it’s an issue that academics and designers often criticize themselves for. Also, this type of qualitative research feels a little unsafe for people who are more accustomed to quantitative research in a business context, but usually a qualitative approach turns out to be really valuable. 3 Instead of looking for “the” truth, qualitative research can provide insights into “a” relevant truth. Insights from qualitative research are often more actionable than mere quantitative data as they provide answers to the “why” questions. New perspectives and nuances come up. Communicating insights with quotes, photos, or videos of user realities can initiate change in organizations by creating a common understanding of the problem and motivating people to do things differently.
As this book is about doing, this chapter presents an actionable framework for service design research, based on common academic standards.
THE BASIC PROCESS OF SERVICE DESIGN RESEARCH
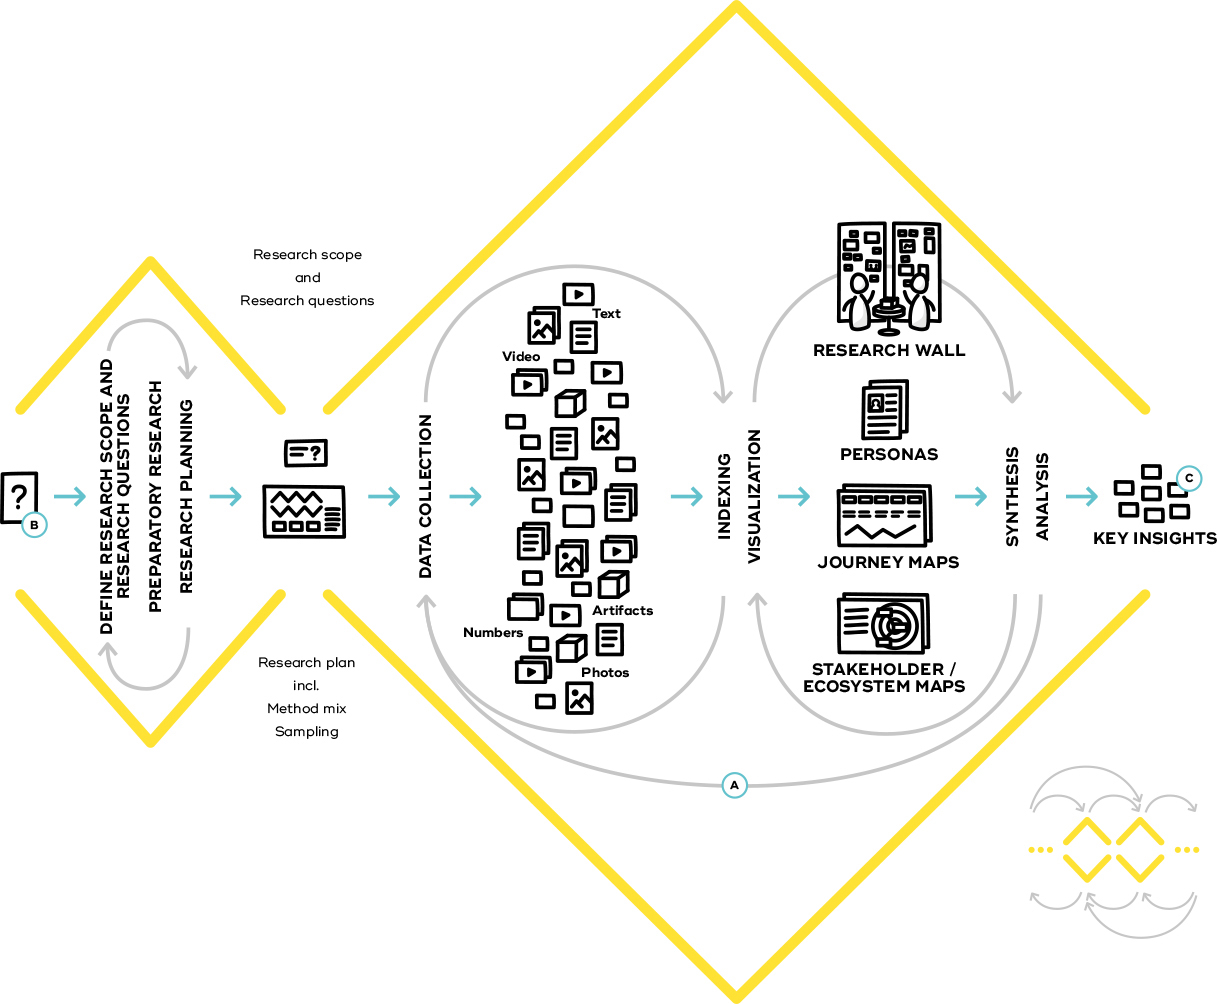
Figure 5-1. Research activities are embedded in an iterative sequence with other activities of ideation, prototyping, and implementation.
Iterations and research loops Design research is an iterative process – a sequence of research loops within and between activities.
Starting point Usually research starts with a brief from an internal or external client. Based on some preparatory research, you define research questions and start research planning.
Output There are various potential outputs of design research, from informal inspirations to formal research reports.
The Process of Service Design Research
Research can be used at different stages within a design process. Design research can be used to find opportunity fields by identifying customer problems and needs; to research experience gaps in existing services or products (whether physical or digital); 4 to get inspiration from other domains; or to test and collect feedback on ideas, concepts, and prototypes.
Service design research can benefit from a clearly articulated research design that considers some of the aspects and main criticisms of ethnography. 5 Even though not every research process needs extensive planning, this framework might help you to achieve richer results with fewer resources. It doesn’t need to be followed step by step, but should serve as a collection of useful rules of thumb that can be applied to your research. This section describes each step in detail.
Research scope and research question
To define the scope of your research, it might help to consider which of the following options is applicable for the project.
Exploratory research vs. confirmatory research
→ Exploratory research sets out to learn more about a specific subject without the prior formulation of explicit assumptions. The objective is often to find answers to “Why” questions without a sound assumption of what might be the cause. You can also do exploratory research to get inspired by solutions (or problems) from different industries, regions, cultures, target groups, and so on.
→ Confirmatory research is intended to validate specific assumptions you have generated before you start research. The objective is often to find out if an assumption or hypothesis is supported by research findings. For example, assumption-based journey maps you created during a workshop might now need to be challenged with solid data on customer experience.
Research into existing services and physical or digital products vs. new ideas/concepts
→ Research that focuses on existing physical/digital products or services is mostly done in the existing situational context through fieldwork using ethnographic approaches. Customers, employees, and other stakeholders are observed or interviewed when they interact with the service or physical/digital product in question, or with one another in reality.
→ Research which could lead to new ideas or concepts uses similar ethnographic methods, but as there are no existing physical/digital products or services to be researched, we often use prototypes or experiments to get results that are as close as possible to the results we would get from the future situational context of this idea or concept.
Start by formulating a research question to make sure that your team (and your potential client) has a common research aim. An initial research question might derive from a (client) brief, from customer complaints, from a workshop, or somewhere else. Often you need to do some preparatory research before or during defining your research scope and phrasing research questions. 6
A research question could have various aims: perhaps to understand customer needs (“Why do people use selfie sticks?”), to find gaps in an existing customer experience (“Where do customers have problems or leave when they are in our shop?”), to confirm steps of an assumption-based journey map (“Which steps are missing in our journey map when our customers go through our software onboarding? And which ones do they skip?”), or to understand the ecosystem of a physical/digital product or service (“Which players are directly and indirectly involved in our procurement process?”).
When developing your research question, always remember to think ahead and ask yourself what you will do with the answers. You know what the next activity of your project will be, so you can test a question by asking “How will the answer to this question help us generate a range of insights and ideas to create new (or more) value?”
Research questions are often rather broad and vague in the beginning, but then narrow down to one or more specific questions throughout the iterative process. It is like finding a path through a jungle: you don’t know the way when you set out. You have a vague aim and move in that direction. Then, if you stumble over a creek, it’s best to follow it as it might take you somewhere interesting much faster.
Be aware that research questions often need to be refined over time due to the iterative and explorative character of design research. In general, you should avoid questions that could be answered with a simple “yes” or “no” – otherwise your research might come to an end very fast, and you won’t learn much. Often research questions are open-ended, sometimes followed with a follow-up “Why” question to gain more detailed insights. It usually helps if you write down not only one question in the beginning, but 10 or 20 and then select one or more you like. 7 With a little practice, you will get better at developing questions. But you will always need to iterate and refine them.
Based on your progressive understanding of the subject matter, you’ll be able to gradually rephrase the question better, improve your process and methods of collecting data during your fieldwork, and also refine the focus of your documentation.
Research planning
When planning your research, you should think of research methods that are most likely to give you fruitful answers for your proposed research questions. On the other hand, your research must fit within certain business constraints, as you always have to consider how to best allocate time, money, and people within a project.
A good starting point is to take a look at what is already out there so you are “standing on the shoulders of giants.” Take a look at previous research and existing data on the subject matter. Ask the Market Research or Innovation department if they have any relevant data, get statistics that might be useful for your research, and get an overview of what has been done in this field by other departments in the organization. Besides existing research within the organization, also invest some time into classic desk research: use (academic) research platforms to look for scholarly papers published on that topic. In many cases, you might invest an hour or so to screen the research landscape until you have a good idea whether it is worth spending more time reading published research. If you find interesting research, it will save some time and budget by focusing your research on the really useful parts.
Each loop should include data collection with various methods as well as at least a simple form of data synthesis and analysis.
Besides conducting some preparatory research, your research planning will include decisions regarding research loops, sample selection, research context, sample size, and method selection. 8
Research loops
Always plan qualitative research as an iterative process with a sequence of research loops. Fruitful design research often starts with a broad focus and aims to narrow it as soon as possible. The first loops can be really short: something between one hour and one day.
Through iterative research loops, it is possible to be more confident that the research is effectively targeting the important questions.
Sample selection
Sampling is the definition of who you want to take part in your research. Who participates in your research and how you select them is a critical question for the reliability of any study. A skewed selection of research participants may distort your results – for example, when you ask only a specific age group, or only happy customers (the “sampling bias”). There are various strategies that aim either to get a representative dataset for large-scale quantitative research (probability sampling) or to get richer data from a specific group for in-depth qualitative research (non-probability sampling). Results based on quantitative probability samples can usually be generalized, but with data from qualitative non-probability samples that’s not the case. Mostly service design research uses qualitative research methods and selects participants with non-probability sampling techniques, like these:
Expert Tip
“Good practice is to regard the first one or two interviews as pilots to test out your script and materials. If all goes well you include the data in the research; if there are serious changes needed you may want to consider doing some extra pilot interviews.”
— Geke van Dijk
→ Convenience sampling: Find some people to participate in your research (the simplest, but also most biased sampling approach).
→ Self-selective sampling: Let participants decide to take part in your study without defining specific criteria or quotas – for example, through a link on a company website (also a very biased approach).
→ Snowball sampling: Find a few relevant people for your research purpose and ask them to recommend others (e.g., users of electric cars can get you in touch with other users from their network).
→ Quota sampling: Find out how a population is structured according to certain criteria, set a quota for how many participants you would like to have for each criterion (e.g., gender) and randomly select participants for each quota.
→ Extreme case sampling: Find very unusual participants to understand extreme positions (e.g., very early adopters of interesting technologies, or the opposite: people who are radically against or have never thought about using your service/product/technology).
→ Emergent sampling: Follow new leads during fieldwork as they unfold, to flexibly take advantage of new knowledge.
→ Maximum-variation sampling: Find participants with a wide range of variation on dimensions of interest with the aim to discover central themes or shared dimensions across a diverse sample (e.g., people who use a product in very different ways than it was intended).
→ Maximum-input sampling: Find participants with a comprehensive overview of an entire experience or system in order to get a maximum of input from the selected participants (e.g., people who have just followed a complete customer life cycle).
Probability sampling can also be useful for service design research, especially when you need larger sample sizes or even representative samples for large-scale quantitative research. Here are just a few examples for probability sampling techniques:
Comment
“When we were working with CarGlass in Belgium we discovered huge differences between the experience of changing a windshield during the day and at night. A well- designed process for the daytime was rather frightening for female customers during the night considering the dark and lonely location outside the city and the different emotional state the customers were in.”
— Jürgen Tanghe
→ Simple random sampling: Randomly pick participants from a sampling frame.
→ Systematic random sampling: Select a random number, such as 10, and pick every 10th person from a flow of people as your participants.
→ Stratified random sampling: Separate your sampling frame into groups based on specific criteria and use simple or random sampling to select participants within these groups.
→ Cluster sampling: Create a list of clusters based on specific criteria and randomly choose some of these clusters, then randomly choose participants within the selected clusters.
Comment
“Theoretical saturation is important, but difficult to predict in advance. Usually it is based on prior experiences and rules of thumb in proposals, while keeping flexibility to extend the fieldwork when data and results indicate that saturation has not yet been reached.”
— Geke van Dijk
Most projects use a combination of different sampling techniques, for example systematic random sampling in combination with snowball sampling. Often you need to set certain selection criteria as screening questions (e.g., “Do you drive an electric car?”). Emergent sampling is something we should always do anyway in design – if you find something interesting, don’t ignore it. The aim of a sound sampling strategy is to avoid a sampling error, like systematically excluding a certain group of people that should have been considered.
Research context
Besides the “who,” it is also crucial to define the context of your research: “when” and “where” to conduct the research. This might seem obvious – but think, for example, of the people you’d meet at a train station on weekdays in the morning (commuting to work/school?), weekdays around noon (lunch break?), weekdays in the afternoon (commuting from work/school?), or weekdays in the evening (leisure activities?). And compare this to the same times during the weekend. Also, seasons are important: consider how hard it would be to research customer experience at a ski resort during the summer season.
It often helps to engage participants in their natural surroundings or in a specific situational context of interest. Interviews are often done at people’s homes, because they are most at ease when at home. Observations or contextual interviews should be done at places where people often use the specific service or physical/digital product, as they can relate to their experience more easily in that environment and maybe even point out certain aspects of it that they like or dislike. Also consider the effect of external factors on the experience and behavior of people, such as weather, public holidays, major events, and so on.
Sample size
You might decide to fix the sample size (how many participants your research has) before data collection, or you might choose to stay flexible. This is mostly a question of the research objective and methods used, as well as the resources and time available.
Sample size in service design is determined using an ethnographic research approach based on the concept of theoretical saturation. In other words, you stop collecting data when new data does not bring additional insights to the research questions.
In quantitative statistics, your sample size depends on whether the data need be representative for a defined group of people (the population). In qualitative research – and particularly in ethnographically inspired design research – researchers in stead look for recurring patterns. You do enough research – such as interviews or observation – to let you identify patterns. When more research only confirms the patterns you have already identified, you have reached theoretical saturation. This means doing more research would only confirm what you already know and will not bring any new knowledge. Just like a usability test that is designed to find the biggest bugs in software, service design research is used to find the biggest bugs (or opportunities) in a physical or digital product, a service, or any (customer) experience. Unlike quantitative statistics, service design is not especially interested in accurate percentages of exactly how many people struggle with one issue, but rather needs a ranking or just a shortlist of bugs to fix, a list of inspirations as a basis for ideation, or a hit list of features customers would like to have.
Comment
“When we started with service design research in our company, not everyone on the team trusted the results from our in-home interviews and co-creative workshops with customers. However, a later quantitative survey proved exactly the same points. Team members now realize more and more the credibility of these methods.”
— Maik Medzich
When you set your sample size, it should be large enough to identify recurring patterns. In 1993, the usability researchers Nielson and Landauer published an article revealing that usability tests with only 5 users found 85% of all usability problems, while they needed at least 15 users to find all problems. Since service experiences are more complex, a good rule of thumb is to start with a small but culturally diverse set of participants. If you already see patterns emerging, use the next batch to confirm the patterns you spotted and see if you’ve already reached theoretical saturation for these patterns. 9
Data collection
There are a huge variety of research methods you can use to collect meaningful data in service design. We use quantitative methods like surveys (offline and online), any form of automated statistics (e.g., conversion rate analysis), and manually collected quantitative data (e.g., frequency of shop visitors through simple counting). However, we mostly use qualitative methods and particularly methods based on ethnography. Select and line up a sequence of research methods to collect and to visualize, synthesize, and analyze your research data. See this section and 5.1.4 for details.
Research methods
You should always consider a mix of methods as each research method has its own inherent potential bias. “Actions speak louder than words” is a common saying, and indeed you often observe that people behave differently than they say they would. This can have different causes, like the “interviewer effect,” when the style and personality of the interviewer affects interviewees; the “Hawthorne effect,” when people modify their behavior simply based on their awareness of being observed; or “confirmation bias,” when researchers tend to search for information that confirms their beliefs or assumptions and thereby ignore other data that contradicts their beliefs. However, a good mix of research methods levels out potential biases.
Expert Tip
“A mantra we use is to see the customer (observation), hear the customer (dialogue), and be the customer (selfethnography) - three complementary methods to understand customers or employees.”
— Simon Clatworthy
As a rule of thumb, for a good mix of research methods pick one method from each of the following categories: 11
→ Desk research, like preparatory research, secondary research
→ Self-ethnographic approaches, like autoethnography, online ethnography
→ Participant approaches, like participant observation, contextual interviews, in-depth interviews, focus groups
→ Non-participant approaches, like non-participant observation, mobile ethnography, cultural probes
→ Co-creative workshops, like co-creating personas, journey maps, and system maps
Method triangulation
When we are selecting the “right” research methods – ones that yield a lot of useful data – we always face the question of how many research methods we should use. Given a limited budget, researchers often need to decide whether they should put their budget into one method and do this rather well, or distribute their budget to use a variety of research methods. We always suggest the latter, based on the concept of method triangulation. 12 Triangulation is based on classic navigation and land surveying techniques. In simple terms, with triangulation you can estimate your own position by measuring the directions of at least two distinct landmarks. Based on basic principles of geometry, the more landmarks we measure, the more accurately the position can be calculated. Similarly, researchers can improve the accuracy and richness of their research by using different methods to collect data on the same phenomenon.
If different methods lead to the same outcome, you can be more confident about these findings. However, in design research, triangulation is not used as much to seek validation or verification of research results, but rather to ensure that insights are based on a rich and comprehensive dataset that is robust enough to provide a foundation for design decisions. In particular, when you do exploratory research to get inspiration for new ideas, richness of data and perspectives is key.
In a research context the fundamental idea of method triangulation is to cross-check findings with different methods.
Data triangulation
Different research methods generate different types of data as output, such as text (e.g., field notes or interview transcripts), photos, videos, artifacts (e.g., tickets or info flyers), as well as statistics. Some methods can generate different or even multiple types of data, and researchers should plan what kind of data they need. Again, following the principle of triangulation, you should strive to create different types of data in your research process.
Data triangulation enables researchers to support findings with different underpinnings and makes your dataset richer and more comprehensible. One advantage of using different types of data can be explained with a simple example. Imagine the situation of a contextual interview. If researchers only take field notes, they only write down what they regard as important. If they add photos of the situation, others can understand the situational context of the interview. If they do an audio recording of the interview and transcribe it afterwards, others have a chance to interpret the interview as well. If they take a video of the situation, others can also interpret body language and situational context. Different data types can help you to get a richer dataset and reduce the subjectivity of researchers.
Another differentiation is the distinction between primary and secondary data. Primary data is data collected by a researcher for a specific purpose. Secondary data is data that has been collected by someone else for other purposes, but is being used by a researcher for a new purpose. If your organization will be conducting several service design projects, it makes sense to integrate a data or knowledge management system. The outcomes from primary research in one project can serve as secondary data for another project and thereby save time and money. Researchers can build on the outcomes of prior research (i.e., secondary data) and so might be able to use a given research budget for more focused primary research, “standing on the shoulders of giants.” 13
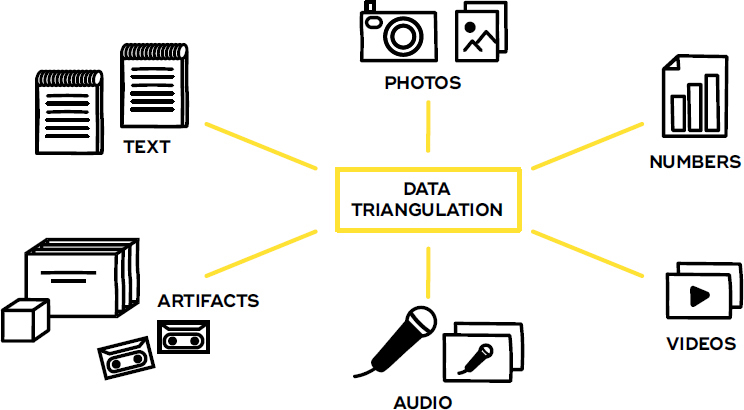
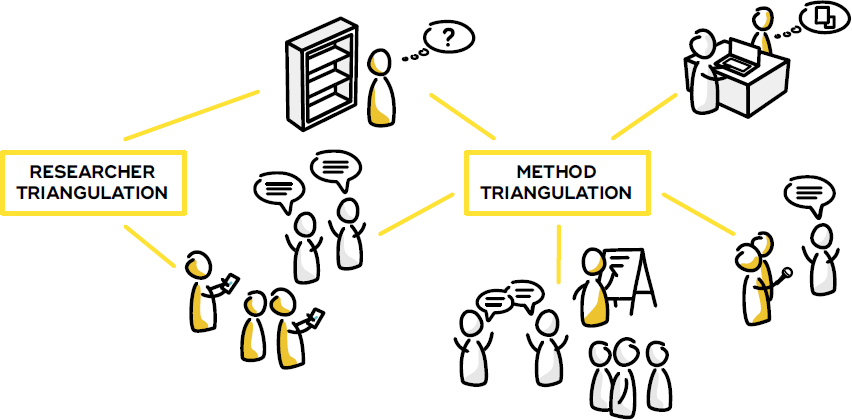
Figure 5-2. —Use different types of triangulation to offset different forms of research bias:
—Researcher triangulation to avoid prejudices and predispositions.
—Method triangulation to get different perspectives on the same subject matter.
—Data triangulation to get a richer and more comprehensive dataset.
Expert Tip
“Providing sufficient raw data speeds up the decision-making process and helps avoid endless discussions within your team and with superiors. Instead of [questions] like ‘Is this really like this?’ our team accept a fact when they see it with their own eyes – or even better, when they experience it themselves. They then move on and work on actionable solutions instead of pointless discussions.”
— Anke Helmbrecht
The differentiation between first- and second-order concepts (not the same as primary and secondary data) is an important factor which affects how other researchers can work with the data. Basically, first-order concepts are the “raw data” (e.g., the direct transcript of an interview), while second-order concepts include interpretations by researchers. In practice, first-order concepts might be any original evidence of research that researchers gain from observations or interviews – for example, interview transcripts, but also photos or videos. Second-order concepts might be summarized field notes or any other form of data filtered or biased by a researcher striving to identify patterns. 14 While both are useful, it is important to collect enough raw data (first-order concepts) that does not include interpretations by researchers, as only this raw data can be interpreted by other researchers at a later stage. Recorded data like photos or videos preserves to a large extent the raw content, which is often more convincing when presenting your results than any second-order concept. When you can do only field notes, distinguish between an accurate description of a situation studied and your personal interpretation, so that you can always go back and refine your interpretation.
Researcher triangulation
As a (design) researcher using ethnographic methods, it is important to step into someone else’s shoes. However, to be able to walk in the customer’s shoes, you first need to take off your own. All researchers have their individual background, knowledge, and prejudices. It’s almost impossible to get rid of this “researcher bias,” but it helps if you become aware of your own tendencies regarding your interpretations and conclusions (e.g., through peer reflection by other researchers regarding potential biases and predispositions).
Comment
“Jürgen Habermas described a […] way to apprehend reality in a way that may reduce research bias […]:
Use research tools to produce/collect numbers (dry quantitative data) about the intended context of research;
Cast the most accepted or the researchers’ preferred interpretation (what these numbers ‘obviously’ say);
Based on the same numbers, develop contrasting/alternative interpretations (what these numbers could also say);
Reflect upon the different interpretations in order to fine-tune the researcher’s perception.”
— Mauricio Manhães
Researchers should also be aware of their “researcher status” – the social position a researcher holds among the studied group. Depending on your status, participants will react differently to your questions. This is something to consider in your research planning. How do you communicate the research to participants? Which research aim do you communicate? What expectations do your participants get through this and which hidden intentions might arise as a consequence?
One way to tackle researcher bias is by including various researchers, both during the collection of data and during synthesis and analysis. This researcher triangulation can help to reduce the level of subjectivity in ethnographic research and keep the team on a consistent knowledge level throughout the project. One way to increase the number of researchers involved is to use methods of data collection that actively integrate participants as researchers (e.g., diary studies or mobile ethnography) or methods that put researchers in the roles of participants (e.g., service safari or autoethno graphy).
In general, you’ll have more informed conversations and increase buy-in from clients or management if your design process includes people from the client organization or management as well as other stakeholders. Invite them to participate in your fieldwork – even if they only have limited time. In most cases, contact with customers and other research participants will increase appreciation for research, and attention to customer needs.
Sometimes the downside can be that invited clients or management use such opportunities to explain or even promote their offerings to interviewees, or to prioritize single users or responses. One way of supporting less-knowledgeable clients could be by assigning them a clear role, such as a supporting interviewer or observer, while the members of the key project team lead the fieldwork.
Indexing
During your research, it is important to index your data so that you can trace insights back to the data sources they are based on. A simple way of indexing could be to label data with a short index, such as “i6.17” for interview 6, line 17, or “v12.3:22” for video 12, at minute 3:22. This allows you to later base your design decisions not only on insights you have generated, but on raw data. You might even be able to include the participants who reported a specific phenomenon in your prototyping of solutions to improve the original situation. 15
Data visualization, synthesis, and analysis
There are many ways to synthesize and analyze data (also known as sensemaking) in design research. In general, we can see two major ways to do this: the academic way and the practitioner’s way. Although we’ll focus mostly on the practitioner’s approach, we can learn a lot from academic approaches.
Expert Tip
“It is often worth iterating within stages, as well as between techniques: coding data then sifting and filtering and then analyzing to draw out insights. For example, in diary studies we write up all comments in a spreadsheet, look for common patterns and highlight/color code, then dig deeper again on specific issues and reanalyze comments. The issues identified are then explored further in exit interviews.”
— Phillippa Rose
The academic way to work with qualitative data mostly includes codifying data and then searching for patterns within this codified data. This process is often referred to as content analysis – there are various methods and even software 16 to support researchers in doing this, but of course pen and paper will often also do the job. For example, a researcher could codify the data by going through transcribed interviews and tagging sentences with specific labels. In a second step, the researcher then counts how often specific labels occur – or rather a software tool does this automatically. 17 This process takes some time, but is particularly useful when you have to cope with a huge amount of data because it lets you split up a set of data and work your way through it step by step. This happens often when you plan research design with a classic project management approach: one period of data collection followed by one period of data analysis.
However, if you follow an iterative research design with a rather visual synthesis and analysis process, you won’t be drowning in data as you will have multiple iterations of data collection, synthesis, and analysis.
Visualizing data
Visualizing data helps teams get an overview of the amount of information, brings structure into complex data, identifies patterns, and uncovers existing gaps in the data. It also deepens their understanding of a topic and develops empathy with the people who were the subject of the research. There are many ways to visually work with and present research, and what makes sense depends on your aim. The following list summarizes some common ways to visualize research data in service design, with a brief description of why each might be useful: 18
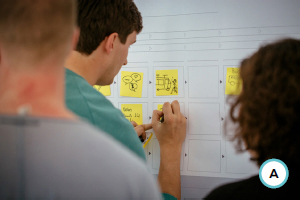
→ A research wall 19 to give you an easy overview of your data and your mix of research methods and data types; the wall may contain any of the other assets listed here.
→ Personas to exemplify different groups of people, such as customers or employees, and their individual characteristics, goals, and/or tasks.
→ (Customer) journey maps to visualize customer experiences happening over time.
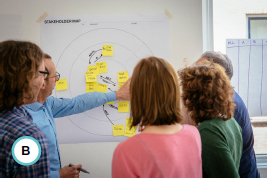
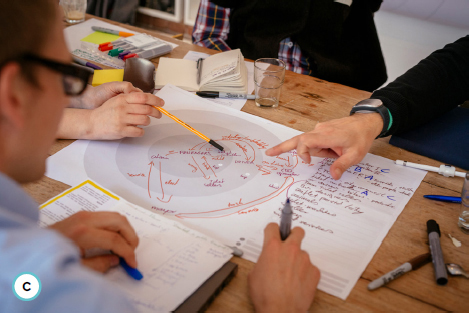
→ System maps to show relationships between stakeholders and product-service ecosystems.
→ Key insights to highlight the biggest customer problems or potentials customers have regarding a certain physical/digital product or service.
→ Jobs to be done to emphasize the big picture of what customers strive to achieve.
→ User stories to ensure a common language with software developers.
→ Research reports to ensure a comprehensive research overview, often including many of the tools above.
It is important to consider the target audience for your visualization and ask yourself what exactly you want to share. Different audiences will have different needs – do they need pithy research insights or lots of raw data? Do you need something rather formal and self-explanatory so your outcomes can be used in different departments or organizations? Or are your outcomes only needed for your internal team? Any research outcome that you need to communicate beyond your own team needs more polish.
Peer review and co-creation
One simple way to increase the quality of your research is through peer review. Include other researchers, customers, employees, and stakeholders to benefit from multiple perspectives and reduce the risk of confirmation bias. If you want to include others at this stage, they must be able to understand your data and draw their own conclusions. So, aim to collect as much raw data (i.e., first-order concepts) as possible and compare your own interpretations with those of your peers. Make sure that insights are always trackable to your raw data (use indexing), so that reviewers can understand the translation from data to insight and second it.
As a rule of thumb, it is easier to include other people early on during the synthesis and analysis stage, so that you can cluster your data and generate categories using a co-creative approach instead of only inviting others to review your work. However, sometimes co-creative workshops are not possible; then, peer-review is a way to limit subjectivity and research bias.
Codifying data
One major question when you’re codifying data 20 is this: where do the categories for these codes come from? Mostly, qualitative research is understood to follow an inductive approach in which researchers “immerse” themselves in the data and generate categories and insights from the data itself. On the other hand, sometimes researchers follow a deductive approach and start with a defined set of categories derived from literature or other research, but then eliminate or add categories through their data synthesis. Deductive qualitative analysis strives to test specific assumptions or concepts and therefore often categorizes data in previously defined categories. While design research to identify customer experience gaps or people’s needs is mostly inductive, research to test prototypes is often rather deductive.
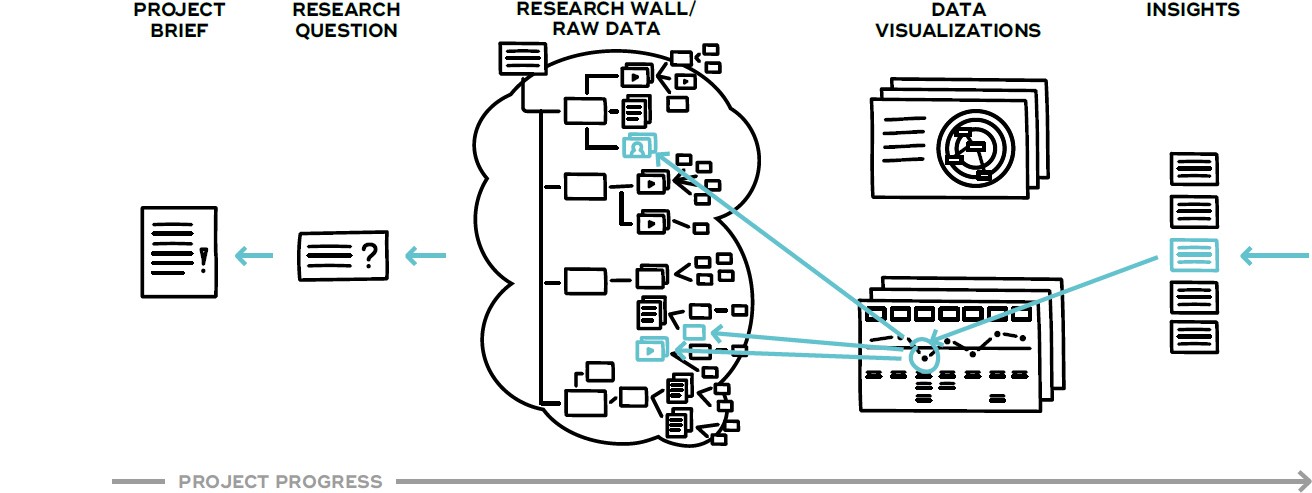
Figure 5-3. Indexing your dataset allows you to trace back insights (and later even ideas and prototypes) to their underlying data.
Using research outcomes
The outcome of service design research usually serves as input for other service design activities, such as ideation or prototyping. In some cases, research output can even be used directly in implementation activities. For example, research can sometimes reveal simple usability improvements for a piece of software that can be described as user stories and directly implemented during software development. 21 The usual case, however, is that topics identified during the research process are visualized with personas, journey maps, system maps, key insights, jobs to be done, user stories, or research reports. These can be used to identify problems or opportunities in subsequent ideation activities. 22 If you already have some immediate ideas of how to solve discovered issues, you might also directly try to prototype these in prototyping activities. 23
Typically, during research activities, you explore in detail the existing problems of an experience, a process, or a system. You try to question what you see and challenge your assumptions. At least, this is what you should do. Unfortunately, one problem is that we as humans are trained to solve problems. When we see a problem, we immediately start thinking about potential solutions.
This is unfortunate, as these are probably not solutions for the root cause. To be able to work on that, you need to invest more effort into understanding the problem. You need to remain longer in the problem space, without jumping into the solution space too soon.
Sometimes it helps a design team if they clearly understand where they are. Are you in the problem space trying to understand someone’s problem in more detail and depth, exploring this from various perspectives and trying to dig deeper and discover the root cause of it? Or are you in the solution space striving to find ideas on how to solve a well-defined problem? You can make this clear using visual clues such as a poster on the wall wherever your design team works, by clearly articulating where you are in your meetings and workshops.
Of course, a design team will have many ideas during research activities and it would be a shame to lose them. If ideas come up during research, capture them on an idea wall 24 and then let go.
Or, you might want to see the idea as a hypothesis and rephrase it into its underlying assumptions – this feeds into your next research iteration as a new research question. Also, you might want to brief your team before the next steps of the design process, such as ideation activities that might follow your research.
Methods
Read more on methods and tools in our free online resources at:
![]() www.tisdd.com
www.tisdd.com
Methods of Data Collection
This section provides a wide selection of potential research methods to collect data in service design research. Many more methods exist, and often the same method has several inconsistent names. We can only give a very brief introduction for each method, but if you want to dig deeper, there is plenty of literature – and for some methods, even whole books – with detailed descriptions and examples. 25 The research methods are structured in five categories:
→ Desk research: Preparatory research, secondary research
→ Self-ethnographic approaches: Autoethnography, online ethnography
→ Participant approaches: Participant observation, contextual interviews, in-depth interviews, focus groups
→ Non-participant approaches: Non-participant observation, mobile ethnography, cultural probes
→ Co-creative workshops: Creating personas, journey mapping, system mapping
These categories are not an academic standard, and as there are many variations and names for each research method, the boundaries between the categories might be rather fluid. However, as a rule of thumb, we suggest you use at least one method from each category in your research to give better method triangulation.
“Prep” research often includes an online search for certain keywords, companies, and competitors as well as searching for scholarly research on specific topics.

When doing secondary research, keep notes and explore potentially interesting topics iteratively.

A smartphone and/or a simple notepad is often the best tool to document autoethnographic research.

Desk Research Preparatory Research 
Your own preparation before you start your actual research or fieldwork. 26
Preparatory (or simply “prep”) research often includes digging deeper into an industry, an organization, competitors, or similar products, and also the client’s perspective of what the research problem is, their context, perceptions, internal conflicts or interplays, and so on. Prep research is less about finding answers, and more about finding the right questions to ask in your research. Prep research can result in a summary of text snippets and/or a collection of photos, screenshots, or videos, perhaps visualized as a mood board.
Preparation: Often prep research starts with very wide research questions or topics, from soft topics such as “How does home feel?” to rather specific topics such as “Where else is this technology used?”
Use: Prep research can include conducting internal interviews; screening social media; listening to podcasts, online videos, or conference talks; and reading industry-specific scientific or special-interest publications along with newspapers or general-interest magazines.
Expected output: Text, statistics, photos, and videos, as well as mind maps, mood boards, and the like
Desk Research Secondary Research
The collection, synthesis, and summary of existing research. 27
In contrast to primary research, secondary research (often also simply called “desk research”) uses only existing secondary data – information collected for other projects or purposes. The main idea is to check whether research regarding a topic already exists. This helps us to formulate a research question more precisely and identify promising methods of data collection, visualization, and synthesis. Desk research should always be the starting point of a research process, simply to avoid reinventing the wheel and to stand on the shoulders of giants when you start your primary research.
Preparation: Collect a list of potentially promising internal and/or external sources such as academic papers, white papers, and reports, as well as experts on your research topic.
Use: Search for qualitative and quantitative secondary data regarding your research topic using online search engines, scientific databases and journals, libraries, conferences, and expert talks and interviews.
Expected output: Text, statistics, mind maps and the like
Self-Ethnographic Approach Autoethnography
Researchers explore a particular experience themselves and self-document this using field notes, audio recordings, videos, and photographs; 28 also called self-ethnography/documentation.
Besides “real” (i.e., rather academic) autoethnographic research where researchers immerse themselves for months within an organization, service design often applies shorter versions of this: team members explore a particular experience themselves in the real situational context, mostly as customers or as employees. Variants of this include mystery shopping, mystery working, service safaris, explorative service safaris, or diary studies.
Preparation: Autoethnography is often one of the first research methods undertaken as it helps researchers to interpret behaviors when they conduct interviews or observations. Decide when and where you will conduct your research.
Use: Autoethnography can address one or more channels as well as actions with or without other people and/or machines. If you take field notes, write up first-level (“raw data”) and second-level concepts (“interpretations”) separately: for example, what you see and hear on the left page and what you interpret from this or how it feels on the right.
Expected output: Text (transcripts, field notes), audio recordings, photos, videos, artifacts
Self-Ethnographic Approach Online ethnography
An approach to investigate how people interact with one another in online communities, 29 also known as virtual or cyber ethnography.
Online ethnography can be done as self-ethnographic research, non-participant ethnography, or participant ethnography – however, it always focuses on online experiences. It can look at many different aspects, such as social interactions within an online community or the differences between the self-perception of people when they are online and in real life.
Preparation: Based on your research question, define which online communities might be suitable for your research question. Decide how you will document your experiences; e.g., through screenshots or screencasts, system or journey maps, or simply field notes.
Use: Often online ethnographies include a mix of methods, such as observations, contextual interviews conducted online with screen sharing, or in-depth retrospective interviews with other community members.
Expected output: Text (quotes, transcripts, field notes), screenshots, recordings (screencasts or audio recordings)
Participant Approach Participant observation
Researchers immerse themselves in the lives of research participants.
Participant observation is an umbrella term for a variety of methods, such as shadowing, a day in the life, or work-along. 30
Preparation: Based on your research question, select suitable interviewees and plan when and where you will conduct your research and how you will document it. How will you approach your participants? How will you start and end? How will you manage the “observer effect”? How much time will you plan for it?
Use: Observations might be at the participant’s workplace, in their home, or even following them throughout a process like a holiday trip. Use the situational context and ask participants to explain specific activities, artifacts, behavior, motivations, needs, pains, or gains. Sometimes contradictions between what people say and what people do can be very revealing if you mirror behavior back to participants. During participant observations it is important to observe not only what people are doing (by interpreting their body language and gestures) but also what they are not doing.
Expected output: Text (transcripts, field notes), audio recordings, photos, videos, artifacts
When researchers conduct participant observations, they often switch between more passively observing situations and actively asking questions to get a deeper understanding of user needs.

Contextual interviews help interviewees to articulate problems and needs as they are in the situational context, and they can simply show things right where they are.

During contextual interviews or observations, take audio or video recordings to enable data triangulation, if possible.

Participant Approach Contextual interview
Interviews conducted with customers, employees, or any other relevant stakeholders in a situational context relevant to the research question, 31 also known as contextual inquiry.
Contextual interviews are used to understand a certain group of people better (their needs, emotions, expectations, and environment – useful for personas), to reveal formal and informal networks and hidden agendas of specific actors (useful for system maps), or to understand particular experiences (useful for journey maps). Contextual interviews can be done, for example, with employees at their workplace or with customers during a specific moment of the customer experience.
Preparation: In contrast to studio interviews, contextual ones are conducted “in situational context,” so that researchers can observe the surroundings and interviewees can point to elements in the environment. Based on your research question, define who, when, and where you will interview and how you will document the situational context – including the interviewee’s mood, gestures, and body language.
Use: Try to ask your interviewees to demonstrate details of the concrete experience of interest. It is often easier for people to articulate their motivations and experience when they can refer to concrete examples.
Expected output: Text (transcripts, field notes), audio recordings, photos, videos, artifacts
Pay attention to your interviewees’ body language and gestures and write down interesting observations. This often leads to further questions.

Try to differentiate between concrete observations and your own interpretations (first-level/second-level concepts).

Participant Approach In-depth interview
A qualitative research technique of conducting intensive individual interviews.
In-depth interviews are often conducted with relevant stakeholders or external experts to understand different perspectives on a specific subject. These interviews can help researchers learn more about particular expectations, experiences, products, services, goods, operations, processes, and concerns, and also about a person’s attitude, problems, needs, ideas, or environment.
Preparation: In-depth interviews are mostly done in a semistructured way to collect useful data. For example, interview guidelines can be based on an empathy map. 32 In-depth interviews are mostly done face to face, allowing researchers to observe body language and create a more intimate atmosphere. They can also be conducted online or by telephone.
Use: These interviews can be supported by co-creating boundary objects, such as scribbles or mind maps, or using personas, journey maps, system maps, or other useful templates. They can also include tasks like card sorting to understand user needs or storytelling supported by tangible touchpoint cards to visualize experiences.
Expected output: Text (transcripts, field notes), audio recordings, photos, videos, artifacts
Participant Approach Focus groups
A classic qualitative interview research method in which a researcher invites a group of people and asks them questions on specific products, services, goods, concepts, problems, prototypes, advertisements, etc.
With a focus group, researchers strive to understand the perceptions, opinions, ideas, or attitudes toward a given topic. Although focus groups are often used in business, they have only limited applicability in service design. They typically lack the situational context and usually do not co-create boundary objects, such as personas or journey/system maps. This often leads to limited informative value as results depend solely on the moderated discussion and are biased by issues like observer effect, group think, social desirability bias, etc. 33
Preparation: Focus groups are mostly carried out in a rather informal setting, like a meeting room or a special room where researchers observe the situation through a one-way mirror.
Use: Researchers often ask only an initial question and then observe the group discussion and dynamics. Sometimes a researcher acts as a moderator guiding the group through a set of questions.
Expected output: Text (transcripts, notes), audio recordings, photos, videos
Non-Participant Approach Non-participant observation
Researchers collect data by observing behavior without actively interacting with the participants.
In non-participant observation, researchers do not interact with research participants; they behave like a “fly on the wall.” Research subjects are often customers, employees, or other stakeholders, observed in situations that are relevant to the research question. Often, non-participant observation is used to level out researcher biases in other methods and to reveal differences between what people say and what they actually do.
Preparation: Plan who will do the research, when, where, and with whom. Sometimes when researchers do covert non-participant observation they pretend to be customers or passers-by, or even use one-way mirrors, minimizing the risk of the “observer effect.” 34
Use: During non-participant observations, it is important to observe not only what people are doing (for example by interpreting their body language and gestures), but also what people are not doing (perhaps ignoring instructions or refraining from asking for help or assistance).
Expected output: Text (field notes), photos, videos, audio recordings, sketches, artifacts, statistics (e.g., counting customers per hour)
Non-Participant Approach Mobile ethnography
Aggregated multiple self-ethnographies, taking place in a guided research setting where data is collected with mobile devices such as smartphones. 35
A mobile ethnography research project can include anywhere from a handful to thousands of participants. Usually users, customers, or employees are included as participants, self-documenting their own experiences on their own smartphones with text, photos, videos, or quantitative evaluations, as well as date, time, and location. Researchers can review, synthesize, analyze, and export the collected data in real time.
Preparation: Plan to offer incentives for your participants (recruiting is often the hardest part!). In your invitation, provide clear and short instructions on how to join the project and how to document. Define questions for your participant profile so that you can cluster participants into groups matching your personas.
Use: Mobile ethnography works well for longer research over one or a few days. Once you have started your data collection, you can start to synthesize and analyze.
Expected output: Text, photos, videos, audio recordings, date and time information, geolocation data, statistics of participant profiles
Non-Participant Approach Cultural probes
Selected research participants collect packages of information based on specific tasks given by researchers. 36
In cultural probes, research participants are asked to self-document certain experiences with field notes and photos, and/or to collect relevant artifacts. Cultural probes are often also done virtually using online diary platforms or mobile ethnography apps.
Preparation: Prepare and send a package to participants, which might include a set of instructions, a notebook, and a single-use camera. You might want to prepare a simple script for participants to follow, or instruct them to take photos of how they use specific products in various contexts.
Use: The aim of cultural probes is to gain unbiased data that has been collected by participants themselves in context, without having a researcher present. They help researchers to understand and overcome cultural boundaries and bring diverse perspectives into a design process. Cultural probes are often a mix of various approaches and may be combined with in-depth interviews to review the collected data retrospectively. They can include diaries kept over a day, a week, or even several years.
Expected output: Text (self-documented notes, diaries), photos, videos, audio recordings, artifacts
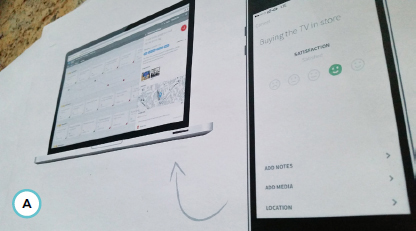
Participants use a mobile ethnography app on their smartphones to report on and evaluate their experiences step by step. Researchers see the data in real time and can start analyzing it immediately. 37
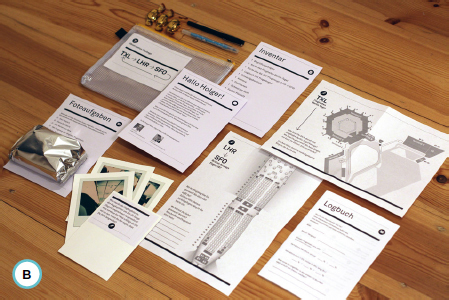
The content of a cultural probe (the observation package) to research flight travel experiences. 38
Even though age and gender is always an easy start for a persona, demographics might be quite misleading. Instead, think of factors that differentiate the groups you would like to represent with your personas.
Co-Creative Workshop Co-creating personas
Using the know-how of a group of invited participants to create a set of personas.
The quality of results of a co-creative persona workshop depends on the research data you bring to the workshop and on how much participants know about the group of people you want to exemplify with personas – for example, a workshop with frontline employees is often quite useful to create personas of customers. For less biased results, avoid inviting only people with abstract knowledge of the subject matter. The results might look convincing, but often they are very biased.
Preparation: Invite and incentivize your workshop participants and describe the aim of the workshop. Select participants with in-depth knowledge of the stakeholder group you are creating the persona for. Write a facilitation agenda to create a safe space during the workshop. 39
Use: These workshops often follow a structure similar to this: welcome and split into smaller groups, create initial personas, present and cluster, discuss and merge, visualize and validate, iterate.
Expected output: Drafts of personas (physical or digital), workshop photos, quotes of participants (audio or text), videos of workshop progress
Co-Creative Workshop Co-creating journey maps
Using the know-how of a group of invited participants to create one or more journey maps or service blueprints.
Invite participants who have solid knowledge about the experience you are mapping. If you want to create a journey map about customer experiences, this might be customers (yes, real ones!) and/or frontline employees. The outcomes of co-creative workshops are often assumption-based. The results might look convincing, but often they are biased. These outcomes should be understood as tools in development, as a common starting point to design the research process, or to evaluate and enhance collected data.
Preparation: Think about inviting workshop participants with either a shared perspective (such as customers of a particular target group) or from differing perspectives (such as customers of various target groups or customers and employees). Clearly communicate the scope of the journey map, such as a high-level journey map vs. a more detailed map of one specific situation within a high-level journey map.
Use: Define your main actor and journey scope, welcome and split into smaller groups, identify stages and steps, iterate and refine, add perspectives such as the emotional journey (optional), discuss and merge, iterate.
Expected output: Drafts of journey maps (physical or digital), workshop photos, quotes of participants (audio or text), videos of workshop progress
Co-Creative Workshop Co-creating system maps
Using the know-how of a group of invited participants to create system maps. 40
For each system map, define a specific perspective and invite participants with a sound knowledge of this. With your decision on who to invite and who to leave out, you also decide which perspectives might be interesting enough to include. Constantly challenge your assumptions with solid research. Over time, assumption-based maps should develop into research-based ones.
Preparation: In addition to the know-how of the workshop participants, a second important factor is the qualitative research you do beforehand and bring to the workshop, for example through a research wall.
Use: Setting a clear scope and situational context helps workshop participants to get on the same page. Often these workshops follow a structure like this: welcome and split into smaller groups, create initial stakeholder maps (1. list stakeholders, 2. prioritize stakeholders, 3. visualize stakeholders on map, 4. illustrate relationships between stakeholders), present and compare, discuss and merge, iterate and validate, test different scenarios within the ecosystem (optional).
Expected output: Drafts of system maps (physical or digital), workshop photos, quotes of participants (audio or text), videos of workshop progress
Methods of Data Visualization, Synthesis, and Analysis
This section introduces methods used in service design to visualize, synthesize, and analyze data collected as described in the previous section – sometimes this process is also called “sensemaking.” This is just a brief overview; there are many more approaches to visualize data, and plenty of appropriate ways to communicate the data and insights. Also, often the same method is known by several (perhaps inconsistently used) names. If you want to dig deeper, there is plenty of literature, and for some methods even whole books with detailed descriptions and examples.
Visualizations, such as a journey map, help participants to understand the context of each step and enable them to navigate quicker.
Paper templates often help participants to get started and to take a task seriously. The more familiar they become with a tool, the less important templates are for them.
Value network maps quickly can become quite messy. Try to give a map a specific focus to keep an overview.
This section presents eight methods of data visualization and analysis:
→ Building a research wall
→ Mapping journeys
→ Mapping systems
→ Developing key insights
→ Generating jobs-to-be-done insights
→ Writing user stories
→ Compiling research reports
Building a research wall
Synthesizing and analyzing research data through a visual arrangement of research data on a wall. 41
You can imagine a research wall as a more complex version of how detectives structure their crime scene data in many thrillers (think of any CSI episode). You’ll find many types of data on these walls (quotes, photos, screenshots of websites or videos, statistics, artifacts, etc.). This enables you to identify patterns within your data, while also providing a place to share your research with others as it develops.
Expert Tip
“To take personas further, use a persona’s goals, issues, and unmet user needs to (1) stimulate scenarios and ideation sessions on iterations of an existing service or develop a new service, or (2) to guide recruitment in ethnographic studies, as a starting point to create journey maps or build service blueprints from.”
— Phillippa Rose
Preparation: Prepare a wall space or large cardboard sheets to hang up your research data. Also, think about who should join you to create a research wall.
Use: Hang the material on the wall and start synthesizing data by clustering it according to specific topics, like certain customer segments, common problems, steps along the journey map, etc. Name these clusters and look for connections between clusters as well as connections between single materials (be aware of a potential confirmation bias). The various patterns you identify can then be further explored with tools like personas, journey maps, system maps, key insights, and so on – all of which also become part of the research wall.
Comment
“We started to document all our core customer experiences with current-state journey maps based on quantitative and predominantly qualitative research. Now that we know where we are, we can make educated decisions on what exactly needs improvement and why.”
— Anke Helmbrecht
Expected output: A visual arrangement of research data
Creating personas
Creating a rich description of a specific fictional person as an archetype exemplifying a group of people, such as a group of customers, users, or employees. 42
Personas focus on particular types of customer motivations and behaviors, and help to achieve empathy with a group of people to create solutions that address real problems. You can create them for existing market segments or to challenge an existing segmentation.
Preparation: Persona templates or empathy maps are sometimes helpful when creating personas. You often mix different approaches – for example, starting with assumption-based personas developed during a co-creative workshop with frontline staff, then enriching and backing these with research.
Use: Create approximately three to seven core personas representing your main market segments. Following the principle of “design for the average – test with extremes,” create many more “edge-of-the-curve” personas to test ideas and prototypes with people from more extreme ends of your user spectrum.
Expected output: Personas
Using foam boards as research walls helps a research team to keep research data (such as quotes, photos, screenshots, artifacts, etc.) with them when they have to move between rooms.

Structure your research wall by clustering and adding headings to the different sections.

Starting personas with demographics, like age, gender, nationality, job, and so on, carries the risk of stereotyping. Instead, try to build your personas from your research, perhaps starting with behavioral patterns you find within your data.

Mapping journeys
Visualizing specific experiences of a main actor, often exemplified by a persona, over time.
Journey maps can visualize 43 existing experiences (current-state journey maps) or planned experiences (future-state journey maps). The basic structure of a journey map consists of steps and stages defining the scale of the visualized experience, from a high-level journey map that shows an end-to-end experience to a detailed journey map showing only a few minutes.
Preparation: Even though assumption-based journey maps are relatively easy and fast to do, they can be very misleading. If you start with assumption-based journey maps, constantly challenge your assumptions. Over time, assumption-based journey maps should develop into research-based ones with a solid foundation on research data (beware of confirmation bias). 44
Use: Often a process to create a journey map looks like this: prepare and print out data, choose a main actor (persona), define scale and scope, create steps, iterate and refine, add lanes.
Expected output: Journey maps
A journey map visualizing two different scales of daily and weekly user activities. The map includes a sketched storyboard, an emotional journey, and user needs. 45

Journey mapping software helps you to quickly create professional journey maps with dispersed teams. 46
System maps are often hard to understand for people outside of your core team. Reduce them to the most important facts when you use them for communication.
Using templates or a specific structure helps to develop key insights, but constantly ask yourself if every aspect of your insight is specific and clear enough and if it is backed by sufficient research data.
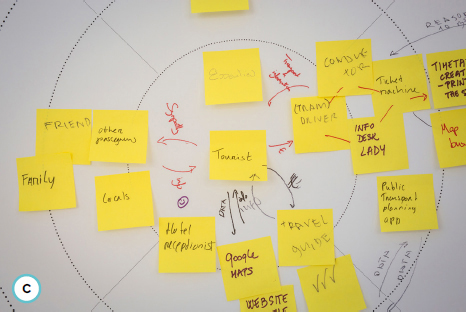
Mapping systems
Visualizing the ecosystem around services and physical or digital products.
“System maps” is an umbrella term for different visualizations, such as stakeholder maps, value network maps, or ecosystem maps. All of these can be created from various perspectives. A system looks different from a customer’s perspective compared with a business internal perspective. System maps have obvious relationships to other tools in service design, such as personas and journey maps. 47
Preparation: As system maps can become very messy, it is important to define a clear focus for a map. Don’t try to visualize every stakeholder you can think of on the same stakeholder map; it’s more useful to make various maps for different purposes. System maps are an excellent tool to synthesize research data, so it is useful to prepare research data beforehand. Remember that research is iterative, and it makes sense to use these maps to find gaps in your research, which you can investigate in later research iterations.
Use: Often, creating system maps looks like this: prepare and print out data, collect stakeholders, prioritize stakeholders, visualize stakeholders on map, illustrate relationships between stakeholders (optional), find gaps and iterate.
Expected output: System maps
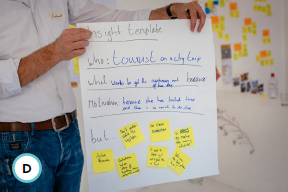
Developing key insights
Summarizing main findings in a concise and actionable format for communication within and across project teams. 48
Key insights are built on research and supported by raw data. They often include a situational context, and an intended outcome, as well as a restriction, obstacle, or friction. First insights are often generated based on patterns you find while you are collecting data, building your research wall, or codifying your data. If you don’t have enough data to critically reflect on an assumption, collect more data. Design research is iterative!
Preparation: There are many ways (and templates) to formulate insights, such as: … [actor] wants to … [action] because … [motivation], but … [tension]. It helps to write down initial ideas for insights at any stage of the research process and then critically reflect on them using your research data.
Use: Often, key insights are developed from initial assumptions, hypotheses, and intermediate insights (try to avoid confirmation bias). The process often goes like this: prepare and print out data; write initial insights; cluster, merge, and prioritize; link key insights to data; find gaps and iterate. Key insights should be carefully phrased, as they will serve as points of reference for the further design process.
Expected output: Several key insights
Generating jobs-to-be-done insights
Summarizing the bigger picture of what customers want to achieve when they use certain services or physical/digital products.
Jobs to be done (JTBD) is a specific way to formulate insights based on a framework by Clayton Christensen. 49 JTBD describes what a product helps the customer to achieve. It can be formulated for an entire physical/digital product or service (the main aim behind a journey map). Alternatively, formulate it for certain steps within a journey map by asking yourself what a customer or user wants to get done and adding your discoveries as an additional lane on a journey map. JTBD can help a team to break away from a current solution and discover new solutions based on what customers really want to achieve.
Preparation: Often, JTBD are developed based on this structure: When … [situation], I want to … [motivation or forces], so I can … [expected outcome]. To phrase JTBD, prepare and print out research data, personas, and journey maps.
Use: JTBD insights can be created iteratively together with data collection and can follow a process like this: write down initial JTBD insights; cluster, merge, and prioritize; link JTBD insights to data; find gaps and iterate.
Expected output: Jobs-to-be-done insights
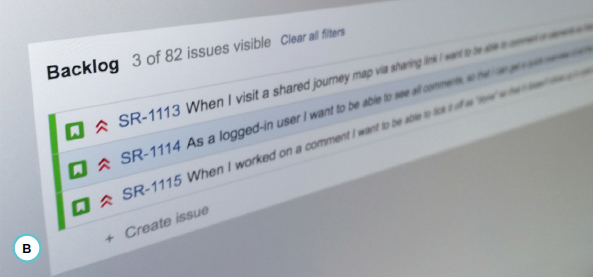
Writing user stories
Summarizing what customers or users want to be able to do; used to bridge design research with defining requirements for software development. 50
User stories are used in software development to define requirements from a user perspective, instead of more product-based requirement documents. User stories are often formulated like this: As a … [type of user/persona/role], I want … [action], so that … [outcome]. In service design, they are used to connect design research with actionable input for IT development to turn insights and/or ideas into productive software. User stories can also be used beyond software development to define the requirements of any physical/digital product or service.
Preparation: Just as journey maps have different zoom levels, software requirements also have different scales. While user stories typically describe detailed requirements, a set of user stories can be combined into an “epic,” a longer, less detailed description of the big picture of what software can do. It’s important to define this scale level beforehand.
Use: User stories should be formulated without IT-specific language, using simple, concise words, so that everyone can understand them. Writing user stories often follows a process like this: write initial user stories, cluster user stories into epics, link user stories to data, find gaps and iterate.
Expected output: User stories
Compiling research reports
Aggregate research process, methods, research data, data visualizations, and insights. Reports are often a required deliverable.
Research reports can have many forms, from written reports to more visual collections of photos and videos. Depending on the project a research report can serve various purposes, such as providing actionable guidelines to improve a physical/digital product or service, a “shock report” to get internal buy-in for a service design project, proof of work that justifies the budget spent on research, a compendium of research data that can be reused in other projects, and more.
Preparation: Have your research process and your research data, as well as different visualizations (personas, journey maps, system maps) and insights (key insights, JTBD, user stories), at hand. Think who you could invite to peer-review your report.
Use: Write a first draft of your research report. Ask yourself: who was involved, which methods and tools did you use, and how many iterations did you do? Add a summary of your key findings and key visualizations, add raw data as evidence, and use indices to show that there’s much more data these are based on. Then invite other researchers or participants of the research to peer-review your report and iterate.
Expected output: Research reports
Jobs-to-be-done integrated as an additional lane in a journey map.

Example of a backlog in software development for an “epic” (i.e., a new feature) consisting of three user stories.
Cases
The following five case studies provide examples of how service design research is done in practice: how to apply ethnography to gain actionable insights in a service design project (“Case: Applying Ethnography To Gain Actionable Insights”), how to use both qualitative and quantitative research in service design projects (“Case: Using Qualitative and Quantitative Research in Service Design”), how to develop valuable personas and use these in a service design project (“Case: Developing and Using Valuable Personas”), how to illustrate research data with journey maps and use these in a service design project (“Case: Illustrating Research Data With Journey Maps”), and how to use current-state (as-is) and future-state (to-be) journey mapping in service design (“Case: Current-State (as-is) and Future-State (to-be) Journey Mapping”).
5.4.1 Case: Applying ethnography to gain actionable insights
Zahlhilfe program: An intersectoral cooperation to prevent electricity cutoffs
- — Nina Weschenfelder, Senior Service Designer, minds & makers
- — Michael Wend, Senior Customer Experience Manager, E.ON
5.4.2 Case: Using qualitative and quantitative research in service design
- — Cat Drew, Senior Policy Designer, Policy Lab
- — Laura Malan, Senior Consultant, Uscreates
5.4.3 Case: Developing and using valuable personas
- — Phillippa Rose, Service Designer and Facilitator, current.works
5.4.4 Case: Illustrating research data with journey maps
Promoting youth mental health: The impact of mapping the journey
- — Jamin Hegeman, Design Director, Adaptive Path
5.4.5 Case: Current-state (as-is) and future-state (to-be) journey mapping
The bigger picture: Projects building up to more long-term and strategic value
- — Geke van Dijk, Strategy Director, STBY
- — Ozlem Dessauer-Siegers, Sr. Service Experience Design Lead, Vodafone
Case: Applying Ethnography To Gain Actionable Insights
Zahlhilfe program: An intersectoral cooperation to prevent electricity cutoffs
AUTHORS
Nina Weschenfelder Senior Service Designer, minds&makers
Michael Wend Senior Customer Experience Manager, E.ON

The challenge
Every year, the electricity supply is turned off in approximately 350,000 households in Germany 51 because the electricity bill cannot be paid. For those affected, the effects are dramatic and often lead to further social problems. For energy suppliers, cutting off the supply incurs costs, and it negatively affects the company’s image. Energy-related debts are often just one aspect of a complex debt issue and must therefore be addressed holistically. In view of this, there is no viable alternative to a cooperative effort involving institutions from the public, private, and social sectors.
Project objectives
The project was intended to avoid electricity cutoffs, reduce energy debts, and prevent their recurrence. To reach these goals, the various perspectives of all stakeholders in the arena of energy poverty had to be taken into account. The project sought to establish and consolidate intersectoral cooperation between job centers, debt counseling charities, and the energy provider.
The goal is to develop services for customers, job centers, and counseling charities that have an immediate impact as well as long-term benefits, and to implement them throughout Germany.
Our project process: From briefing to evaluation in six phases
We started the Zahlhilfe project in 2014. It consists of six key stages. Following the Identification, Understanding, and Developing phases, we tested the service concepts with approximately 300 real customers, job centers, and counseling charities over a period of six months in the Testing phase.
The joint minds & makers and E.ON project team is currently developing the necessary skills and resources within E.ON to prepare processes and employees for the implementation of the service system. Additionally, we are steadily involving more job centers and debt counseling charities with the aim of rolling out the service system throughout Germany (Implementation phase). In a continuous monitoring process, qualitative and quantitative data from the company operation are being analyzed to make the social and economic effects of the services visible and communicable (Evaluation phase).
In contextual interviews, the dramatic situation of people is visible in the form of the demands and cutoff notices.

Based on service concepts that are linked to insights and opportunity areas, the project team develops first prototypes in a co-creation workshop.
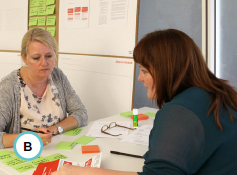
The service blueprint, complemented by insights, opportunity areas, and prototypes of the individual touchpoints, makes the service tangible for all stakeholders.
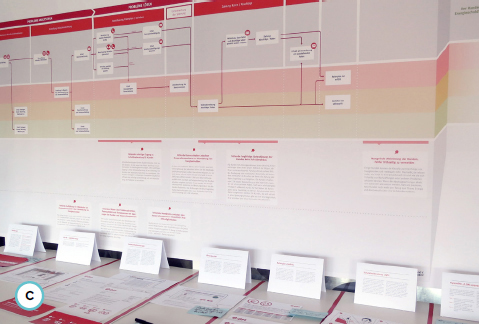
Systematic approach: A guarantee for accountability, a basis for decision making
Our systematic approach is particularly useful in meeting the special challenges of the complex stakeholder cooperation and the long timescale of this project. We systematically integrate our research results into all stages of our innovation process. To this end, we use a precise coding system to be able to consistently trace every step of our work process to our research results at any time: from the original experiences and statements of our respondents to the insights derived from these, right through to the identified opportunity areas, subconcepts, and concepts and to final implementation.
Our stringent coding system is a vital prerequisite to keeping the context of the innovation and service concepts transparent and communicable. For example, we always link the code of an insight to that of the original quotes it is derived from. In concept descriptions, we always quote the insights and opportunity areas the concept is based upon. This high traceability does not apply only linearly to one single project phase and the previous step; thanks to our methodology we can trace back from any project phase to any other project phase.
Our carefully designed research system prevents adaptations of our innovation and service concepts that are not strictly based on our insights and thus contradict our consistent people-centered perspective. The entire content of a project is always transparent and comprehensible for any of the stakeholders so that decisions are made on the basis of verifiable research results instead of opinions or taste.
Results
Job centers, counseling charities, and energy suppliers are working together closely so that E.ON can offer its customers suitable aid at different points of the customer journey: through a separate hotline, counseling charities and job centers can directly reach out to E.ON contact staff who have the authority to take action and suspend cutoff orders immediately. Customers in emergency situations receive initial external debt counseling via telephone, helping them to work on solutions. Interest-free installment plans with realistic payment levels now reduce energy debts for the customers as well as the loss of revenue and other costs for the energy provider. These are just a few examples of our overarching, intersectoral service system that is now being applied throughout Germany and is in the process of consolidation.
The three stakeholders – job centers, counseling charities, and energy provider – are addressing the complex societal problem of energy poverty simultaneously at complementary levels. Finally, to ensure positive outcomes from the project, an accompanying social impact evaluation monitors the service system in the long term, so that potential for optimization can be recognized and implemented continuously.
Because of the Zahlhilfe project, the issues of energy poverty, payment problems, and cutoffs have been given a sustainably firm place within the company structure.
Key Takeaways
01 A high degree of transparency: Using this approach ensures that solutions are very transparent and easy to understand. This is particularly important in more complex cooperations, such as those in which not all stakeholders are involved in all steps of the project.
02 Ongoing verification of completeness and effectiveness: In this approach it is continuously verified that the interests of the various stakeholders are being taken into account and whether the services that are offered solve the identified problems.
03 Flexible application: The original quotes of customers and other stakeholders’ views make their concerns tangible; in this approach findings serve to support decision-making processes undertaken by the responsible bodies.
04 A foundation of research: By building upon the initially conducted research work, this approach makes concepts less vulnerable to ad hoc changes or process dilution.
05 Ongoing effort: This approach is slightly more elaborate in the beginning, but especially in the case of complex, long-term projects it reduces the overall error rate, as well as the time and effort needed for subsequent phases.
Case: Using Qualitative and Quantitative Research in Service Design
Policy Lab Work & Health Project
AUTHORS
Cat Drew Senior Policy Designer, Policy Lab
Laura Malan Senior Consultant, Uscreates

The problem
Around 2.5 million people receive health-related benefits in the United Kingdom, which costs about £15 billion per year, 52 and the wider economic costs of sickness absence and worklessness associated with working-age people in ill health are estimated to be over £100 billion. 53 The longer people are on these benefits, the less likely it is that they will return to work, and being out of work can have a big impact on people’s health and well-being. On the other hand, finding the right work can be actively good for people’s health.
The approach
The UK government’s Policy Lab and the joint Work & Health Unit (a joint unit sponsored by the Department of Health and Department for Work and Pensions) created a multidisciplinary team with the service design agency Uscreates, ethnography agency Keep Your Shoes Dirty, and data science organization Mastodon C, and involved around 70 service providers, users, and stakeholders to solve the problem. After a three-day sprint to properly diagnose the problem, we embarked on a discovery phase of ethnography and data science, and a develop phase where we co-designed and prototyped ideas which we are now taking to scale.
We conducted ethnography with 30 users and people that supported them: doctors, employers, Jobcentre staff, and community groups.
The insights
We used data science techniques (Sankey analysis and k-means clustering) to look at patterns of people surveyed through the Understanding Society survey. It validated the existing insight that once people move onto long-term sickness benefits, they tend to stay on them and that people on health-related benefits also have non-health-related needs. It also revealed fresh insights. For example, the clustering showed two groups of people on health-related benefits who reported comparatively good health, meaning non-health-related interventions must be more important for them, and these two groups were distinct (one high previous salary, the other low). Therefore, we need to personalize responses to support people in different ways.
We used a combination of techniques, including spending time with people in their homes or places of work, conducting interviews based on photos that participants had taken, and doing user-journey interviews.
Two key insights were:
→ People have to tell their stories multiple times to many different services that do not share information, meaning no one has a complete picture about someone’s needs.
→ Individual line managers and confidence are big factors in whether people stay in or get back to work.
Idea generation
We turned these insights into evidence-based challenges to which users, doctors, employers, and policymakers brought their different perspectives at a co-design workshop. Ideas formed around a Work & Health coach who could signpost people to different non-health services, liaise with their employers to make adjustments, and build their confidence. We knew we could not build a whole new service from scratch, so local Jobcentres and community groups prototyped elements of it to see how it could fit in with their existing services.
In Penzance, the Jobcentre tested a website and posters which would allow employers to refer their employees to its service. One employee said: “Something like this would have been useful while I was still in work. I wasn’t as quick as some other staff because of my condition but they didn’t understand that. It might have helped me talk to my manager better about my health and what help I needed from him.”
In Southend, the Jobcentre tested offering its services to the local doctors, so doctors could easily refer patients to them. In East London, the Jobcentre and a local community group tested how they could work together to provide Work & Health coaches with their combined knowledge of local services. In Bournemouth, the Jobcentre tested a Health & Work book for users to keep their information all in one place. One user said: “It helped me organize the situation and focus on what I need to do to get where I need to be.”
Scaling
The qualitative feedback from the prototyping showed that these prototypes had real value. We are now taking the ideas to scale, and the project has prompted wider systems change. The insights gained have informed a more positive and holistic conversation for new applicants for health-related benefits. We are creating a digital version for people who are still in work, preventing them from falling out of work. And the project has played an important part in the creation of the Work & Health Unit (set up halfway through the project) and the subsequent £40 million Work & Health Innovation Fund.
A photograph taken by one of the ethnographic research participants to show her daily experiences.

A prototype of what the digital Health & Work book could look like.
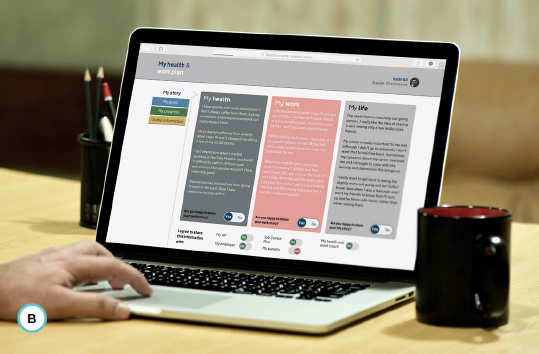
Participants at the co-design day exploring the evidence to inspire new ideas.
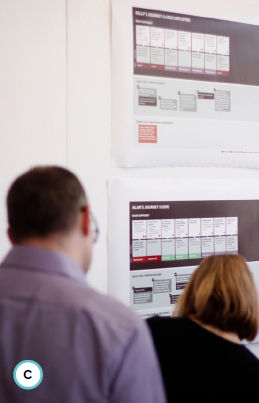
The k-means clustering technique used to segment those reporting to be on health-related benefits.
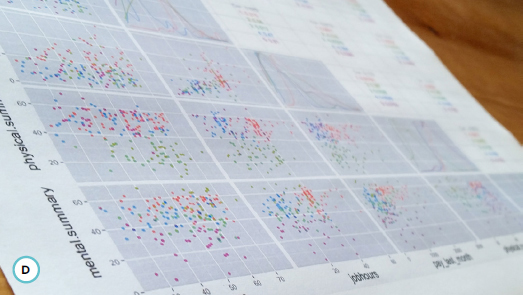
Lessons learned
A valuable lesson was how the insights from the data science informed the ethnography (e.g., revealing how mental and physical health are related), and how the ethnography informed the data science (e.g., highlighting the non-health needs of those on health-related benefits). There is huge power in using these two techniques together, with the data science giving the broad, large-scale “what” and the ethnography providing the deep, rich “why.”
KEY TAKEAWAYS
01 Data science can inform ethnographic insights (and vice versa) through correlation of different events.
02 Combine data science to understand the large-scale context with ethnography to determine the deeper meaning or “why” of your research.
03 When conducting research, speak with people from all ages, levels, and perspectives.
Case: Developing and Using Valuable Personas
Met Office app: A goal-based persona case study
AUTHOR
Phillippa Rose Service Designer and Facilitator, current.works

I recently led user research for the new Met Office 54 app, replacing its old weather app. I worked closely with The App Business design team and the Met Office over six months on a range of research interventions. The use of goal-directed personas proved to be the most consistent and impactful tool.
Traditional demographic metrics were not fit for purpose. It was far more critical to deepen understanding of user behavior patterns, and motivations were key.
What do we need to understand?
In terms of target audiences for the new app, we were asked to design for almost everyone. As ever, we needed to make sure we really understood the problem before we could design solutions.
The weather affects everyone to varying degrees, and increasingly more and more people have smartphones and use them to access weather information – so in designing an experience for almost everyone, we needed to understand people’s levels of interest in the weather and their motivations. We needed to make sense of user tasks and goals. We also needed to consider technical considerations, and of course human behaviors and skill levels, ensuring the app provided just enough of the right information, quickly and easily.
In order to answer some of these questions we chose to create goal-driven personas. This approach was key in identifying and meeting user needs, engaging a wider range of stakeholders, and informing design decisions.
Step 1: Use what you have – what do we know already?
We collated and analyzed existing Met Office desk research and reports, analytics of the old Met Office app, and websites, plus feedback from the Met Office Public Weather Desk. We reflected on the data to get a sense of any common goals, tasks, or correlations between behaviors and motivations.
Step 2: Distilling data into value curves
Next, we distilled evidence from this body of research with recent insights from our own user research – including over 500 interviews, online surveys, and field research – to produce a set of common user tasks and activities influenced by the weather. We then ranked them against key considerations to create a set of value curves of 11 common tasks/scenarios.
Step 3: Testing assumptions through card sorting
We also needed to test our assumptions about what information is most important to people, so we conducted an online card sorting exercise with 139 responses.
Step 4: Value curve trend analysis
We plotted the 11 value curves together and looked for commonalities and patterns between them. Three cluster groups emerged from the value curves one of the accompanying illustrations shows an example of four value curves forming one broad cluster group.
Step 5: Affinity mapping exercise
We then reviewed all our findings and did an affinity mapping exercise to drill down further into the various tasks, looking at behaviors and considerations for individual tasks/goals.
The basic premises of three goal-directed personas emerged from this process: Flexible planners: people adapting plans/timing/locations depending on the forecast conditions (prepared to wait for or seek out the best weather)
— Be prepared: people preparing for and making provision for weather conditions in order to stick to their overall plans, or adapting their plans to incorporate forecast weather conditions
— High stakes/high impact: high-risk outdoor activity/event planning requiring decisions based on long-term forecasting with others involved
Step 6: Persona development workshop
We ran a goal-driven development workshop to flesh out the personas further using a persona template by Lucy Kimbell as a starting point. We adapted Lucy’s template to focus less on individual characteristics and more on goals, environments, and issues.
Here’s the final list of what we found most useful to flesh out each of the personas in turn:
— Goals
— Situations and considerations (can relate to time frames, logistics, or mindset)
— Environment and resources (can include people, information sources, and physical environment)
— Ties and associations (including people and organizations/brands)
— Issues/challenges (what’s stopping them?)
— Workarounds/opportunities (possible solutions, problem solving)
We also used this session to further develop a set of user needs for each persona based on the guidelines from the Government Digital Service: 55
As a … [who is the user?]
I need to … [what does the user want to do?]
So that … [why does the user want to do this?]
Step 7: Sharing
We then distilled the data down even further and wrote it up using a mix of text and images. We shared our refined personas with the wider Met Office teams and stakeholders, and stuck them on the wall in the project room.
Step 8: Ongoing iteration
During ongoing user research the personas are being continuously reviewed and adapted as necessary. Persona profile characteristics have directly informed recruitment of participants for week-long diary studies using Dscout and ExperienceFellow. In usability lab testing interviews we have asked questions to test assumptions and uncover examples of goals, tasks, and behaviors associated with the different personas.
We also ran a series of ongoing design ideation workshops to generate ideas for future app updates and features during 2016 based on the needs and goals of our three core personas, and created a dedicated Trello board to document the ideas with color-coded labels corresponding with the relevant personas.
Learnings and next steps
What is distinct about this approach to previous personas I’ve worked on is that we deliberately concentrated on goals and tasks at the expense of characterization. Each of these three personas is distinct and people may identify with one more than the others, but it is likely that each one of us has experienced user needs similar to at least two of these personas in different situations or at different times in our lives.
A second distinction is that these personas have evolved over a six-month period, whereas often I work with teams on persona development in shorter, sharper iterations. A significant amount of time was dedicated to developing them and evolving them, in a close collaboration between myself, Rob Jung, and Dima Shvedun from The App Business with support from Chris Frost and Jay Spanton at the Met Office.
Key Takeaways
01 Consider focusing the approach on common goals, instead of solely personas, to help identify with user needs.
02 Customer personas can evolve over a period of time as more insights are uncovered.
03 Don’t forget to use existing data that can help provide information.
Insights were distilled into user stories and displayed in the office.
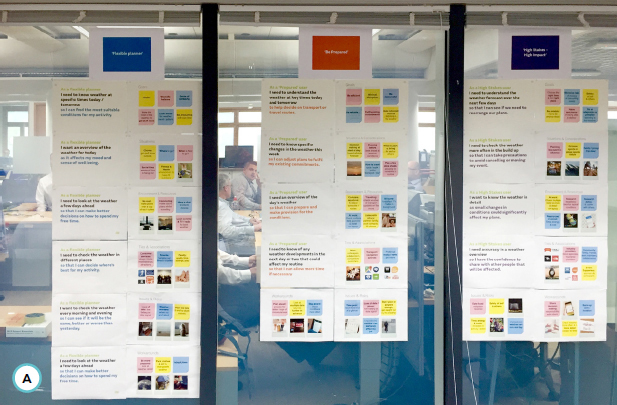
We utilized a persona development template to focus on goals, environments, and issues.
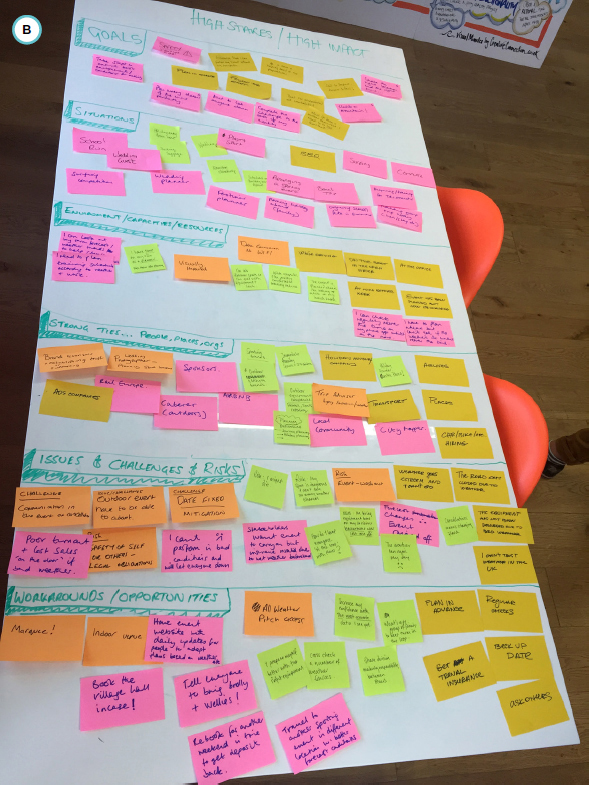
We conducted a series of design ideation workshops to generate ongoing ideas for future updates.
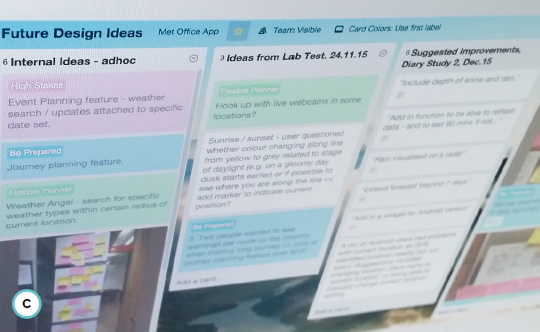
One of the three value curve clusters shows patterns between data.
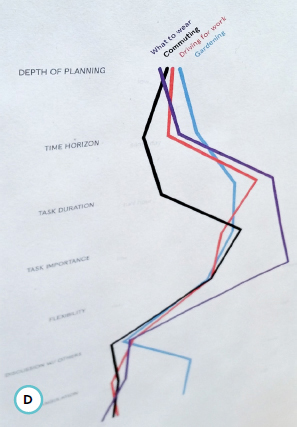
Case: Illustrating Research Data With Journey Maps
Promoting youth mental health: The impact of mapping the journey
AUTHOR
Jamin Hegeman Design Director, Adaptive Path
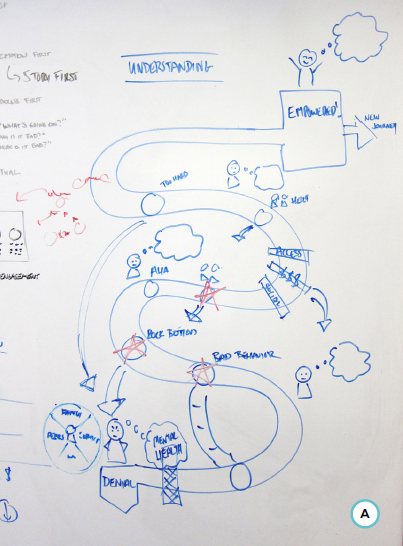
The challenge
How can we help youth with mental health issues in a challenged community within San Francisco? What services might they need? How can we best deliver them? How can we inform policymakers to get the funding for such services? These are the questions that the Edgewood Center for Children and Families’ Organizational Consultation team faced in early 2014 when they contracted with Mo’ MAGIC, the Western Addition collaborative of youth-serving nonprofits.
The Edgewood team sought to bring a human-centered design approach to the challenge. They engaged 29 youths who attend Magic Zone, an after-school program located in the southeastern area of the Western Addition, and conducted 24 qualitative interviews with adult community stakeholders from 15 organizations from within the Western Addition and city-wide.
After a discovery and research phase, Edgewood reached out to Adaptive Path for service design expertise in creating a journey map and facilitating an ideation and prioritization session with community stakeholders. The Adaptive Path team, consisting of one service designer and one visual designer, designed two three-hour workshops: one focused on gathering data to create a journey map, another to generate ideas based on the journey framework.
Journey mapping workshop
For the first workshop, we gathered a small group of subject matter experts, people who worked with the youth in different capacities or on different programs and the Edgewood team that conducted primary research with the 29 youths who attend the Magic Zone after-school program.
The information we sought included the stages of the journey, actions, thoughts or expectations, feelings, people, services, and locations relevant to the stages. We also wanted to identify the high points and low points of each stage. To simplify data collection, we created large butcher paper templates (one for each stage) for the data we needed.
Journey map visualization
After the workshop, we synthesized the data both editorially and visually. We transferred the data into a spreadsheet, grouped like items, and applied an editorial lens to the information. We did this to focus the information and make it succinct and digestible.
In the workshop, we used custom worksheets to capture the essence of what needed to be communicated to aid the editorial process.
A rough-draft sketch of the customer journey helped us better understand the experience of a young person engaged in mental health programs.

Journey sketches showed the different layers of the story.
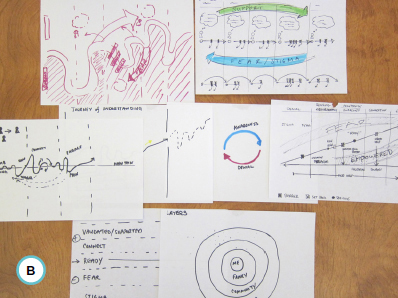
The Mo’ MAGIC journey map illustrates the complete journey with roadblocks that youths face on the path to empowerment.
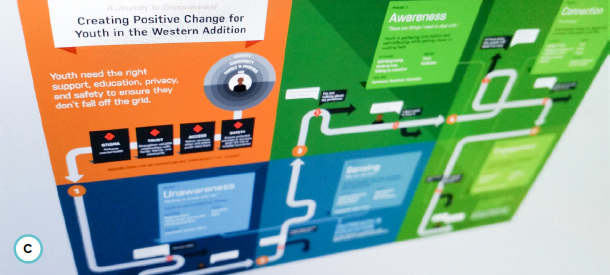
The ideation session generated 140 new, broadly defined concepts that were then prioritized.

We gathered all the data points of the customer journey and analyzed them to tell a complete story.
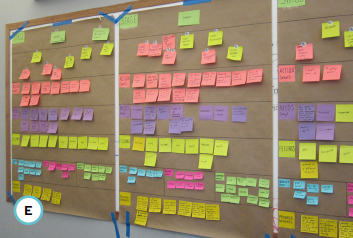
Our visual design process started on paper to quickly explore ideas. We then moved to Illustrator and continued exploring visual constructs. Once the visual matched the story we wanted to tell, we layered in the content. Several rounds of internal critique and share-outs with our stakeholders for feedback followed.
Applying an editorial lens to the content of a journey map is a skill and art in itself.
The keys to a successful journey map include:
Gathering the right content (then editing that for clarity, conciseness, and priority)
Articulating a point of view through communication design
Establishing an effective information hierarchy to ensure key messages are communicated and readers can access information at different levels of zoom
In other words, follow the core principles of effective communication design.
Journey map outcome
The journey is broken into five stages, or phases. Each phase is signified by a one-word title: Unawareness, Sensing, Awareness, Connection, and Engagement. Within each phase, there is a quote that represents the overarching feeling or belief of the youth. This is followed by more of a matter-of-fact statement regarding the situation – for example, “Youth is not considering change.” Each roadblock includes dialogue boxes containing language the youth might use. Dark gray arrows reinforce that youths often drop off the path to empowerment at all phases of the journey.
For the ideation and prioritization workshop, we created an ideation framework modeled after the stages of the journey. It contained a matrix of journey stages and opportunities. A cross-organizational team drew solutions for each box in the ideation framework for a set period of time.
Impact
This project achieved impact in several ways. First, it provided a common tool and language for various organizations and exposed stakeholders to a new way to tackle old problems. Second, stakeholders found the map useful when engaging youths to discuss where they might be in the journey. Finally, the journey map provided a new way to see a complex issue and make the case for funding several initiatives.
“Issues have been studied to death,” says Mo’ MAGIC executive director Sheryl Davis. Creating a journey map to understand the complexity of servicing youths with mental health issues was “very different,” she said. It showed stakeholders where the gaps were and led to new ideas for action. Armed with our journey map and new service concepts, the organization received $200,000 in funding from the Office of the Mayor. That’s service design making an impact.
Key Takeaways
01 A successful customer journey map includes gathering the right content (then editing that for clarity, conciseness, and priority).
02 A customer journey map provides a common tool and language for various organizations and exposed stakeholders to solve problems.
03 Applying an editorial lens to a journey map can help make a complex issue more approachable.
Case: Current-State (as-is) and Future-State (to-be) Journey Mapping
The bigger picture: Projects building up to more long-term and strategic value
AUTHORS
Geke van Dijk Strategy Director, STBY
Ozlem Dessauer-Siegers Sr. Service Experience Design Lead, Vodafone

Introduction
Over the past four years the Service Design Lead at Vodafone has developed and fine-tuned a Service Experience Design methodology that was used for all Vodafone’s customer journeys in the Netherlands, and later also in the rest of the Vodafone countries. STBY contributed to this by doing deep-dive design research on several of these journeys.
Each project focused on a particular set of customer journeys with the aim to better understand the experiences, behaviors, motivations, preferences, latent needs, and pain points of customers. At the same time, considerable extra value has been created across these projects through a structured way of working. The results of this approach have led to a company-wide change program. The key added value of this approach is that customer journeys mapped for specific projects can be linked up to customer life cycles with a more strategic scope. In this way, service design contributes to strategic value for a business on a larger scale than just the individual customer journey projects.
“Customer journeys linked up into a customer life cycle can deliver a more strategic overview with relevance to the wider organization.”
— Ozlem Dessauer-Siegers, Sr. Service Experience Design Lead, Vodafone
Customer journey maps illustrating as-is and to-be service experiences 56
Customer journeys are one of the key tools in the service design approach. In many service design projects, customer journeys are mapped to explore the experiences of people and their interactions with service providers. These customer journey maps offer an important foundation to analyze existing situations and to identify recurring patterns, pain points, and opportunities. A similar format can also be used for a different purpose – to visualize how service experiences could be improved in future offerings.
During each project with various teams in Vodafone the typical dynamic and project flow would be as follows: during the fieldwork stage, customer journeys are mapped to investigate how they actually recently happened (as-is). This leads to insights on aspects that could be improved (low-hanging fruit) and also on opportunity areas for substantial service innovation (new propositions). After a strategic prioritization of the identified opportunities with stakeholders from several departments, the ideation stage in these projects then leads to ideas for new service concepts. These concept directions are expressed in new customer journeys (TO BE) that highlight where and how the customer experience can be improved for both new and existing customers, typically illustrated with sketches to indicate what these new service concepts would add to the customer experience. The concept ideas and sketches are then progressed in implementation projects that further specify and build the new service offerings.
Examples of focus points for the various projects STBY and Vodafone worked on include:
— New contracts for consumers (choosing a new contract or renewing a contract, and choosing a new phone)
— New contracts for businesses (complex process of stakeholder communication and decision making)
— Expenditure (monitoring and managing usage and costs during the contract period)
— Connectivity (experiences with the network during the contract period)
— International usage (traveling abroad during the contract period)
— Multiple contacts (complex interactions between customers and provider)
— Multiple contracts (adding other people or other features to a contract)
“To enable comparison across several projects, it is important to use a systematic approach.”
— Geke van Dijk, Strategy Director, STBY London & Amsterdam
Systematic approach generating progressive deliverables
To enable cross-comparison between the results of various projects, it was important to use a systematic approach and to make sure that the project deliverables were created in a similar way that allowed for progressive understanding and follow-up. The activities across the various stages included quantitative analysis, qualitative analysis, co-creation, and design.
Customer Experience Pyramid © Ozlem Dessauer (2015).

McKinsey’s consumer decision journey, or customer life cycle, is projected from left to right on the customer journey map. The pain points and insights from the design research, channel analysis, and financial analysis are listed from top to bottom.

The systematic set of project deliverables allows for progressive understanding and follow-up.

Examples of some of the as-is and to-be customer journeys documented for the project. Printed posters (±5 meters long) were put up on the wall for the team to work with.

Discover stage:
— Quantitative insight analysis: identify pain points and weak spots in the current offering
— Qualitative data collection: conduct in-depth interviews with a sample of customers (mix of young and old, male and female, various types of phones and contracts)
— Documentation: co-create customer journeys of recent and relevant service experiences, illustrated with photos, videos, and audio recordings
— Design research analysis: perform content analysis to identify patterns in customers’ experiences
Define stage:
— As-is outcome: aggregated customer journey poster, illustrated report with key insights and recommendations, and trail of evidence to original data
Develop stage:
— Co-creation session with internal stakeholders
— High-level conceptual design
— To-be outcome: customer journey for future improved service experience
Deliver stage:
— Detailed design for implementation
In the Define stage, the aggregated as-is customer journey is developed, based on the recurring patterns of customer behavior and pain points found in the individual customer journeys. Relevant insights are then drawn out that lead to both direct improvements for the existing service offering and concept directions for substantial new service offerings. Each to-be customer journey delivers three levels of service solution outcomes: Fix (operational fixes), Optimize (improvements), and Change (service innovations).
From customer journeys to customer life cycles
Although produced for specific projects and specific project teams, customer journeys can also deliver a more strategic overview of consumer–provider interactions and offer relevance for the wider organization. This is done by linking the various customer journey maps into a customer life cycle map. While working together on the subsequent focused service design projects, Ozlem 57 came up with this method, and it turned out to work really well.
Customer life cycles are a key tool in the field of business strategy. The scope of a customer life cycle is wider than that of a customer journey, as it includes the entire relationship from the first day of formal interaction between a customer and an organization (e.g., a new customer requests a quote) until the last day (e.g., the customer stops being a client). In the case of Vodafone, the customer life cycle spans from the first contract offered to a customer to the day that a contract ends and is not renewed.
For customer journeys, the start and end points of the process are less well defined. They usually start when a customer has identified a specific need and engages in activities to fulfill this need, and go until the point that this need is sufficiently fulfilled (or the customer decides to abort the process). This means that there can be a few different customer journeys within a customer life cycle.
Mapping customer journeys according to the focus of what customers are trying to accomplish is very useful for empathizing with their perspective and improving specific service concepts, but from the point of view of the organization these journeys need to be added up to create a more tactical and strategic overview that can be matched with the overall operations and the way the business is run. This is what a customer life cycle offers.
The wider scope of the customer life cycle needs to be taken into account while developing specific project assets. To be able to link the outcomes from each project into an overall customer life cycle, it is important to use a basic similar structure across projects. While doing this, the service design team needs to not only focus on the deliverables for the project at hand, but also anticipate how these deliverables can later be linked up to be useful to a more long-term and strategic view. A firm understanding of the link between customer journeys and customer life cycle maps enables this.
Key Takeaways
01 Several focused customer journeys can be combined into a more overarching and strategic customer life cycle.
02 Customer journeys can be formatted to express both the current as-is state of customer experiences and the envisioned to-be state of future improved customer experiences.
03 Customer journey–based analysis and ideation leads to both direct improvements for existing service offerings and concept directions for substantial new service offerings.
04 A systematic approach to customer journey mapping is needed in order to be able to link up into a customer life cycle.
1 See 5.4.2, Case: Using qualitative and quantitative research in service design, for an example of how to use both quantitative and qualitative research in a service design project.
2 Strictly speaking, these are often more “ethnographically inspired” research methods. In “real” ethnographic research projects, ethnographers usually immerse themselves much more deeply into an organization or culture than designers do. It is not uncommon for ethnographers to spend months or even years in the field researching one particular topic. For a comprehensive introduction to how designers practice ethnographic research, see Nova, N. (2014). Beyond Design Ethnography. Geneva: SHS Publishing.
3 While your research should be heavily rooted in (and maybe start with) a qualitative approach, it should include quantitative data as necessary and useful. Following a a more holistic, mixed-method approach in design research often increases buy-in from other stakeholders.
4 The term “products” describes anything a company offers – no matter if this is tangible or not. In academia, products are often divided into goods and services. However, products are usually bundles of services and physical/digital products. As “goods” is colloquially understood as referring to something tangible, we prefer to speak of physical/digital products. Read more on this in the textbox Service-dominant logic in 2.5.
5 For a description of a well-articulated research design see, for example: Peffers, K., Tuunanen, T., Rothenberger, M. A., & Chatterjee, S. (2007). “A Design Science Research Methodology for Information Systems Research.” Journal of Management Information Systems, 24(3), 45–77. For a brief scholarly discussion of problems of internal and external reliability and validity of ethnographic research see, for example, LeCompte, M. D., & Goetz, J. P. (1982). Problems of Reliability and Validity in Ethnographic Research. Review of Educational Research, 52(1), 31-60.
6 See Preparatory research in 5.2.
7 You’ll find some helpful methods for creating many research questions with your design team in Chapter 6, Ideation.
8 Iteration does not mean doing the same thing over again. It means reflecting on your new data, adapting your approach, and starting another experiment. For more, see the textbox Adapt and iterate forward in 4.4.
9 “How many interviews are enough?” Theoretical saturation helps us understand when we have done enough, but it doesn’t help us to define a sample size a priori. For example, when you have interviewed 20 (randomly selected) participants and identified patterns, the probability that the next 20 will tell you something completely different is negligible (i.e., theoretical saturation). However, you don’t know how many people you will have to ask before you start seeing these patterns – it could be 10, 20, 30, or even more. See, for example, Guest, G., Bunce, A., & Johnson, L. (2006). “How Many Interviews Are Enough? An Experiment with Data Saturation and Variability.” Field Methods, 18(1), 59-82. For an academic review of theoretical saturation, see for example, Bowen, G. A. (2008). “Naturalistic Inquiry and the Saturation Concept: A Research Note.” Qualitative Research, 8(1), 137-152. For a more critical reflection on this topic, see O’Reilly, M., & Parker, N. (2013). “‘Unsatisfactory Saturation’: A Critical Exploration of the Notion of Saturated Sample Sizes in Qualitative Research.” Qualitative Research, 13(2), 190-197).
10 For a brief academic discussion on the ethics of covert research, see Van Deventer, J. P. (2009). “Ethical Considerations During Human Centred Overt and Covert Research.” Quality & Quantity, 43(1), 45-57. For a more general scholarly literature review on overt and covert research in ethnography, see Amstel, H. R. V. (2013). “The Ethics and Arguments Surrounding Covert Research.” Social Cosmos, 4(1), 21-26.
11 All of these methods are described in detail in 5.2.
12 Denzin (1978) refers to four types of triangulation: method (methodological) triangulation, data triangulation, researcher (investigator) triangulation, and theory triangulation. For more information, see Denzin, N. K. (1978). “Triangulation: A Case for Methodological Evaluation and Combination.” In N. K. Denzin (ed.), Sociological Methods: A Sourcebook (pp. 339–357), Routledge.
13 See 12.5.6, Case: Building up service design knowledge across projects, for an example of how to reuse previous research.
14 The second-order concepts are the “theories” an analyst uses to organize and explain these [first-order] “facts” (p. 39), and “theories are tested, retested, and tested again in the field” (p. 51). Quotes from Van Maanen, J. (1979). “Reclaiming Qualitative Methods for Organizational Research: A Preface.” Administrative Science Quarterly, 24(4), 520-526.
15 See 5.4.1, Case: Applying ethnography to gain actionable insights, for a nice example of how to use indexing with a coding system to consistently trace every step of a design process to the research results.
16 Researchers use a huge variety of software to synthesize and analyze data, from simple spreadsheets or documents to sophisticated qualitative research software, such as ATLAS.ti, MAXQDA, NVivo, or QDA Miner, to name but a few. There is a wide selection of very specialized research software for different purposes.
17 Some methods require transcribing audio and video files so that researchers work only with text files. With new software, various data types can be codified using the same software: text can be coded at certain lines, audio and video files at certain timestamps, and photos at certain positions.
18 All of these methods are described in detail in 5.3.
19 Keep your research wall separate from your idea wall, if you have one. The concept of an idea wall is explained in Chapter 6, Ideation.
20 Note the difference between codifying data and indexing data. Labels used for indexing data are often rather cryptic and only serve to find a specific piece of data within the raw dataset (e.g., “i6.17” or “o12.3:22”). Labels or tags used for codifying data are often keywords to summarize or interpret parts of the data. This could be categories of customer problems or phrases that customers repeatedly mentioned (e.g., “ticket machine” or “too little time to choose”). However, in practice, indexing and coding are often mixed up or used interchangeably.
21 See Writing user stories in 5.3 for a description of user stories and 8.3, Service design and software development, on how to use these in software development.
23 See Chapter 7, Prototyping.
24 See Chapter 6, Ideation, for more on dealing with ideas that come up at unexpected times.
25 See also the more detailed online versions of these methods at www.tisdd.com.
26 See 9.2.2, Preparatory research, for a brief description of the importance of prep research for the overall service design process.
27 For a description and discussion of a more systematic process to use secondary data in research see, for example: Johnston, M. P. (2017). Secondary data analysis: A method of which the time has come. Qualitative and Quantitative Methods in Libraries, 3(3), 619-626.
28 For a more comprehensive introduction to how autoethnography can be used as a qualitative research method see, for example, Adams, T. E., Holman Jones, S., & Ellis, C. (2015). Autoethnography: Understanding Qualitative Research (Oxford University Press).
29 One of the most-cited descriptions of virtual ethnography is Hine, C. (2000). Virtual Ethnography. Sage.
30 According to one of the seminal books on participant observation from 1980, there’s a continuum in the level of researcher involvement from non-participatory to passive, moderate, active, and complete participation. See (new edition) Spradley, J. P. (2016). Participant Observation. Waveland Press.
31 See, for example, Beyer, H., & Holtzblatt, K. (1997). Contextual Design: Defining Customer-centered Systems. Elsevier.
32 The original empathy map includes the topics of Who are we empathizing with?, What do they need to do?, What do they see/say/do/hear?, and What do they think and feel (pains and gains)? In 2017, Who are we empathizing with? and What do they need to do? were added to the original template. See Gray, D., Brown, S., & Macanufo, J. (2010). Gamestorming: A Playbook for Innovators, Rulebreakers, and Changemakers. Sebastopol: O’Reilly.
33 You might realize a certain bias regarding focus groups in this text. Here’s why: “Focus groups are actually contraindicated by important insights from several disciplines,” says Gerald Zaltman, Emeritus Professor, Harvard Business School. “The correlation between stated intent and actual behavior is usually low and negative.” Source: Zaltman, G. (2003). How Customers Think: Essential Insights into the Mind of the Market. Harvard Business Press, p. 122.
34 You can also do overt non-participant observation, for example, when researchers sit in on meetings or workshops on site, but do not actively participate in it. They behave like a “fly on the wall”. See also the textbox Overt vs. covert research in 5.1.3.
35 For a comparison of mobile ethnography with other ethnographic approaches, see Segelström, F., & Holmlid, S. (2012). “One Case, Three Ethnographic Styles: Exploring Different Ethnographic Approaches to the Same Broad Brief.” In Ethnographic Praxis in Industry Conference Proceedings, 2012 (1), 48-62. For more examples of applied mobile ethnography in tourism, see Stickdorn, M., & Frischhut, B. (eds.) (2012). Service Design and Tourism: Case Studies of Applied Research Projects on Mobile Ethnography for Tourism Destinations. BoD–Books on Demand.
36 For an introduction on how to use cultural probes in design see, for example, Gaver, B., Dunne, T., & Pacenti, E. (1999). “Design: Cultural Probes.” interactions, 6(1), 21-29.
37 Photo: ExperienceFellow.
38 Photo: Martin Jordan.
39 See 3.2, Personas; see Chapter 10, Facilitating workshops, for hands-on tips on facilitation and how to build a safe space.
40 See also 3.4, System maps, and Chapter 10, Facilitating workshops.
41 See 8.3, Service design and software development for an example of how a research wall is used to connect different service design activities of research, ideation, prototyping, and implementation.
42 For a comprehensive introduction to creating and using personas see, for example, Goodwin, K. (2011). Designing for the Digital Age: How to Create Human-centered Products and Services. John Wiley & Sons.
43 There are many ways to visualize experiences as maps. See, for example, Kalbach, J. (2016). Mapping Experiences: A Complete Guide to Creating Value through Journeys, Blueprints, and Diagrams. O’Reilly.
44 For case studies detailing how to use journey maps in service design projects, see 5.4.4, Case: Illustrating research data with journey maps, as well as 5.4.5, Case: Current-state (as-is) and Future-state (to-be) Journey Mapping.
45 Photo: Wuji Shang and Muwei Wang, MDes, Service Design and Innovation, LCC, University of the Arts, London.
46 Photo: Smaply.
47 The mapping of systems is particularly useful in the context of product service system innovation. See, for example, Morelli, N. (2006). “Developing New Product Service Systems (PSS): Methodologies and Operational Tools.” Journal of Cleaner Production, 14(17), 1495-1501.
48 “In contrast to this abundant data, insights are relatively rare. [...] When they are generated, though, insights derived from the smart use of data are hugely powerful. Brands and companies that are able to develop big insights – from any level of data – will be winners.” Kamal, I. (2012). “Metrics Are Easy; Insight Is Hard,” at https://hbr.org/2012/09/metrics-are-easy-insights-are-hard.
49 Clayton, M. C., & Raynor, M. E. (2003). The Innovator’s Solution: Creating and Sustaining Successful Growth. Harvard Business School Press.
50 User stories are used in many agile software development frameworks, such as Extreme Programming, Scrum, and Kanban. Mind that different approaches often use specific templates for how to phrase user stories. See, for example, Schwaber, K., & Beedle, M. (2002). Agile Software Development with Scrum (Vol. 1). Upper Saddle River: Prentice Hall.
51 Bundesnetzagentur (2015). Monitoring Report, p. 192.
52 Black, C., & Frost, D. (2011). “Health at Work – An Independent Review of Sickness Absence,” Annual Report of the Chief Medical Officer.
53 Department of Health (2013). “Annual Report of the Chief Medical Officer 2013.”
54 The Met Office is the United Kingdom’s national weather service.
55 This template is often called a “user story.” See also: Writing user stories in 5.3.
56 In this book, as-is and to-be journey maps are referred to as “current state” and “future state,” respectively. See Mapping journeys in 5.3.
57 Ozlem Dessauer-Siegers, Sr. Service Experience Design Lead at Vodafone.