
Chapter 9. Monitoring Enclaves
Information in this Chapter:
• Determining What to Monitor
• Successfully Monitoring Enclaves
• Information Management
• Log Storage and Retention
The first step of information analysis requires a certain degree of information collection, so that there is a healthy body of data to assess. Collecting information relevant to cyber security requires knowing what to monitor and how to monitor it.
Unfortunately, there is a lot of information that could be relevant to cyber security, and because there are many unknown threats and exploitations, even information that may not seem relevant today may be relevant tomorrow as new threats are discovered. Even more unfortunate is that the amount of seemingly relevant data is already overwhelming—sometimes consisting of millions or even billions of events in a single day, with even higher rates of events occurring during a period of actual cyber attack. 1 It is therefore necessary to assess which events, assets, applications, users, and behaviors should be monitored—as well as any additional relevant systems that can be used to add context to the information collected therefrom, such as threat databases, user information, vulnerability assessment results, etc.
1.J.M. Butler. Benchmarking Security Information Event Management (SIEM). The SANS Institute Analytics Program, February, 2009.
An additional challenge arises from the segregated nature of a properly secured industrial network: deploying a single monitoring and information management system across multiple otherwise-separated enclaves violates those enclaves and introduces potential risk. The methods used to monitor established enclaves must be considerate of the separation of those enclaves, and the data generated from this monitoring need to be managed accordingly as well. While there are benefits to fully centralized information management, the information being generated may be sensitive and may require “need to know” exposure to security analysts. Therefore, centralized monitoring and management needs to be overlaid with role-based information access, and some enclaves may require full separation—forgoing the efficiencies of central management so that the analysis, information management and reporting of sensitive information can be kept local in order to maintain absolute separation of duties between, for example, a highly critical safety system and a less secure supervisory system.
In order to deal with massive volumes of log and event data that can result from monitoring established network enclaves, and the challenges of highly distributed and segregated enclaves, best practices in information management—including short- and long-term information storage—must be followed. This is necessary both in order to facilitate the threat detection process, and also as a mandate for relevant compliance requirements, such as North American Electric Reliability Corporation Critical Infrastructure Protection (NERC CIP), NRC Title 10 CFR 73.54, Chemical Facility Anti-Terrorism Standards (CFATS), and others (see Chapter 10, “Standards and Regulations”).
Determining what to Monitor
The trite answer to “what to monitor” is “everything.” However, everything that we monitor results in information that must be managed. Every data point results in a log record, or perhaps a security or safety alert. Assets, users, applications and the networks that interconnect them all require monitoring. Because there are so many assets, users, applications, and networks that need to be monitored, the total amount of information generated every second in even a moderately sized enterprise can be staggering. 2 While products exist to automate security event and information management, the total amount of information that is available for analysis can quickly overwhelm the information analysis and storage capacity of these tools. Therefore, security monitoring requires some planning and preparation in order to ensure that all necessary information is obtained, without overloading and potentially crippling the tools that the information is intended to feed.
2.Ibid.
One approach is to segregate monitoring by enclave. Just as the separation of functional groups into enclaves helps minimize risk, it also helps to minimize the total information load that is generated by that enclave; that is, there are limited assets and activities within an enclave, and therefore there are less total logs and events.
To further complicate matters, operational technology (OT) activities and metrics must also be considered when securing industrial networks—representing new data types from yet another potentially overwhelming source of: new assets such as Remote Terminal Units (RTUs), Programmable Logic Controllers (PLCs), Intelligent Electronic Devices (IEDs), and other industrial assets; applications such as Human–Machine Interfaces (HMIs), and Historians; and networks such as fieldbus and smart grid networks.
Tip
When considering network monitoring and information management, it is helpful to benchmark the information load currently being produced in both IT and OT networks. IT networks require identifying which devices need to be monitored. This means understanding what servers, workstations, firewalls, routers, proxies, etc. (almost every IT device is capable of producing logs of some sort) are important—the process of determining critical assets described in Chapter 2, “About Industrial Networks,” and Chapter 7, “Establishing Secure Enclaves,” is helpful here. Once it has been determined which devices need to be monitored, the event load generated by these devices needs to be calculated. One method is to measure event load of a period of time that contains both normal and peak activity, and divide the total number of events by the time period (in seconds) to determine the average event per second (EPS) load of the network. Alternately, a worst-case calculation can be based entirely on peak event rates, which will result in a higher EPS target. 3
3.Ibid.
In OT networks, most assets do not produce events or logs at all, and therefore they cannot be measured. They do produce information, however. This can be easily derived by looking at historized data from the control plants, and/or through the use of specialized industrial protocol monitors. Determine which assets you wish to monitor, and use the Data Historian system to determine the amount of information collected from these assets over time. This information will need to be normalized and centralized—either automatically via an SIEM or similar product, or manually via human time and effort—so it may be prudent to limit the amount of historized data that need to be exposed for security assessment. Some Historian tags—especially system tags concerning authentication, critical alarm tags concerning point or operational changes, stopped or failed processes, etc.—are obvious choices, while others may have little relevance to security.
Once the initial benchmark is obtained, add 10% for growth, and 10% for headroom. When sizing the IT network, it is also prudent to plan for “peak averages” where peak traffic rates occur for extended periods of time (i.e., the peak becomes the average), as this condition can occur during an extended attack, or as a result of a successful breach and subsequent infection with malware. 4 OT systems, on the other hand, may report different conditions but are less likely to report higher numbers of conditions unless the control process being historized has been significantly altered.
4.Ibid.
So what really needs to be monitored? The following guidelines help to identify what systems should be monitored.
Security Events
Security events are those events generated by security products: network- or host-based firewalls, Anti-Virus systems, intrusion detection and prevention systems, application monitors, application whitelisting systems, etc. Ideally, any event generated by a security device should be relevant, and therefore, these devices should be used for promiscuous monitoring. Realistically, false positives can dilute the relevance of security events.
Note
The term “false positive” is often misused. Because security logs and events originate from so many sources and are often generated quickly and in large quantities, false positives are often associated with what are seemingly irrelevant security data. When an alert is generated because a benign activity matches a detection signature of an Intrusion Prevention System (IPS), the result is a false positive. Similarly, if an Anti-Virus system falsely indicates that a file is infected, the result is a false positive. False positives make security analysis more difficult by generating extra data points that need to be assessed, potentially clouding real incidents from detection.
False positives can be minimized or eliminated through tuning of the faulty detection signatures: a process that should be performed regularly to ensure that detection devices are operating as efficiently as possible. However, while false positives often result in large amounts of unnecessary or irrelevant data, not all irrelevant data are false positives. Because of this common misconception, many security analysts and even security vendors are tempted to overly tune devices to eliminate any alert that occurs in large numbers. The issue with overly aggressive tuning is that while it will make incidents easier to manage in day-to-day operations, it can introduce false negatives—that is, when a real threat fails to create an alert, or when a correlation rule fails to trigger because a necessary condition was suppressed by over-tuning (see Chapter 8, “Exception, Anomaly, and Threat Detection”). Remembering that event correlation signatures are signature-matching rules that detect known threat patterns, the elimination of smaller seemingly irrelevant events can prevent detection of the larger pattern. Similarly, as new patterns are discovered by security researchers, event data that seem irrelevant today may become relevant in the future.
To ensure accurate threat detection and correlation, all legitimately produced events should be retained short term for live analysis (i.e., kept online) and long term for forensic and compliance purposes (i.e., kept offline) regardless of how irrelevant they may seem at the time of collection. Only true false positives—the events generated due to a false signature match—should be eliminated via tuning or filtering.
When considering the relevance of security events in industrial networks, consider the source of the event and its relevance to the specific enclave being monitored. For example, all enclaves should have at least one perimeter security device such as a firewall or IPS, but there may be host security events (Anti-Virus application whitelisting) and possibly internal Intrusion Detection System (IDS) or IPS, firewalls or other security devices (see Chapter 7, “Establishing Secure Enclaves”). One example is industrial security appliances that use industrial protocol and application monitoring to enforce how industrial protocols are used.
These logs might provide much more specific data to an enclave than do general security events, as seen in the example below from a Tofino industrial security appliance:
IP_DST=192.168.1.1 LEN=55 TOS=0 TTL=128 PROTO=TCP PORT_SRC=4516 PORT_DST=502 SEQ=3893700258 ACK_SEQ=1852284905 URG=0 ACK=1 PSH=1 RST=0 SYN=0 FIN=0 Description: Function Code List: The function code (16) is not in permitted function code list
In contrast, a generic Snort IDS might produce a syslog identifying a perimeter policy violation, such as the attempted Windows update shown below, but cannot provide the context of application function codes within the industrial network (see Chapter 4, “Industrial Network Protocols”).
Jan 01 00:00:00 [69.20.59.59] snort: [1:2002948:6] ET POLICY External Windows Update in Progress [**] [Classification: Potential Corporate Privacy Violation] [Priority: 1] {TCP} 10.1.10.33:1665 -> 192.168.25.35:80
Assets
Assets—the physical devices within the network—also provide security data, typically in the form of logs. Assets can produce logs that track activity on a variety of levels: the operating system itself produces many logs, including system logs, application logs, and file system logs.
System logs are useful for tracking the status of devices and the services that are (or are not running), as well as when patches are (or are not) applied. Logs are useful for determining the general health of an asset as well as the validation that approved ports and services are running. These are also valuable in tracking which users (or applications) have authenticated to the asset, satisfying several compliance requirements. The following represent individual records from a Redhat Linux system log showing a successful user login, and a Windows failed authentication:
<345> Mar 17 11:23:15 localhost sshd[27577]: Accepted password for knapp from ::ffff:10.1.1.1 port 2895 ssh2
<345> Fri Mar 17 11:23:15 2011 680 Security SYSTEM User Failure Audit ENTERPRISE Account Logon attempt by:
MICROSOFT_AUTHENTICATION_PACKAGE_V1_0 Logon account: KNAPP Source Workstation: ENTERPRISE Error Code: 0xC000006A 4574
Although syslog is ubiquitously used across a variety of systems, other event logging systems are used as well—the most notable of which is the Windows Management Instrumentation (WMI) framework. WMI produces auditable events in a structured data format that can be used against scripts (for automation) as well as by other Windows operating system functions. 5 Because syslog is so widely supported, WMI events are often logged using a Windows syslog agent to stream WMI events over syslog.
5.Microsoft. Windows Management Instrumentation. < http://msdn.microsoft.com/en-us/library/aa394582(v=VS.85).aspx>, January 6, 2011 (cited: March 3, 2011).
The following WMI event example indicates the creation of a new process on a Windows server:
Computer Name: WIN-0Z6H21NLQ05
Event Code: 4688
Type: Audit Success (4)
User Name:
Category: Process Creation
Log File Name: Security
String[%1]: S-1-5-19
String[%2]: LOCAL SERVICE
String[%3]: NT AUTHORITY
String[%4]: 0x3e5
String[%5]: 0xc008
String[%6]: C:WindowsSystem32RacAgent.exe
String[%7]: %%1936
String[%8]: 0xc5e4
Message: A new process has been created. Subject: Security ID: S-1-5-19 Account Name: LOCAL SERVICE Account Domain: NT AUTHORITY Logon ID: 0x3e5 Process Information: New Process ID: 0xc008 New Process Name: C:WindowsSystem32RacAgent.exe Token Elevation Type: TokenElevationTypeDefault (1) Creator Process ID: 0xc5e4 Token Elevation Type indicates the type of token that was assigned to the new process in accordance with User Account Control policy. Type 1 is a full token with no privileges removed or groups disabled. Afull token is only used if User Account Control is disabled or if the user is the built-in Administrator account or a service account. Type 2 is an elevated token with no privileges removed or groups disabled. An elevated token is used when User Account Control is enabled and the user chooses to start the program using Run as administrator. An elevated token is also used when an application is configured to always require administrative privilege or to always require maximum privilege, and the user is a member of the Administrators group. Type 3 is a limited token with administrative privileges removed and administrative groups disabled. The limited token is used when User Account Control is enabled, the application does not require administrative privilege, and the user does not choose to start the program using Run as administrator.
The same event, when collected via syslog using a WMI agent such as Snare, might look like this:
<12345> Fri Mar 17 11:23:15 2011||WIN-0Z6H21NLQ05||4688||Audit Success (4)||||Process Creation||Security||S-1-5-19||LOCAL SERVICE||NT AUTHORITY||0x3e5||0xc008||C:WindowsSystem32RacAgent.exe||%%1936||0xc5e4
Application logs (covered in more detail under the section “Applications”) provide a record of application-specific details such as logon activities to an HMI, configuration changes, and other details that indicate how an application is being used.
File system logs typically track when files are created, changed, or deleted, when access privileges or group ownerships are changed, and similar details. File system logging is included in Windows using the Windows File Protection (WFP) within WMI, which is an “infrastructure for management data and operations on Windows-based operating systems.”6 File monitoring in Unix and Linux systems is performed using auditd, and there are also commercial file integrity monitoring (FIM) products available such as Tripwire (www.tripwire.com) and nCircle (www.ncircle.com). These logs are extremely valuable for assuring the integrity of important files stored on an asset—such as configuration files (ensuring that the asset’s configurations remain within policy), and the asset’s log files themselves (ensuring that logged activities are valid and have not been tampered with to cover up indications of illicit behavior).
6.Ibid.
Configurations
Configuration monitoring refers to the process of monitoring baseline configurations for any indications of change, 7 and is only a small part of Configuration Management (CM). Basic configuration monitoring can be done at a rudimentary level through a combination of host configuration file monitoring (to establish the baseline), system and application log monitoring (to look for change actions) and FIM (to ensure that configurations are not altered). While this does not provide true CM, it does provide an indication as to when established configurations are altered, providing a valuable security resource.
7.National Institute of Standards and Technology, Special Publication 800-53 Revision 3. Recommended Security Controls for Federal Information Systems and Organizations, August, 2009.
Full CM systems provide additional key functions, typically mapping at least partially to the security controls outlined in NIST SP 800-53 under the section “Configuration Management,” which provides a total of nine configuration management controls: 8
8.Ibid.
• Configuration management policy and procedures—establishes a formal, documented configuration management policy
• Baseline configurations—identifying and documenting all aspects of an asset's configurations to create a secure template against which all subsequent configurations are measured
• Change control—monitoring for changes and comparing changes against the established baseline
• Security impact analysis—the assessment of changes to determine and test how they might impact the security of the asset
• Access restrictions for change—limiting configuration changes to a strict subset of administrative users
• Configuration settings—identification, monitoring and control of security configuration settings and changes thereto
• Least functionality—the limitation of any baseline configuration to provide the least possible functionality to eliminate unnecessary ports and services
• Information service (IS) component (asset) inventory—establishing an asset inventory to identify all assets that are subject to CM controls, as well as to detect rogue or unknown devices that may not meet baseline configuration guidelines
• Establishment of a configuration management plan—assigning roles and responsibilities around an established CM policy to ensure that CM requirements are upheld
Configuration management tools may also offer automated configuration controls to allow batch configurations of assets across large networks, which is useful for ensuring that proper baseline configurations are used in addition to improving desktop management efficiencies. For the purposes of security monitoring, it is the monitoring and assessment of the configuration files themselves that is a concern. This is because an attacker will often attempt to either escalate user privileges in order to obtain higher levels of access, or alter the configurations of security devices in order to penetrate deeper into secured enclaves—both of which are detectable with appropriate CM controls in place.
The logs produced by the CM are therefore a useful component of overall threat detection by using change events in combination with other activities such as an event correlation system. For example, a port scan, followed by an injection attempt on a database, followed by a configuration change on the database server is indicative of a directed penetration attempt. Change logs are also highly beneficial for compliance and regulatory purposes, with configuration and change management being a common requirement of most industrial security regulations (see Chapter 10, “Standards and Regulations”).
Applications
Applications run on top of the operating system and perform specific functions. While monitoring application logs can provide a record of the activities relevant to those functions, direct monitoring of applications using a dedicated application monitoring product or application content firewall will provide a granular account of all application activities. Application logs can include when an application is executed or terminated, who logs into the application, and specific actions performed by users once logged in. The information contained in application logs is a summary, as it is in all log records. A sample application log record generated by an Apache web server is provided below:
Jan 01 00:00:00 [69.20.32.12] 93.80.237.221 - - [24/Feb/2011:01:56:33 -0000] "GET/spambot/spambotmostseendownload.php HTTP/1.0" 500 71224 "http://yandex.ru/yandsearch?text=video.krymtel.net" "Mozilla/4.0 (compatible; MSIE 6.0; Windows NT 5.1; MRA 4.6 (build 01425))"
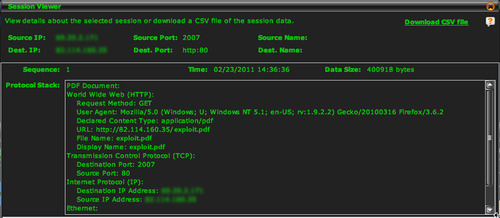
For more detailed accounting of application activity, an application monitoring system can be used. For example, while it is possible that malware might be downloaded over HTTP, and be indicated in a log file such as the example shown above, monitoring an application’s contents across a session could indicate malware that is embedded in a file being downloaded from an otherwise normal-seeming website, as shown in Figure 9.1.
Networks
Network flows are records of network communications, from a source to one or more destinations. Flows are typically tracked by network infrastructure devices such as switches and routers. Flow collection is typically proprietary to the network device manufacturer (e.g., Cisco supports netFlow, Juniper supports jFlow, etc.), although many vendors also support the sFlow standard.
Monitoring flows provides an overview of network usage over time (for trending analysis, capacity planning, etc.) as well as at any given time (for impact analysis, security assessment, etc.), and can be useful for a variety of functions, including the following: 9
9.sFlow.org. Traffic Monitoring using sFlow. < http://www.sflow.org/sFlowOverview.pdf>, 2003 (cited: March 3, 2011).
• Network diagnosis and fault management
• Network traffic management or congestion management
• Application management, including performance management, and application usage assessments
• Application and/or network usage accounting for billing purposes
• Network security management, including the detection of unauthorized devices, traffic, etc.
Network flow analysis is extremely useful for security analysis because it provides the information needed to trace the communications surrounding a security incident back to its source. For example, if an application whitelisting agent detects malware on an asset, it is extremely important to know where that malware came from, as it has already breached the perimeter defenses of the network and is now attempting to infect machines. By correlating the malware attempt to network flows, it may be possible to trace the source of the malware and may also provide a path of propagation (i.e., where else did the virus spread to).
For industrial network security, network flow analysis also provides an indication of network performance, which is important because of the negative impact that network performance can have on process quality and efficiency, as shown in Table 9.1. For example, an increase in latency can cause certain industrial protocols to fail, halting industrial processes. 10
10.B. Singer, Kenexis Security Corporation, in: D. Peterson (Ed.), Proceedings of the SCADA Security Scientific Symposium, 2: Correlating Risk Events and Process Trends to Improve Reliability, Digital Bond Press, 2010.
| Flow Detail | What It Indicates | Security Ramifications |
|---|---|---|
| SNMP interface indices (ifIndex in IF-MIB) | The size of the flow in terms of traffic volume (bytes, packets, etc.), as well as errors, latency, discards, physical addresses (MAC addresses), etc. | SNMP details can provide indications of abnormal protocol operation that might indicate a threat |
| More germane to industrial networks, the presence of interface errors, latency, etc. can be directly harmful to the correct operation of many industrial protocols (see Chapter 4, “Industrial Network Protocols”) | ||
| Flow start time | When a network communication was initiated and when it ended | Essential for the correlation of communications against security events |
| Flow end time | Collectively, the start and stop timestamps also indicate the duration of a network communications | |
| Number of bytes/packets | Indicates the “size” of the network flow, indicative of how much data is being transmitted | Useful for the detection of abnormal network access, large file transfers, as might occur during information theft (e.g., retrieving a large database query result, downloading sensitive files, etc.) |
| Source and destination IP addresses | Indicates where a network communication began and where it was terminated | Essential for the correlation of related logs and security events (which often track IP address details) |
| Source and destination port | Note that in non-IP industrial networks, the flow may terminate at the IP address of an MI or PLC even though communications may continue over specialized industrial network protocols | IP addresses may also be used to determine the physical switch or router interface of the asset, or even the geographic location of the asset (through the use of a geo-location service) |
User Identities and Authentication
Monitoring users and their activities is an ideal method for obtaining a clear picture of what is happening on the network, and who is responsible. User monitoring is also an important component of compliance management, as most compliance regulations require specific controls around user privileges, access credentials, roles, and behaviors.
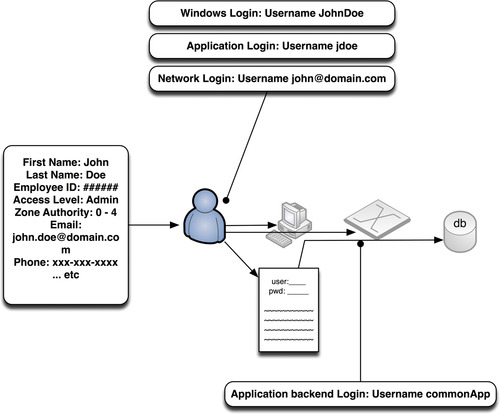
Unfortunately, the term “user” is vague: there are user account names, domain names, host names, and of course the human user’s identity. While the latter is what is most often required for compliance management (see Chapter 10, “Standards and Regulations”), the former are what is typically provided within digital systems. Authentication to a system requires a username and password, from a machine that has a host name, which might be one of several hosts in a named domain. The application itself might then authenticate to another backend system (such as a database), which has its own name and to which the application authenticates using yet another set of credentials. To further complicate things, the same human operator might need to authenticate to several systems, from several different machines, and may use a unique username on each.
It is therefore necessary to normalize users to a common identity, just as it is necessary to normalize events to a common taxonomy. This can be done by monitoring activities from a variety of sources (network, host, and application logs), extracting whatever user identities might be present, and correlating them against whatever clues might be preset within those logs. For example, if a user authenticates to a Windows machine, launches an application and authenticates to it, and then the application authenticates to a backend system, it is possible to track that activity back to the original username by looking at the source of the authentications and the time at which they occurred; because they occurred from the same physical console in clear succession, it can be assumed that all three authentications were by the same user.
As the systems become more complex and distributed, and as the number of users increases, each with specific roles and privileges, this can become cumbersome, and an automated identity management mechanism may be required.
This process is made simpler through the use of common directories, such as Microsoft Active Directory and/or the Lightweight Directory Access Protocol (LDAP), which act as identity directories and repositories. However, there may still be several unique sets of credentials per human operator. The difficulty lies in the lack of common log formats, and the corresponding lack of universal identities between diverse systems. User monitoring therefore requires the extraction of user information from a variety of network and application logs, followed by the normalization of that identity information. John Doe might log into a Windows domain using the username j.doe, have an e-mail address of [email protected], log into a corporate intranet or CMS as johnnyd, etc. To truly monitor user behavior, the recognition of j.doe, jdoe, and johnnyd as a single identity is necessary.
Several commercial Identity Access Management (IAM) systems (also sometimes referred to as Identity and Authentication Management systems) are available to facilitate this process. Some commercially available IAM systems include: Novell, Oracle Identity Management (www.oracle.com/technetwork/middleware/id-mgmt/overview), Sun Identity Management (www.sun.com/software/index.jsp?cat=Identity%20Management&tab=3), and Tivoli Identity Manager (www.01.ibm.com/software/tivoli/products/identity-mgr). Other third-party identity solutions, such as Securonix Identity Matcher (www.Securonix.com) offers features of both a centralized directory and IAM by mining identity information from other IAMs and normalizing everything back to a common identity. 11 More sophisticated SIEM and Log Management systems might also provide identity correlation features to provide user normalization. Whatever method is used, by managing and controlling authentications to multiple systems via a centralized IAM, an authoritative source of identity is provided, as shown in Figure 9.2.
11.Securonix, Inc., Securonix Indentity Matcher: Overview. < http://www.securonix.com/identity.htm>, 2003 (cited: March 3, 2011).
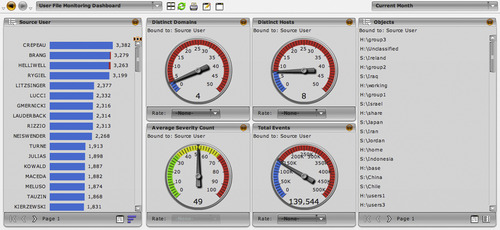
Once the necessary identity context has been obtained, it can be utilized in the information and event management process to cross-reference logs and events back to users. For example, in Figure 9.3, an SIEM dashboard shows both network and event details associated with their source users.
Additional Context
While user identity is one example of contextual information, there is a wealth of additional information available that can provide context. This information—such as vulnerability references, IP reputation lists, and threat directories, etc.—supplements the monitored logs and events with additional valuable context. Examples of contextual information are provided in Table 9.2.
Contextual information is always beneficial, as the more context is available for any specific event or group of events, the easier it will be to assess relevant to specific security and business policies. This is especially true because the logs and events being monitored often lack the details that are most relevant, such as usernames (see Figure 9.4). 12
12.A. Chuvakin, Content Aware SIEM. < http://www.sans.org/security-resources/idfaq/vlan.php> February, 2000 (cited: January 19, 2011).
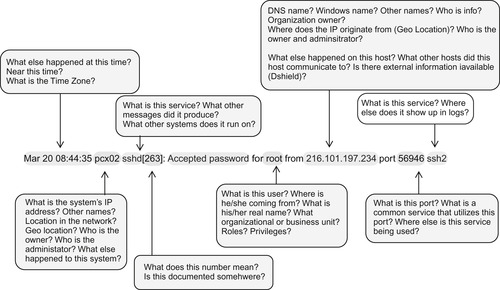 |
| Figure 9.4 Courtesy of Dr. Anton A. Chuvakin, Security Warrior Consulting. |
However, contextual information adds to the total volume of information already being assessed; as such, it is most useful when used to enrich other security information in an automated manner (see section “Information Management”).
Behavior
Behavior is not something that is directly monitored. Rather, it is the analysis of any monitored metric (obtained from a log, network flow, or other source) over time. The result is an indication of expected versus unexpected activity, which is extremely useful for a wide range of security functions, including anomaly based threat detection, as well as capacity or threshold-based alarming. Behavior is also a useful condition in security event correlation (see Chapter 8, “Exception, Anomaly, and Threat Detection”).
Behavior analysis is often provided by security log and event monitoring tools, such as Log Management systems, SIEMs, and Network Behavior Anomaly Detection (NBAD) systems. If the system used for the collection and monitoring of security information does not provide behavioral analysis, an external tool such as a spreadsheet or statistics program may be required.
Successfully Monitoring Enclaves
Understanding what to monitor is only the first step: actually monitoring all of the users, networks, applications, assets, and other activities still needs to happen. The discussion of what to monitor focused heavily on logs, as log files are designed to describe activities that have occurred, are fairly ubiquitous, and are well understood. However, log files are not always available, and they may not provide sufficient detail in some instances. Therefore, monitoring is typically performed using a combination of methods, including the following:
• Log collection and analysis
• Direct monitoring or network inspection
• Inferred monitoring via tangential systems
Except in pure log-collection environments, where logs are produced by the assets and network devices that are already in place, specialized tools are required to monitor the various network systems. In addition, the results of monitoring—by whatever means—need to be dealt with; while manual logs and event reviews are possible (and allowed by most compliance regulations), automated tools are available and are recommended.
However, the central analysis of monitored systems is contrary to a security model built upon functional isolation. That is, industrial networks should be separated into functional enclaves, and centralized monitoring requires that log and event data either remain within a functional group—limiting the value for overall situation awareness—or be shared between enclaves—potentially putting the security of the enclave at risk. In the first scenario, logs and events are not allowed across the enclave perimeter; they may be collected, retained, and analyzed only by local systems within that enclave. In the second scenario, special considerations must be made for the transportation of log and event data across enclave perimeters to prevent the introduction of a new inbound attack vector. A common method is to implement special security controls—either a data diode, unidirectional gateway, or a firewall configured to explicitly deny all inbound communications—to ensure that the security data is only allowed to flow toward the centralized management system. Especially in industrial networks where critical systems in remote areas need to operate reliably, a hybrid approach may be used: providing local security event and log collection and management so that the enclave can operate in total isolation, while also pushing security data to a central location to allow for more complete situational awareness across multiple enclaves.
Log Collection
Log collection is just that: the collection of logs from whatever sources produce them. This is often simply a matter of directing the log output to a log aggregation point, such as a network storage facility and/or a dedicated Log Management system. Directing a log is often as simple as directing the syslog to the IP address of the aggregator. In some cases, such as Windows WMI, events are stored locally within a database rather than as log files. These events must be retrieved, either directly (by authenticating to Windows and querying the event database) or indirectly (via a software agent such as Snare, which retrieves the events locally and then transmits them via standard syslog).
Direct Monitoring
Direct monitoring refers to the use of a probe or other device to examine network traffic or hosts directly. Direct monitoring is especially useful when the system being monitored does not produce logs natively (as is the case with many industrial network assets, such as RTUs, PLCs and IEDs). It is also useful as a verification of activity reported by logs, as log files can be altered deliberately in order to hide evidence of malicious activities. Common monitoring devices include Firewalls, Intrusion Detection Systems (IDSs), Database Activity Monitors (DAMs), Application Monitors, and Network Probes. These are often available commercially as software or appliances, or via open source distributions such as Snort (an IDS available at www.snort.org), Wireshark (a network sniffer and traffic analyzer available at www.wireshark.org), and the wireless sniffer Kismet (www.kismetwireless.net).
Often, network monitoring devices produce logs of their own, which are then collected for analysis along with other logs. Because the logs are produced without any direct interaction with the system being monitored, network monitoring devices are sometimes referred to as “passive logging” devices. Database Activity Monitors, for example, monitor database activity on the network—often on a span port or network tap. The DAM decodes network packets and then extracts relevant SQL transactions in order to produce logs. There is no need to enable logging on the database itself, and as a result there is no performance impact to the database servers.
In industrial networks, it is similarly possible to monitor industrial protocol use on the network, providing “passive logging” to those industrial control assets that do not support logging. Passive monitoring is especially important in these networks, as many industrial protocols operate in real time and are highly susceptible to network latency. This is one reason why it is difficult to deploy logging agents on the devices themselves (which would also complicate asset testing policies), making passive network logging an ideal solution.
In some instances, the device may use a proprietary log format or event streaming protocol that must be handled specially. For example, Cisco’s Security Device Event Exchange protocol (SDEE), used by most Cisco IPS products, requires a username and password in order to authenticate with the security device so that events can be retrieved on demand, and/or “pushed” via a subscription model. While the end result is the same, it is important to understand that syslog is not absolutely ubiquitous.
Inferred Monitoring
Inferred monitoring refers to situations where one system is monitored in order to infer information about another system. For example, many applications connect to a database; monitoring the database in lieu of the application itself will provide valuable information about how the application is being used, even if the application itself is not producing logs or being directly monitoring by an Application Monitor.
Note
Network-based monitoring inevitably leads to the question, “Is it possible to monitor encrypted network traffic?” Many industrial network regulations and guidelines recommend the encryption of control data … so how can this data be monitored via a network probe? There are a few options, each with benefits and weaknesses. The first is to monitor the sensitive network connection between the point of encryption and the traffic source. That is, encrypt network traffic externally using a network-based encryption appliance, and place the network probe immediately between the asset and the encryption. While effective, this does technically weaken the security of the network. The second option is to utilize a dedicated network-based decryption device, such as the Netronome SSL Inspector (www.sslinspector.com). These devices perform deliberate, hardware-based Man-in-the-Middle attacks in order to break encryption and analyze the network contents for security purposes. A third option is not to monitor the encrypted traffic at all, but rather to monitor for instances of data that should be encrypted (such as industrial protocol function codes) but are not—producing exception alerts indicating that sensitive traffic is not being encrypted.
To determine which tools are needed, start with your enclave perimeter and interior security controls (see Chapter 7, “Establishing Secure Enclaves”) and determine which can or cannot produce adequate monitoring. If they can, start by aggregating logs from the absolute perimeter (the demarcation between the least critical enclave and the Internet—typically the business enterprise LAN) to a central log aggregation tool (see the section “Information Collection and Management Tools”). Next, begin aggregating logs from those devices protecting the most critical enclaves, and work outward until all available monitoring has been enabled, or until the capacity of your log aggregation has become saturated. At this point, if there are remaining critical assets that are not being effectively monitored, it may be necessary to increase the capacity of the log aggregation system.
Tip
Adding capacity does not always mean buying larger, more expensive aggregation devices. Distribution is also an option: keep all log aggregation local within each enclave (or within groups of similar enclaves), and then aggregate subsets of each enclave to a central aggregation facility for centralized log analysis and reporting. While this type of event reduction will reduce the effectiveness of threat detection and will produce less comprehensive reports from the centralized system, all the necessary monitoring and log collection will remain intact within the enclaves themselves, where they can be accessed as needed.
If all logs are being collected and there are still critical assets that are not adequately monitored, it may be necessary to add additional network monitoring tools to compensate. This process is illustrated in Figure 9.5.
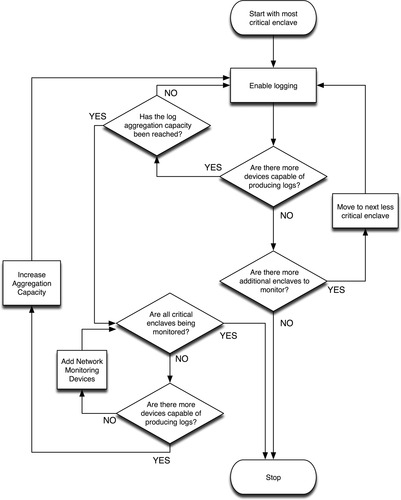
Additional monitoring tools could include any asset or network monitoring device, including host-based security agents, or external systems such as an Intrusion Detection System, an Application Monitor, or an Industrial Protocol Filter. Network-based monitoring tools are often easier to deploy, because they are by nature nonobtrusive—and, if configured to monitor a spanned or mirrored interface, do not incur latency.
Caution
Remember—when aggregating logs it is still necessary to respect the boundaries of all established enclaves. If logs need to be aggregated across enclaves (which is helpful for the detection of threats as they move between enclaves) make sure that the enclave perimeter is configured to only allow the movement of logs in one direction; otherwise, the perimeter will be compromised. In most instances, simply creating a policy that explicitly states the source (the device producing logs) and the destination (the log aggregation facility) for the specified service (e.g., syslog, port 514) is sufficient in order to enforce a restricted one-way transmission of the log files. For critical enclaves, physical separation using a data diode or unidirectional gateway may be required to assure that all log transmissions occur in one direction, and that there is no ability for malicious traffic to enter the secure enclave from the logging facility.
Information Collection and Management Tools (Log Management Systems, SIEMs)
The “log collection facility” is typically a Log Management system or a Security Information and Event Management (SIEM) system. These tools range from very simple to very complex and include free, open-source, and commercial options. Some options include Syslog Aggregation and Log Search, commercial Log Management systems, the Open Source Security Information Management (OSSIM) system, and commercial Security Information and Event Management systems.
Syslog Aggregation and Log Search
Syslog allows log files to be communicated over a network. By directing all syslog outputs from supported assets to a common network file system, a very simple and free log aggregation system can be established. While inexpensive (essentially free), this option provides little added value in terms of utilizing the collected logs for analysis, requiring the use of additional tools such as open source Log Search or IT Search tools, or through the use of a commercial Log Management System or SIEM. In addition, if logs are being collected for compliance purposes as well as for security monitoring, additional measures will need to be taken to comply with log retention requirements. These requirements include nonrepudiation and chain of custody, ensuring that files have not been altered, or accessed by unauthorized users. Again, this can be obtained without the help of commercial systems, although it does require additional effort by IT managers.
Log Management Systems
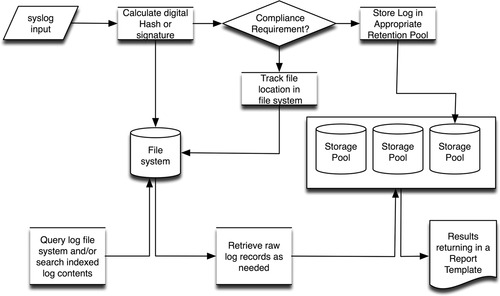
Log Management systems provide a commercial solution for log collection, analysis and reporting. Log Management systems provide a configuration interface to manage log collection, as well as options for the storage of logs—often allowing the administrator to configure log retention parameters by individual log source. At the time of collection, Log Management systems also provide the necessary nonrepudiation features to ensure the integrity of the log files, such as “signing” logs with a calculated hash that can be later compared to the files as a checksum. Once collected, the logs can then also be analyzed and searched, with the ability to produce pre-filtered reports in order to present log data relevant to a specific purpose or function—such as compliance reports, which produce log details specific to one or more regulatory compliance controls, as shown in Figure 9.6.
Security Information and Event Management Systems
Security Information and Event Management Systems, or SIEMs, extend the capabilities of Log Management systems with the addition of specific analytical and contextual functions. According to security analysts from Gartner, the differentiating quality of an SIEM is that it combines the log management and compliance reporting qualities of a Log Management or legacy Security Information Management (SIM) system with the real-time monitoring and incident management capabilities of a Security Event Manager (SEM). 13 Further, an SIEM must support “data capture from heterogeneous data sources, including network devices, security devices, security programs and servers,”14 making the qualifying SIEM an ideal platform for providing situational awareness across enclaves perimeters and interiors.
13.M. Nicolett, K.M. Kavanagh, Magic quadrant for security information and event management, Gartner Document ID Number: G00176034, May 13, 2010.
14.Ibid.
Many SIEM products are available, including the open source OSSIM project (www.sourceforge.net/projects/os-sim/), as well as several commercial SIEMs, competing across a variety of markets, and offering a variety of value-added features and specializations.
Because an SIEM is designed to support real-time monitoring and analytical functions, it will parse the contents of a log file at the time of collection, storing the parsed information in some sort of structured data store, typically a database or a specialized flat-file storage system. By parsing out common values, they are more readily available for analytics, helping to support the real-time goals of the SIEM, as shown in Figure 9.7. The parsed data are used for analytics, while raw log data are managed separately by a more traditional Log Management framework that will hash the logs and retain them for compliance. Because the raw log file may be needed for forensic analysis, a logical connection between the log file and the parsed event data is typically maintained within the data store.

SIEM platforms are often used in Security Operations Centers (SOCs), providing intelligence to security operators that can be used to detect and respond to security concerns. Typically, the SIEM will provide visual dashboards to simplify the large amounts of disparate data into a more human-readable form.
Data Historians
Data Historians are not security monitoring products, but they do monitor activity (see Chapter 5, “How Industrial Networks Operate”) and can be a useful supplement to security monitoring solutions in several ways, including the following:
• Providing visibility into control system assets that may not be visible to typical network monitoring tools
• Providing process efficiency and reliability data that can be useful for security analysis
Because most security monitoring tools are designed for enterprise network use, they are typically restricted to TCP/IP networks and therefore have no visibility into large portions of most industrial plants, which may utilize serial connectivity or other non-routable protocols. However, with many industrial protocols evolving to operate over Ethernet and/or over TCP/IP, these processes can be impacted by enterprise network activities. By using the operational data provided by a Historian, the security analysis capabilities of SIEM are made available to operational data, allowing threats that originate in IT environments but target OT systems (i.e., Stuxnet), to be more easily detected and tracked by security analysts. In addition, by exposing IT network metrics to operational processes, those activities that could impact the performance and reliability of industrial automations systems can be detected as well, for example, increased network flow activity, heightened latency, or other metrics that could impact the proper operation of industrial network protocols (see Chapter 4, “Industrial Network Protocols”).
Monitoring Across Secure Boundaries
As mentioned in the section “Successfully Monitoring Enclaves,” it is sometimes necessary to monitor systems across secure enclave boundaries. This requires enclave perimeter security policies that will allow the security logs and events generated by the monitoring device(s) to be transferred to a central management console. Data diodes are ideal for this application as they force the information flow in one direction—away from the secured enclaves and toward the central management system. If a firewall is used, any “hole” provided for logs and events represents a potential vector of attack; the configuration must therefore explicitly limit the communication from the originating source(s) to the destination management system, by IP and Port, with no allowed return communication path. Ideally, this communication would be encrypted as well, as the information transmitted could potentially be sensitive in nature.
Information Management
Having successfully collected the necessary information, the next step in security monitoring is to utilize the relevant security information that has been collected. Proper analysis of this information can provide the situational awareness necessary to detect incidents that could impact the safety and reliability of the industrial network.
Ideally, the SIEM or Log Manager will perform many underlying detection functions automatically—including normalization, data enrichment, and correlation (see Chapter 8, “Exception, Anomaly, and Threat Detection”)—providing the security analyst with the following types of information at their disposal:
• The raw log and event details obtained by monitoring relevant systems and services, normalized to a common taxonomy
• The larger “incidents” or more sophisticated threats derived from those raw events
• The associated necessary context to what has been both observed (raw events) and derived (correlated events)
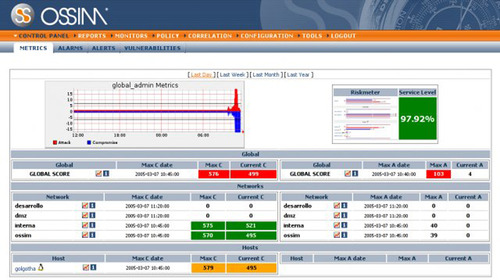
Typically, an SIEM will represent a high-level view of the available information in a dashboard or console, as illustrated in Figure 9.8, which shows the dashboard of the Open Source Security Information Management (OSSIM) platform. With this information in hand, automated and manual interaction with the information can occur. The information can be queried directly, to achieve direct answers to explicit questions; it can be formulated into a report to satisfy specific business, policy or compliance goals; it can be used to proactively or reactively notify a security or operations officer of an incident; and it can be used to further investigate incidents that have already occurred.
Queries
The term “query” refers to a request for information from the centralized data store. This can sometimes be an actual database query, using Structured Query Language (SQL), or may be a plain-text request to make the information more accessible by users without database administration skills (although these requests may use SQL queries internally, hidden from the user). Common examples of initial queries include the following:
• Top ten talkers (by total network bandwidth used)
• Top talkers (by unique connections or flows)
• Top events (by frequency)
• Top events (by severity)
• Top events over time
• Top applications in use
• Open ports
These requests can be made against any or all data that is available in the data store (see the section “Data Availability”). Queries can be focused by providing additional conditions or filters, providing results more relevant to a specific situation. For example:
• Top 10 talkers during nonbusiness hours
• Top talkers using specific industrial network protocols
• All events of a common type (e.g., user account changes)
• All events targeting a specific asset or assets (e.g., critical assets within a specific enclave)
• All ports and services used by a specific asset or assets
• Top applications in use within more than one enclave
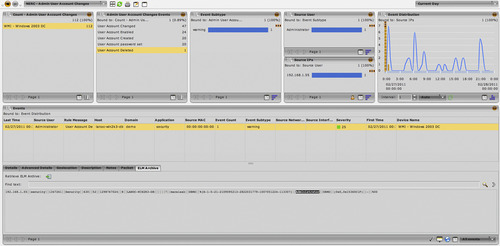
Query results can be returned in a number of ways: in delimited text files, via a graphical user interface or dashboard, via pre-formatted executive reports, via an alert that is delivered by text or e-mail, etc. Figure 9.9 shows user activity filtered by a specific event type—in this example, administrative account change activities that correspond with NERC compliance requirements.
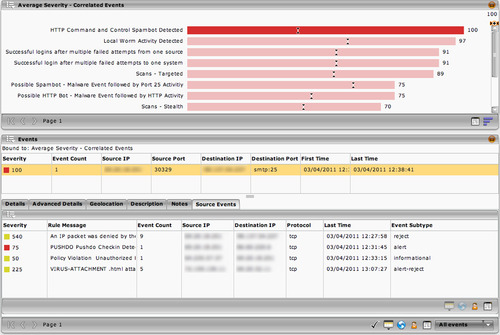
A defining function of an SIEM is to correlate events to find larger incidents (see Chapter 8, “Exception, Anomaly, and Threat Detection”). This includes the ability to both define correlation rules, as well as present the results via a dashboard. Figure 9.10 shows a graphical event correlation editor that allows the logical conditions (such as “if A and B then C”), while Figure 9.11 shows the result of an incident query: the selected incident (an HTTP Command and Control Spambot) being derived from four discrete events.

Reports
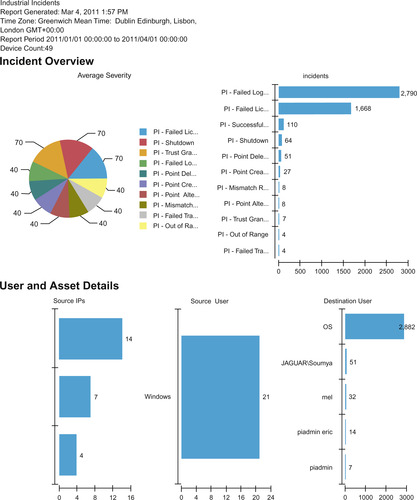
Reports select, organize, and format all relevant data from the enriched logs and events into a single document. Reports provide a useful means to present almost any data set: from a summary of high-level incidents for executives, to precise and comprehensive documentation that provides minute details for internal auditing or for compliance. An example of a report generated by an SIEM is shown in Figure 9.12, which provides a quick summary of PI authentication failures and point change activity.
Alerts
Alerts are active responses to observed conditions within the SIEM. An alert can be a visual notification in a console or dashboard, a direct communications (e-mail, page, text message, etc.) to a security administrator, or even the execution of a custom script. Common alert mechanisms used by commercial SIEMs include the following:
• Visual indicators (e.g., red, orange, yellow, green)
• Direct notification to a user or group of users
• Generation and delivery of a specific report(s) to a user or group of users
• Internal logging of alert activity for audit control
• Execution of a custom script or other external control
• Generation of a ticket in a compatible help desk or incident management system
Several compliance regulations, including NERC CIP, CFATS, and NRC RG 5.71, require that incidents are appropriately communicated to proper authorities inside and/or outside of the organization. By creating a useable variable or data dictionary with appropriate contacts within the SIEM, the alerting mechanism of an SIEM can facilitate this process by automatically generating appropriate reports and delivering them to key personnel.
Incident Investigation and Response
SIEM and Log Management systems are also useful for incident response, because the structure and normalization of the data allows an incident response team to drill into a specific event to find additional details (often down to the source log file contents and/or captured network packets), and to pivot on specific data fields to find other related activities. For example, if there is an incident that requires investigation and response, it can be examined, and relevant details such as the username, IP address, etc. can be quickly determined. The SIEM can then be queried to determine what other events are associated with the user, IP, etc.
In some cases the SIEM may support active response capabilities, including the following:
• Allowing direct control over switch or router interfaces via SNMP, to disable network interfaces
• Executing scripts to interact with devices within the network infrastructure, to re-route traffic, isolate users, etc.
• Execute scripts to interact with perimeter security devices (e.g., firewalls) to block subsequent traffic that has been discovered to be malicious
• Execute scripts to interact with directory or IAM systems to alter or disable a user account in response to observed malicious behavior
Caution
While automated response capabilities can improve efficiencies, they should be limited to noncritical enclaves and/or to enclave perimeters, and all automated responses should be carefully considered and tested prior to implementation. A false positive could trigger such a response and cause the failure of an industrial operation, with potentially serious consequences.
Log Storage and Retention
The end result of security monitoring, log collection, and enrichment is a large quantity of data in the form of log files, which must be stored for audit and compliance purposes (in the cases where direct monitoring is used in lieu of log collection, the monitoring device will still produce logs, which must still be retained). This represents a few challenges, including how to ensure the integrity of the stored files (a common requirement for compliance), how and where to store these files, and how they can be kept readily available for analysis.
Nonrepudiation
Nonrepudiation refers to the process of ensuring that a log file has not been tampered with, so that the original raw log file can be presented as evidence, without question of authenticity, within a court of law. This can be achieved in several ways, including digitally signing log files upon collection as a checksum, utilizing protected storage media, or the use of third-party FIM systems.
A digital signature is typically provided in the form of a hash algorithm that is calculated against the log file at the time of collection. The result of this calculation provides a checksum against which the files can be verified to ensure they have not been tampered with: if the file is altered in any way, the hash will calculate a different value and the log file will fail the integrity check; if the checksum matches, the log is known to be in its original form.
The use of appropriate storage facilities can ensure nonrepudiation as well. For example, by using Write Once Read Many (WORM) drives, raw log records can be accessed but not altered, as the write capability of the drive prevents additional saves. Many managed storage area network (SAN) systems also provide varying levels of authentication, encryption, and other safeguards.
An FIM may already be in use as part of the overall security monitoring infrastructure, as described in the section “Assets.” The FIM observes the log storage facility for any sign of changes or alterations, providing an added level of integrity validation.
Data Retention/Storage
The above security monitoring tools all require the collection and storage of security information. The amount of information that is typically required could easily surpass 170GB over an 8-hour period for a medium-sized enterprise collecting information at approximately 20,000 EPS. 15
15.J.M. Butler, Benchmarking Security Information Event Management (SIEM). The SANS Institute Analytics Program, February, 2009.
Data retention refers to the amount of information that is stored long term, and can be measured in volume (the size of the total collected logs in bytes) and time (the number of months or years that logs are stored for). The length of time a log is retained is important, as this metric is often defined by compliance regulations—for example, NERC CIP requires that logs are retained for anywhere from 90 days to up to 3 years, depending upon the nature of the log. 16 By determining which logs are needed for compliance and for how long they must be kept, the amount of physical storage space that is required can be calculated. Factors that should be considered include the following:
16.North American Electric Reliability Corporation. NERC CIP Reliability Standards, version 4. < http://www.nerc.com/page.php?cid=2|20> February 3, 2011 (cited: March 3, 2011).
• Identifying the quantity of inbound logs
• Determining the average log file size
• Determining the period of retention required for logs
• Determining the supported file compression ratios of the Log Management or SIEM platform being used
Table 9.3 illustrates how sustained log collection rates map to total log storage requirements over a retention period of 7 years, resulting in a few terabytes of storage up to hundreds of terabytes or even petabytes of storage.
Depending upon the nature of the organization, there may be a requirement to retain an audit trail for more than one standard or regulation, often with different retention requirements. As with NERC CIP, there may also be a change in the retention requirements depending upon the nature of the log, and whether an incident has occurred. All of this adds up to even greater, long-term storage requirements.
Tip
Because event rates can vary (especially during a security incident), make sure that the amount of available storage has sufficient headroom to accommodate spikes in event activity.
Data Availability
Data availability differs from retention, referring to the amount of data that is accessible for analysis. Also called “live” or “online” data, the total data availability determines how much information can be analyzed concurrently—again, in either volume (bytes and/or total number of events) or time. Data retention affects the ability of an SIEM to detect “low and slow” attacks (attacks that purposefully occur over a long time in order to evade detection), as well as to perform trend analysis and anomaly detection (which by definition requires a series of data over time; see Chapter 8, “Exception, Anomaly, and Threat Detection”).
Tip
In order to meet compliance standards, it may be necessary to produce a list of all network flows within an enclave that originated from outside of that enclave, for the past 3 years. For this query to be successful, 3 years of network flow data needs to be available to the SIEM at once. If the SIEM’s data availability is insufficient (for example, it can only keep 1 year of data active), there is a work-around: by archiving older data sets, the information can be stored in volumes consistent with the SIEM’s data availability. By querying the active data set, a partial result is obtained. By then restoring the next-previous backup or archive, two additional queries can be run, producing multiple partial result sets of 1 year each. These results can then be combined to obtain the required 3-year report. Note, however, that this requires extra effort on the part of the analyst. In addition, on some legacy SIEMs the archive/retrieval process may interfere with or interrupt the collection of new logs until the process is complete.
Unlike data retention, which is bound by the available volume of data storage (disk drive space), data availability is dependent upon the structured data that is used by the SIEM for analysis. Depending upon the nature of the data store, the total data availability of the system may be limited to a number of days, months, or years. Typically, databases are limited by one or more of the following:
• The total number of columns (indices or fields)
• The total number of rows (discreet records or events)
• The rate at which new information is inserted (i.e., collection rate)
• The rate at which query results are required (i.e., retrieval rates)
Depending upon the business and security drivers behind information security monitoring, it may be necessary to segment or distribute monitoring and analysis into zones to meet performance requirements. Some factors to consider when calculating the necessary data availability include the following:
• The total length of time over which data analysis may be required by compliance standards
• The estimated quantity of logs that may be collected in that time based on event estimates
• The incident response requirements of the organization: certain military or other critical installations may require rapid-response initiatives that necessitate fast data retrieval
• The desired granularity of the information that is kept available for analysis (i.e., are there many vs. few indices)
Summary
With enclave security measures in place, a larger picture of security-related activity begins to form. By measuring these activities and analyzing them, exceptions from the established security policies can be detected. In addition, anomalous activities can be identified so that they may be further investigated.
This requires well-defined policies and also requires that those policies are configured within an appropriate information analysis tool. Just as with perimeter defenses to the enclave, carefully built variables defining allowed assets, users, applications, and behaviors can be used to aid in detection of security risks and threats. If these lists can be determined dynamically, in response to observed activity within the network, the “whitelisting” of known-good policies, becomes “smart-listing”—which can help strengthen perimeter defenses through dynamic firewall configuration or IPS rule creation.
As various threat detection techniques are used together, the event information can be further analyzed by event correlation systems to find larger patterns that are more indicative of serious threats or incidents. Widely used in IT network security, event correlation is beginning to “cross the divide” into OT networks, at the heels of Stuxnet and other sophisticated threats that attempt to compromise industrial network systems via attached IT networks and services.
Everything—measured metrics, baseline analysis, and whitelists—all rely on a rich base of relevant security information. Where does this security information come from? The networks, assets, hosts, applications, protocols, users, and everything else that is logged or monitored contributes to the necessary base of data required to achieve “situational awareness” and effectively secure an industrial network.
..................Content has been hidden....................
You can't read the all page of ebook, please click here login for view all page.