
Chapter 8. Exception, Anomaly, and Threat Detection
Information in this Chapter:
• Exception Reporting
• Behavioral Anomaly Detection
• Behavioral Whitelisting
• Threat Detection
By defining enclaves, clear policies about what is allowed and what is not have already been obtained. In addition, the operation of each enclave should be well defined and relatively predictable. This supports two important types of behavioral analysis: exception reporting and anomaly detection.
Exception Reporting refers to an automated system that notifies the security administrator whenever a defined policy has been violated. In the context of enclave-based security, this means a notification that the defined enclave has been violated: some user, system, or service is interacting with the enclave in a way that is contrary to security policies established at the perimeter and/or within the enclave interior (see Chapter 7, “Establishing Secure Enclaves”). If we expect one behavior but see another, we can view this behavior as a potential threat and take action accordingly.
Anomaly Detection picks up where policy-based detection ends, by providing a “rule less” method of identifying possible threat behavior. Simply, anomaly detection takes action when something out of the ordinary happens. In an industrial system—especially if a strong defense-in-depth posture is maintained and enclaves are appropriately separated—the normal behavior can be determined, and variations in that behavior should be minimal. The operational behavior of an industrial network should be relatively predictable, making anomaly detection effective once all “normal” actions have been defined.
The effectiveness of anomaly detection pivots on that basic understanding of behavior, however. Understanding how baseline behavior can be measured is the first step to implementing a usable anomaly detection strategy.
Taken together, clearly defined policies and anomaly detection can provide an additional function: behavioral whitelisting. Behavioral whitelisting combines an understanding of what is known good/bad behavior (policies) with an understanding of expected behaviors, to define what is “known good behavior.” Just as whitelists of other known good elements (IP addresses, applications, users, etc.) can be used to enforce perimeter and interior enclave defenses, these higher level behavioral whitelists can help to deter broader threats, even across enclaves.
Although each method is effective on its own, attacks rarely occur in clear, direct paths (see Chapter 6“Vulnerability and Risk Assessment”). Therefore, to detect more sophisticated threats, all anomalies and exceptions need to be assessed together, along with the specific logs and events generated by network switches, routers, security appliances, and other devices. Event correlation looks across all systems to determine larger threat patterns that can more clearly identify a security incident. However, event correlation is only as good as the data that is available, requiring that all of the above detection techniques are used to generate a comprehensive base of relevant security information. It also requires proper monitoring of networks and devices, as discussed in the next chapter, “Monitoring Enclaves.”
Caution
Automated tools for the detection of exceptions, anomalies, and advanced threats are effective measures to help notify security analysts of incidents that may need to be addressed. However, no tool should be trusted completely; the experience and insight of a human analyst is a necessary component in the security monitoring and analysis process. While tools are often sold with the promise of being “an analyst in a box,” even the most well-tuned systems will still produce false positives and false negatives, therefore requiring the additional layer of human intellect to complete the assessment.
Exception Reporting
In Chapter 7 (“Establishing Secure Enclaves”), specific policies have been developed and enforced by firewalls, Intrusion Detection System/Intrusion Prevention System (IDS/IPS) devices, application monitors, and other security devices. Apart from the clear examples of when a specific firewall or IPS rule triggers an alert, these policies can be used to assess a variety of behaviors. Exception reporting looks at all behaviors, and unlike a hard policy defined at an enclave perimeter, which makes black-and-white decisions about what is good and bad, exception reporting can detect suspicious activities by compiling a wealth of seemingly benign security events.
This level of assessment could encompass any measurable function of an enclave (or enclaves), including network traffic patterns, user access, operational controls, etc. At a very basic level, exception reporting might be used to inform an operator when something that should not have been allowed (based on enclave perimeter policies) has occurred. The first example in Table 8.1 is an example of this: as it should not be possible for an inbound network communication to originate from an unrecognized IP address—that should have been prevented by the default Deny All firewall policy.
Other, less obvious uses for exception reporting are exemplified in the last example in Table 8.1, where two completely different detection methods (an application monitoring system and a log analysis system) indicate a policy exception that otherwise might seem benign; the function codes in question are only a concern if being executed by an authorized user.
Exception reporting can be automated using many log analysis or security information management systems, which are designed to look at information (typically log files) from many sources, and correlate this information together (for more information on how to generate this information, see Chapter 9, “Monitoring Enclaves”). Without an understanding of the policies that are in place, however, exceptions cannot be determined.
Behavioral Anomaly Detection
Sometimes, an exception might be seen in a network’s expected behavior, rather than in adherence to a policy. These anomalies can be detected by comparing monitored behavior against known “normal” values. This can be done in a variety of ways: manually, based on real-time monitoring; manually, via log review; automatically, using a Network Behavior Anomaly Detection (NBAD) product, Log Analysis, or Security Information and Event Management (SIEM) tool; or automatically, by exporting data to a dedicated spreadsheet or other statistical application. Whether performed manually or automatically, an anomaly cannot be detected without an established baseline of activity to compare against. Once a baseline has been established for a given metric (such as the volume of network traffic, the number of active users, etc.), that metric must be monitored using one or more of the methods described in Chapter 9, “Monitoring Enclaves.”
Measuring Baselines
Baselines are time-lagged calculations based on running averages. They provide a basis (base) for comparison against an expected value (line). Baselines are useful for comparing past behaviors to current behaviors, but can also be used to measure network or application capacity, or almost any other operational metric that can be tracked over time. A baseline should not be confused with a trend analysis—a baseline is a value: nothing more, nothing less. Using that metric in an analysis of past observed behavior and future predicted behavior is a trend analysis, a forward-looking application of known baselines to predict the continuation of observed trends.
A baseline can be simple or complex—anything from a gut understanding of how a system works to a sophisticated statistical calculation of hard, quantifiable data. The simplest method of establishing a baseline is to take all data collected over a period of time and use whatever metric is available to determine the average over time. This is a commonly used method that is useful in determining whether something is occurring above or below a fixed level. In Figure 8.1, for example, it can be clearly seen that production output is either above or below the average production level for the previous 12 months. The specific peaks and valleys could represent anything from a stalled process to normal variations in process schedules.
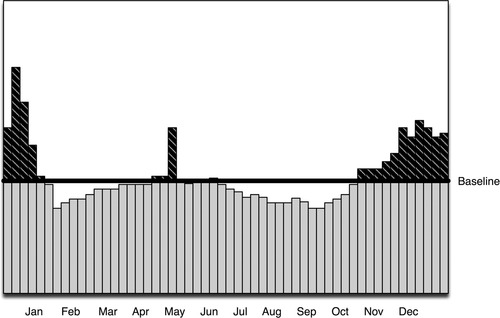
This may or may not be useful for operations management; in a security context, this type of baseline provides little value. Knowing that 59,421,102 events over 30 days=1,980,703 events per day average cannot tell us if the current day’s event volume of 2,000,000 is meaningful or not, without some additional context. Does the yearly average include weekends and other periods of downtime? If it does, the actual per day expected values of a workday could be considerably higher. For purposes of behavioral analysis, a more applicable method would be a similar calculation that excluded known periods of downtime and created a flat baseline that was more relevant to periods of operation. Better still are time-correlated baselines, where an observed period of activity is baselined against data samples taken over a series of similar time periods. That is, if looking at data for 1 week, the baseline might indicate the expected patterns of behavior over a period of several weeks. Figure 8.2 illustrates how this affects the flatline average with a curved baseline that visualizes a drop in activity during weekends and shows an expected peak on Thursdays.
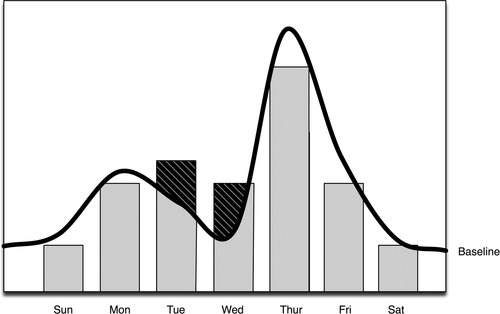
Time-correlated baselines are very useful because they provide a statistical analysis of observed activity within relevant contexts of time—essentially providing historical context to baseline averages. 1 Without such a baseline, a spike in activity on Thursday might be seen as an anomaly and spur an extensive security analysis, rather than being clearly indicated as normal behavior. Consider that there may be scheduled operations at the beginning of every month, at specific times of the day, or seasonally, all causing expected changes in event volumes.
1.F. Salo, Anomaly Detection Systems: Context Sensitive Analytics. NitroSecurity, Inc. Portsmouth, NH, December 2009.
Baselines, in whatever form, can be obtained in several ways, all beginning with the collection of relevant data over time, followed by statistical analysis of that data. Although statistical analysis of any metric can be performed manually, this function is often supported by the same product/system used to collect the metric, such as a Data Historian or an SIEM system (see Table 8.2 for examples).
Anomaly Detection
An anomaly is simply something that happens outside of normal parameters. Many firewalls and IDS/IPS devices may support anomaly detection directly, providing an additional detection capability at the enclave perimeter. Holistically, all behaviors can be assessed for more systematic anomalies indicative of larger threats. Luckily, having defined expected (baseline) behaviors anomalies can be easily identified. In addition, many automated systems—including NBAD, Log Management, and SIEM systems—are available to facilitate anomaly detection across a number of different sources.
Behavioral anomaly detection is useful because there is no dependency upon a detection signature, and therefore unknown threats or attacks can be identified. In addition, although often thought of exclusively in terms of network anomalies, any metric that is collected over time can be statistically analyzed and used for anomaly detection.
For example, an unexpected increase in network latency—measurable by easily obtained network metrics such as Transmission Control Protocol (TCP) errors, the size of the TCP receive window, the round-trip duration of a ping (TTL)—can indicate risk to the industrial network. 2 However, as can be seen in Table 8.3, anomalies can indicate normal, benign variations in behavior as well as potential threats. In other words, the rate of false positives tends to be higher using anomaly detection techniques.
2.B. Singer, Correlating Risk Events and Process Trends. Proceedings of the SCADA Security Scientific Symposium (S4). Kenexis Security Corporation and Digital Bond Press, Sunrise, FL, 2010.
Analyzing IT vs. OT Metrics
Up to this point, the discussion of anomaly detection has focused largely on security events derived from information technology (IT) tools. Even when looking at specialized security products for industrial network monitoring, these devices operate on the same paradigm as IT security devices to detect and block suspicious and/or “out of policy” events, and then generate an alert.
Anomaly Detection Tools
Anomaly detection can be done using anything from “gut feelings,” to manual statistical analysis using a spreadsheet or mathematical application, to specialized statistics software systems, to network and security data analysis systems such as certain Log Management and SIEM systems. Time-series databases, such as those used by Data Historians, can also be used for anomaly detection; while these systems do not typically represent anomalies within the specific context of network security, a Historian configured to show comparative overlays of security events over time could easily identify dangerous anomalies that might indicate a cyber attack.
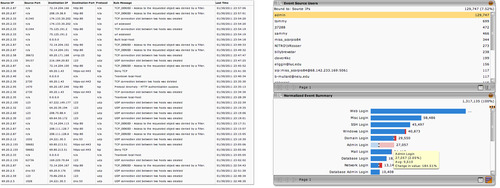
NBAD, Log Management, and SIEM tools are predominantly used for security-related anomaly detection. NBAD systems are focused exclusively on network activity and may or may not support the specific industrial network protocols used within a Supervisory Control and Data Acquisition (SCADA) or Distributed Control Systems (DCS) environment. As such, the use of a Log Management or an SIEM system may be better suited for anomaly detection in industrial networks. For example, Figure 8.3 shows a visual representation of anomalous authentication behavior for the admin user (on the right) versus the same data shown without context (on the left); the security tool has done the necessary statistical analysis to show a 184% increase in administrator logins and has also brought that anomaly to the attention of the security analyst.
As shown in Table 8.3, this requires that the Log Management or SIEM system is used to collect relevant data over time from those systems used in perimeter and interior enclave security, as well as any relevant network traffic data obtained from network switches and routers.
Tip
When selecting an analysis tool for industrial network anomaly detection, consider the greatest relevant time frame for analysis and ensure that the system is capable of automating anomaly detection over sufficient periods of time. Many systems, such as Log Management and SIEM systems, are not designed exclusively for anomaly detection and may have limitations as to how much information can be assessed and/or for how long.
To ensure the tool is right for the job, look at the operational lifespan of specific processes and use time-correlated baselines to determine normal activities for those processes. If a process takes 3 hours, analysis of n×3 hours of process data is needed for anomaly detection, where n represents the number of sampled operations. The greater the n, the more accurate the baseline, and therefore the more accurate the anomaly detection.
Behavioral Whitelisting
Whitelisting is well understood in the context of access control and application whitelisting (AWL) for host malware prevention. However, the concept of whitelisting has many roles within control system environments, where access, communication, processes, policies, and operations are well defined. Using the controlled nature of these systems and the enclave-based policies defined in Chapter 7, “Establishing Secure Enclaves,” whitelists can be defined for a variety of network and security metrics, including users, assets, applications, and others.
Whitelists can be actively enforced via a Deny !Whitelist policy on a firewall or IPS, or can be used throughout a network by combining network-wide monitoring and exception reporting with dynamic security controls. For example, if an exception is seen to a policy within an enclave, a script can be run to tighten the specific perimeter defenses of that enclave.
User Whitelists
Understanding user activity—especially of administrative users—is useful for detecting cyber attacks, both by insiders (e.g., a disgruntled employee) as well as by outside attackers. Locking critical functions to administrative personnel, and then following best practices of user authentication and access control, means that an attack against a critical system should have to originate from an administrative user account. In reality, enumeration is a standard process in a cyber attack because administrative accounts can be used for malicious intent (see Chapter 6, “Vulnerability and Risk Assessment”). They can be hijacked or used to escalate other rogue accounts in order to enable nonauthorized users’ administrator rights.
Fortunately, authorized users have been identified and documented (see Chapter 7, “Establishing Secure Enclaves”), and this allows us to whitelist user activities. As with any whitelist, the list of known users needs to be established and then compared to monitored activity. In this case, authorized users can be identified using a directory service or an Identity and Authentication Management (IAM) system, such as Lightweight Directory Access Protocol (LDAP), Microsoft Active Directory, or other commercial IAM systems from IBM, Oracle, Sun, and others.
As with exception reporting, the whitelist is first defined and then monitored activity is compared against it. If there is an exception, it becomes a clear indicator that something outside of established policies is occurring. In the case of a user whitelist, all known good user accounts are used as a detection filter against all login activity. If the user is on the list, nothing happens. If the user is not on the list, it is assumed bad and an alert is sent to security personnel. This accomplishes an immediate flag of all rogue accounts, default accounts, or other violations of the authentication policies. Consider Stuxnet, which uses a default (albeit hidden) set of authentication credentials to access a Programmable Logic Controller (PLC). Assuming that the operator was unaware of this account and had not explicitly defined it as a “known good” or whitelisted account, it could have triggered an exception, alerting cyber security officers of its existence.
NOTE
In the case of hidden accounts and hard-coded backdoor authentications, as used in Stuxnet, normal connections would also be flagged as an exception, because those accounts would most likely not appear on the whitelist. This could generate a potential excess of false-positive alerts. However, it would also draw attention to the existence of default authentications within the system so that these accounts could be more closely monitored. For example, the WinCC authentication could be monitored in conjunction with baseline analysis. If the default account was then used by malware, it would still be possible to detect the threat via anomaly detection.
Asset Whitelists
Once an inventory of cyber assets is completed—either automatically via an appropriate soft network scan (see Chapter 6, “Vulnerability and Risk Assessment”) or manual inventory—the resulting list of known, authorized devices can be used to whitelist known good network devices.
Again, unlike perimeter-based security policies which may only allow known good devices into an enclave, a network asset whitelist can be applied to devices within an enclave. If a spoofed address or rogue device appears within an enclave, it can still be detected via exception reporting against the list of known good devices so that action can be taken.
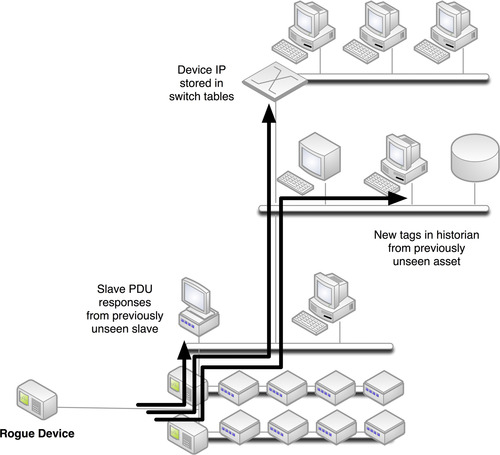
A classic use case for asset whitelisting is the use of mobile media, which can be carried past perimeter defenses and attached directly to a protected network, well within a secure enclave. This could be benign—an employee bringing an iPhone inside a control system that has WiFi enabled—or it could be a deliberate vehicle for sabotage. Either way, the IP address of the device will be detected by switches, routers, network monitors, and security devices, and will eventually be seen in logs or events that are centralized and managed, as illustrated in Figure 8.4. At this point, simple comparison against the defined whitelist will identify the presence of a nonauthorized device. This example represents significant risk, as the mobile device also connects directly to a 3G or 4G cellular network, which bypasses all defensive measures of the ESP, and opens the enclave up for attack or exploitation.
The whitelists themselves would need to be generated and applied to the central management system—most likely a Log Management or an SIEM system that is capable of looking at device metrics across the entire network. Depending upon the specific monitoring product used, the whitelist might be built through the use of a defined system variable (much like the generation of enclave-specific variables in firewalls and IDS/IPS devices, as discussed in Chapter 7, “Establishing Secure Enclaves”), configurable data dictionaries, manually scripted detection signatures, etc.
Application Behavior Whitelists
Applications themselves can be whitelisted per host using an AWL product. However, application behavior can also be whitelisted within the network. As with asset whitelisting, application behavior whitelists need to be defined so that good behavior can be differentiated from bad behavior. Like asset whitelists, application behavior whitelists can be utilized by a central monitoring and management system by defining a variable of some sort within a Log Management or an SIEM system. However, because of the nature of industrial network protocols, many application behaviors can be determined directly by monitoring those protocols and decoding them in order to determine the underlying function codes and commands being executed (see Chapter 4, “Industrial Network Protocols”). This allows for in-line whitelisting of industrial application behavior in addition to network-wide whitelisting offered by a Log Management or SIEM system. If in-line whitelisting is used, via an industrial security appliance or application monitor, network whitelisting may still be beneficial for assessing application behavior outside of industrial control systems (i.e., for enterprise applications and SCADA applications that do not utilize industrial protocols).
Some examples of application behavior whitelisting in industrial networks are as follows:
• Only read-only function codes are allowed.
• Master PDUs or Datagrams are only allowed from predefined assets.
• Only specifically defined function codes are allowed.
Some examples of application behavior whitelisting in enterprise networks are as follows:
• Only encoded HTTP web traffic is allowed and only on Port 443.
• Only POST commands are allowed for web form submissions.
• Human–Machine Interface (HMI) applications are only allowed on predefined hosts.
Some examples of application behavior whitelisting across both environments together are as follows:
• Write commands are only allowed in native fieldbus protocols and not over TCP/IP.
• HMI applications in supervisor networks are only allowed to use read functions over TCP/IP-based protocols.
In other words, unlike AWL systems, which only allow certain authorized applications to execute, application behavior whitelisting only allows applications that do execute to function in specifically defined ways on the network.
For example, an AWL system is installed on a Windows-based HMI. The AWL allows for the HMI application to execute, as well as a minimal set of necessary operating system services, and the networking services required to open Modbus network sockets so that the HMI can communicate to a series of RTUs and PLCs. However, the AWL does not control how the HMI application is used, and what commands and controls it can enforce on those RTUs and PLCs. The HMI, although protected by AWL, can be used by a disgruntled employee to shut down key systems, randomly change set points, or otherwise disrupt operations. Network-based application behavior whitelisting looks at how the HMI application is being used and compares that to a defined whitelist of authorized commands—in this case, a list of known good Modbus function codes. Functions that are not explicitly defined may then be actively blocked or they may be allowed but the system may generate an alert to notify administrators of the violated policy.
Industrial protocol or application monitoring tools should possess a base understanding of industrial protocols and their functions, allowing behavioral whitelists to be generated directly within the device. For network-wide behavioral whitelisting, variables or data dictionaries need to be defined. Common variables useful in application behavioral whitelisting include these same application function codes—the specific commands used by industrial protocols, ideally organized into clear categories (read, write, system commands, synchronization, etc.).
Examples of Beneficial Whitelists
Many whitelists can be derived using the functional groups defined in Chapter 7, “Establishing Secure Enclaves.”Table 8.4 identifies some common whitelists, and how those whitelists can be implemented and enforced.
Smart-Lists
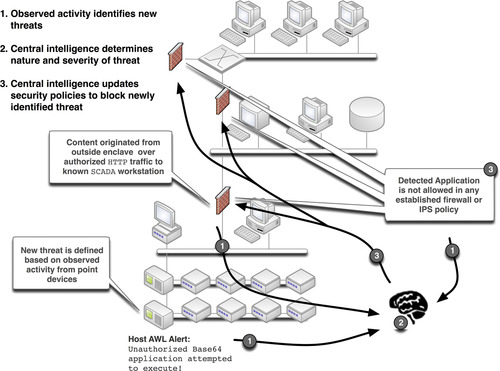
The term “Smart-Lists” was first introduced at the SANS Institute’s 2010 European SCADA and Process Control Summit in London, United Kingdom. “Smart-Listing” combines the concept of behavioral whitelisting with a degree of deductive intelligence. Where blacklists block what is known to be bad, and whitelists only allow what is known to be good, Smart-Lists use the latter to help dynamically define the former.
For example, if a critical asset is using AWL to prevent malicious code execution, the AWL software will generate an alert when a nonauthorized application attempts to execute. What can now be determined is that the application is not a known good application for that particular asset. However, it could be a valid application that is in use elsewhere, and has attempted to access this asset unintentionally. A quick correlation against other whitelists can then determine if the application under scrutiny is an acceptable application on other known assets. If it is, the “Smart-Listing” process might result in an informational alert and nothing more. However, if the application under scrutiny is not defined anywhere within the system as a known good application, the Smart-Listing process can deduce that it is malicious in nature, and define it within the system as a known bad application and proactively defend against it, by initiating a script or other active remediation mechanism to block that application wherever it might be detected.
“Smart-Listing” therefore combines what we know from established whitelists with deductive logic in order to dynamically adapt our blacklist security mechanisms (such as firewalls and IPS devices) to block newly occurring threats. This process is illustrated in Figure 8.5. First, an alert is generated that identifies a violation of an established policy; second, the nature of that alert is checked against other system-wide behavior; and finally a decision is made—if it is “bad” a script or other automation service may be used to dynamically update firewall, IDS/IPS, and other defenses so that they can actively block this activity. If not, the activity might generate an alert, or be ignored.
Smart-Listing is a relatively new concept which could greatly benefit enclave defenses by allowing them to automatically adapt to evasive attacks as well as insider attacks. Smart-Listing is especially compelling when used with overarching security management tools (see Chapter 9, “Monitoring Enclaves”) as it requires complex event association and correlation. Although it has yet to be determined how widely this technique will be adopted by security analysis and information management vendors, at present the techniques can be performed manually, using any number of Log Management or SIEM tools.
Threat Detection
Used independently, the specific detection techniques discussed up to this point—security device and application logs, network connections, specific alerts generated by exception reporting or anomaly detection, and violations of whitelists—provide valuable data points indicating events where a specific policy was violated. Even simple attacks, however, consist of multiple steps. For the detection of an incident (vs. a discrete event), it is, therefore, necessary to look at multiple events together and search for larger patterns. For example, many attacks will begin with a scanning technique, followed by an enumeration technique, followed by an attempt to successfully authenticate against an enumerated account. This pattern might equate to firewall alerts indicating a ping sweep, followed by access to an /etc/passwd, followed by a brute force login. The detection of this larger threat pattern is known as event correlation. As cyber attacks continue to increase in sophistication, event correlation methods have continued to expand, considering event data from a wider net of point security devices, additional event contexts such as user privileges or asset vulnerabilities, and searching for more complex patterns.
With Stuxnet, however, another factor was introduced that further complicated the event correlation process. Prior to Stuxnet, a threat had never before involved events from both IT and Operational Technology (OT) systems. With the evolution of threat patterns across both systems, the correlation of events across both IT and OT systems is also necessary. However, event correlation systems were not designed to accommodate OT systems, presenting challenges in the detection of the most serious threats to industrial networks.
Event Correlation
Event correlation simplifies the threat detection process by making sense of the massive amounts of discrete event data, analyzing it as a whole to find the important patterns and incidents that require immediate attention. Although early event correlation focused on the reduction of event volumes in order to simplify event management—often through filtering, compressing, or generalizing events3—newer techniques involve state logic to analyze event streams as they occur, performing pattern recognition to find indications of network issues, failures, attacks, intrusions, etc. 4 Event correlation is useful in several ways, including facilitating human security assessments by making the large volumes of event data from a wide variety of sources more suitable for human consumption and comprehension, by automatically detecting clear indications of known threat patterns to easily detect incidents of cyber attack and sabotage and by facilitating the human detection of unknown threat patterns through event normalization. The process of event correlation is depicted in Figure 8.6.
3.R. Kay, QuickStudy: event correlation. Computerworld.com< http://www.computerworld.com/s/article/83396/Event_Correlation?taxonomyId=016>, July 28, 2003 (cited: February 13, 2011).
4.Softpanorama, Event correlation technologies. < http://www.softpanorama.org/Admin/Event_correlation/>, January 10, 2002 (cited: February 13, 2011).
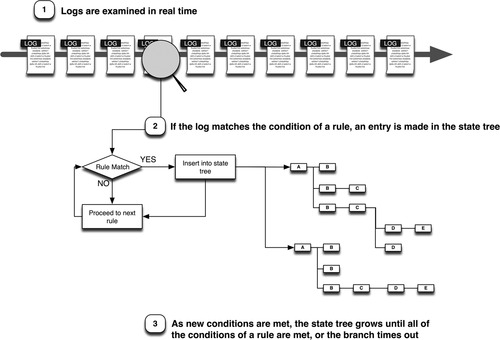
First, events are compared against a defined set of known threat patterns or “correlation rules.” If there is a match, an entry is made in a (typically) memory-resident state tree; if another sequence in the pattern is seen, the rule progresses until a complete match is determined. For example, if a log matches the first condition of a rule, a new entry is made in the state tree, indicating that the first condition of a rule has been met. As more logs are assessed, there may be a match for a subsequent condition of an existing branch, at which point that branch is extended. A log may meet more than one condition of more than one rule, creating large and complex state trees. For example, even a simple “brute force attack” rule can create several unique branches. Consider the rule
If [5 consecutive failed logins] from [the same source IP] to [the same destination IP] within [5 minutes]
This example would create one branch for the first failed login event “A” from any IP address to any other IP address. The next matching login event “B” would extend that initial branch while also generating a new branch (with a new timer):
The third matching login event “C” would extend the first two branches while also creating a third:
A+B+C
B+C
C
This will continue ad inifitum until all of the conditions are met, or until a branch’s timer expires. If a branch completes (i.e., all conditions are met), the rule triggers.
Note that events are collected from many types of information sources, such as firewalls, switches, authentication servers, etc. Therefore, before they can be effectively correlated they must be normalized into a common event taxonomy. Normalization categorizes activities into a common framework so that similar events can be correlated together even if the originating log or event formats differ. 5 Without normalization, many additional correlation rules would be required in order to check a condition (in this example a failed login) against all possible variations of that event that may be present (Windows logins, Linux logins, CMS application logins, etc.).
5.The MITRE Corporation, About CEE (common event expression). < http://cee.mitre.org/about.html>, May 27, 2010 (cited: February 13, 2011).
For purposes of threat detection, the entire event correlation process is typically performed in memory at the time individual logs and events are collected. However, correlation can also be performed manually by querying larger stores of already collected events to find similar patterns. 6
6.M. Leland, Zero-day correlation: building a taxonomy. NitroSecurity, Inc. < http://www.youtube.com/watch?v=Xtd0aXeLn1Y>, May 6, 2009 (cited: February 13, 2011).
Examples of event correlation rules are provided in Table 8.5. Event correlation may be very basic (e.g., a brute force attack) or highly complex—up to and including tiered correlation that consists of correlation rules within correlation rules (e.g., a brute force attack followed by a malware event).
Data Enrichment
Data enrichment refers to the process of appending or otherwise enhancing collected data with relevant context obtained from additional sources. For example, if a username is found within an application log, that username can be referenced against a central IAM system to obtain the user’s actual name, departmental roles, privileges, etc. This additional information “enriches” the original log with this context. Similarly, an IP address can be used to enrich a log file, referencing IP reputation servers to see if there is known threat activity associated with that IP address, or by referencing geolocation services to determine the physical location of the IP address by country, state, or postal code (see “Additional Context” in Chapter 9, “Monitoring Enclaves,” for more examples of contextual information).
Data enrichment can occur in two primary ways: the first is by performing a lookup at the time of collection and appending the contextual information into the log; the second is to perform a lookup at the time the event is scrutinized by the SIEM or Log Management system. Although both provide the relevant context, each has advantages and disadvantages. Appending the data at the time of collection provides the most accurate representation of context and prevents misrepresentations that may occur as the network environment changes. For example, if IP addresses are provided via the Dynamic Host Configuration Protocol (DHCP), the IP associated with a specific log could be different at the time of collection than at the time of analysis. However, although more accurate, this type of enrichment also burdens the analysis platform by increasing the amount of stored information. Also, it is important to ensure that the original log file is maintained for compliance purposes, requiring the system to replicate the original raw log records prior to enrichment. The alternative, providing the context at the time of analysis, removes these additional requirements at the cost of accuracy. Although there is no hard rule indicating how a particular product enriches the data that it collects, traditional Log Management platforms tend toward analytical enrichment, whereas SIEM platforms tend toward enrichment at the time of collection, possibly because most SIEM platforms already replicate log data for parsing and analysis, minimizing the additional burden associated with this type of enrichment.
Normalization
Event normalization is a classification system, which categorizes events according to a defined taxonomy, such as the Common Event Expression Framework provided by the MITRE Corporation. 7 Normalization is a necessary step in the correlation process, due to the lack of a common log format. 8 Consider a logon activity. Table 8.6 provides a comparison of authentication logs from a variety of sources.
7.The MITRE Corporation, About CEE (common event expression). < http://cee.mitre.org/about.html>, May 27, 2010 (cited: February 13, 2011).
8.A. Chuvakin, Content aware SIEM. < http://www.sans.org/security-resources/idfaq/vlan.php>, February 2000 (cited: January 19, 2011).
| aA. Chuvakin, Content aware SIEM. http://www.sans.org/security-resources/idfaq/vlan.php, February, 2000 (cited: January 19, 2011). | ||
| Log Source | Log Contents | Description |
|---|---|---|
| Juniper Firewall | <18> Dec 17 15:45:57 10.14.93.7 ns5xp: NetScreen device_id 5 ns5xp system-warning-00515: Admin User jdoe has logged on via Telnet from 10.14.98.55:39073 (2002-12-17 15:50:53) | Successful Logon |
| Cisco Router | <57> Dec 25 00:04:32:%SEC_LOGIN-5-LOGIN_SUCCESS:Login Success [user:jdoe] [Source:10.4.2.11] [localport:23] at 20:55:40 UTC Fri Feb 28 2006 | Successful Logon |
| Redhat Linux | <122> Mar 4 09:23:15 localhost sshd[27577]: Accepted password for jdoe from ::ffff:192.168.138.35 port 2895 ssh2 | Successful Logon |
| Windows | <13> Fri Mar 17 14:29:38 2006 680 Security SYSTEM User Failure Audit ENTERPRISE Account Logon Logon attempt by: MICROSOFT_AUTHENTICATION_PACKAGE_V1_0 Logon account: JDOE Source Workstation: ENTERPRISE Error Code: 0xC000006A 4574 | Successful Logon |
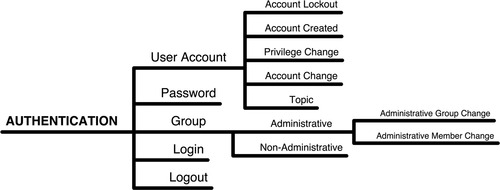
Although each example in Table 8.6 is a logon, the way the message is depicted varies sufficiently that without a compensating measure such as event normalization, a correlation rule looking for “logons” would need to explicitly define each known logon format. In contrast, event normalization provides the necessary categorization so that a rule can reference a “logon” and then successfully match against any variety of logons. Because this level of generalization may be too broad for the detection of specific threat patterns, most normalization taxonomies utilize a tiered categorization structure, as illustrated in Figure 8.7.
Cross-source Correlation
Cross-source correlation refers to the ability to extend correlation across multiple sources so that common events from disparate systems (such as a firewall and an IPS) may be normalized and correlated together. As correlation systems continue to mature, the availability of single-source correlation is dwindling. Cross-source correlation remains an important consideration of threat detection capability. The more types of information that can be correlated, the more effective the threat detection will be, and the fewer false positives, as shown in Table 8.7.
As more systems are monitored (see Chapter 9, “Monitoring Enclaves”), the potential for expanding cross-source correlation increases accordingly—ideally with all monitored information being normalized and correlated together.
Tiered Correlation
Tiered correlation is simply the use of one correlation rule within another correlation rule. For example, a brute force attempt on its own may be indicative of a cyber incident, or it may not. If it is a cyber attack, there is no further determination of what the attack is, nor its intent. By stacking correlation rules within other rules, additional rules can be enabled to target more specific attack scenarios, as shown in Table 8.8.
The third example in Table 8.8 illustrates the use of normalization within correlation by using a Malware Event as a general condition of the rule. The fourth example illustrates the value of content inspection for the purposes of threat detection by exposing application authentication parameters to the correlation engine.
Correlating between IT and OT Systems
Up until now, correlation has been discussed solely within the context of IT networks running standard enterprise systems and protocols. Operational systems must also be analyzed, however, requiring that metrics within the OT network be correlated to events in the IT network. The challenge here is the disparity of the two systems, and the information collection models used within each—IT systems are monitored heavily for performance and security using a wide range of available tools, whereas OT systems are monitored primarily for process efficiency and performance, using a more limited range of tools consisting of Data Historians, spreadsheets, and statistical modeling applications (see Chapter 9, “Monitoring Enclaves”).
However, even benign network behaviors of the IT network can impact operations, and threats do exist across both IT and OT systems. By correlating IT conditions against OT conditions, a good deal can be determined about potential cyber incidents. 9 For example, Table 8.9 shows several instances where IT systems can impact OT systems.
9.B. Singer, Correlating risk events and process trends. Proceedings of the SCADA Security Scientific Symposium (S4). Kenexis Security Corporation and Digital Bond Press, 2010, Sunrise, FL.
| aB. Singer, Correlating Risk Events and Process Trends. Proceedings of the SCADA Security Scientific Symposium (S4). Kenexis Security Corporation and Digital Bond Press., 2010. | |||
| Incident | IT Event | OT Event | Condition |
|---|---|---|---|
| Network instability | Increased Latency, measured by TCP errors, reduction of TCP receive windows, increased round-trip TTL, etc. | Reduction in Efficiency, measured by historical batch comparisons | Manifestation of network condition in operational processesDeliberate cyber sabotage |
| Operational change | No detected event | Change to operational set points, or other process change(s) | Benign process adjustmentUndetected cyber sabotage |
| Network breach | Detected threat or incident using event correlation, to determine successful penetration of IT system(s) | Change to operational set points, or other process change(s) | Benign process adjustmentUndetected cyber sabotage |
| Targeted Incident | Detected threat or incident directly targeting industrial SCADA or DCS systems connected to IT networks | Abnormal change to operational set points, unexpected PLC code writes, etc. | Potential “Stuxnet-class” cyber incident or sabotage |
Summary
With enclave security measures in place, a larger picture of security-related activity begins to form. By measuring these activities and analyzing them, exceptions from the established security policies can be detected. In addition, anomalous activities can be identified so that they may be further investigated.
This requires well-defined policies and also requires that those policies are configured within an appropriate information analysis tool. Just as with perimeter defenses to the enclave, carefully built variables defining allowed assets, users, applications, and behaviors can be used to aid in detection of security risks and threats. If these lists can be determined dynamically, in response to observed activity within the network, the “whitelisting” of known good policies becomes “Smart-Listing”—which can help strengthen perimeter defenses through dynamic firewall configuration or IPS rule creation.
As various threat detection techniques are used together, the event information can be further analyzed by event correlation systems to find larger patterns that are more indicative of serious threats or incidents. Widely used in IT network security, event correlation is beginning to “cross the divide” into OT networks, at the heels of Stuxnet and other sophisticated threats that attempt to compromise industrial network systems via attached IT networks and services.
Everything—measured metrics, baseline analysis, and whitelists—all rely on a rich base of relevant security information. Where does this security information come from?Chapter 9, “Monitoring Enclaves,” discusses what to monitor, and how, in order to obtain the necessary base of data required to achieve “situational awareness” and effectively secure an industrial network.
..................Content has been hidden....................
You can't read the all page of ebook, please click here login for view all page.