
Chapter 3: Table and Text Tips
Procedure-specific Table Features
Controlling Blank Lines in PROC PRINT
Creating Spanned Rows in PROC REPORT
Preventing Cell Merging in PROC TABULATE
Creating Tables with DATA _NULL_
Styling All Template-Based Tables at Once
Ad Hoc Tables with the Report Writing Interface
Generating Bulleted Lists and Blocks of Text
In this chapter, we review some tips to enhance table structures, create blocks of text, and generate bulleted lists. Some of these tips are really tips for the Base reporting procedures, but the options exist for enhancing ODS reports, so they seem fitting for a book such as this one.
Procedure-specific Table Features
All of the Base reporting procedures have their own sets of features for enhancing the table structure. A few of these features are demonstrated in the following sections.
Creating One-Shot Tables
Sometimes you want to create a table that is printed only one time and you already have a data set ready. You might go with PROC REPORT or PROC PRINT with this, but there is another alternative that might be useful if you want to create an arbitrary table header structure, or want to do something unusual, such as have more than one data value per cell.
These features are available if you use PROC ODSTABLE. PROC ODSTABLE is a thin wrapper around PROC TEMPLATE’s table syntax. The syntax within PROC ODSTABLE is the same as the table template syntax; it simply adds a DATA= option for you to pass in a data set to bind to the template.
We couldn’t possibly review the entire table template syntax in one tip, but we can review the basics and show how to create a custom table header structure beyond what you can do with PROC REPORT and PROC PRINT.
If you use PROC ODSTABLE without any statements or options, it acts much like PROC REPORT or PROC PRINT, in that it simply prints out all of the columns in the data set.
PROC ODSTABLE DATA=sashelp.class(OBS=3);
RUN;
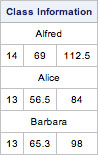
We can add our own custom headers using the header template syntax. Here is a report that includes a table header that spans the entire width of the table.
PROC ODSTABLE DATA=sashelp.class(OBS=3);
DEFINE HEADER header1;
TEXT 'Class Information';
END;
RUN;
Figure 3.1 shows the output from the above code.
Figure 3.1: PROC ODSTABLE output with table header

To create headers that span only certain columns, you use the START= and END= attributes in the header template. For example, if we wanted to create a header that only spanned from Age to Weight, we could extend our code above to get the following.
PROC ODSTABLE DATA=sashelp.class(OBS=3);
DEFINE HEADER header1;
TEXT 'Class Information';
END;
DEFINE HEADER header2;
TEXT 'Specifications';
START = Age END = Weight;
END;
RUN;
We would then get the output in Figure 3.2.
Figure 3.2: PROC ODSTABLE output with spanning header
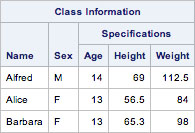
Notice that our headers introduced a gap, but ODS stretched out the Name and Sex headers to fill it in. You can put as many headers in as you wish. They will continue to stack on each other and fill in space as they accumulate. Using table headers and the START= and END= attributes, you can create whatever table header structures you want.
Controlling Blank Lines in PROC PRINT
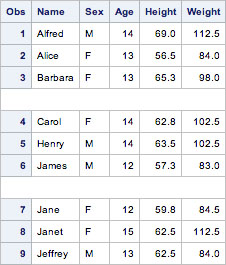
PROC PRINT can insert blank rows at a specified interval. This capability can make your report more readable by creating implied groupings within the table. In addition to inserting a blank row, you can also set style attributes on the blank row to emphasize it. When using this feature with destinations other than listing, the counter is reset after every BY group. Let’s start with a simple example of a blank line after every 3 rows.
PROC PRINT BLANKLINE=3 DATA=sashelp.class(OBS=9);
RUN;
Notice the BLANKLINE =3 in the code above. Figure 3.3 shows the output from that code.
Figure 3.3: PROC PRINT using the BLANKLINE= option
To apply a style to the blank lines, you use a syntax that looks more like data set options, using parentheses around a space-separated list of key-value pairs. The two keyword options are COUNT= and STYLE=. COUNT= is just an integer indicating the number of rows between each blank line. STYLE= is the same STYLE= option used to apply style elements and overrides on statements in templates and the reporting procedures. There aren’t a lot of style attributes that make sense in this context except for BACKGROUNDCOLOR. Here is an example that prints a blank line after every 3 rows and makes the background color of that row red.
PROC PRINT BLANKLINE=(COUNT=3
STYLE={BACKGROUNDCOLOR=RED})
DATA=sashelp.class(OBS=9);
RUN;
Figure 3.4 shows the output with colored rows.
Figure 3.4: PROC PRINT output using a styled BLANKLINE= option

Creating Spanned Rows in PROC REPORT
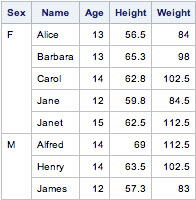
By default, PROC REPORT will blank out duplicate values in a group or order variable. This gives the appearance of row spanning in the listing output, but in other destinations that use table borders, the effect isn’t quite as nice. However, there is an option in PROC REPORT that allows you to merge those blanked cells so that they appear as a single table cell. This option is called SPANROWS. Using this option is quite simple. Here is an example.
PROC REPORT SPANROWS DATA=sashelp.class(OBS=8);
COL sex name age height weight;
DEFINE sex / ORDER;
RUN;
Figure 3.5 shows the output from the above code showing the spanned rows on the left side of the table.
Figure 3.5: PROC REPORT using the SPANROWS option
Preventing Cell Merging in PROC TABULATE
By default when PROC TABULATE has a class variable header on the left side of the table, it creates an additional row in the table that must be spanned by the first row data cells. This addition causes the first row data cells to be larger than those in the rest of the table. In many destinations, it also puts the actual data values effectively in the first data row with a blank data row below it (although it doesn’t appear this way visually because the renderer spans the cells and aligns the data value at the bottom).
One destination where this is particularly problematic is ExcelXP. Because the data values go into the first row, it can cause problems with formulas that reference cells. To work around this issue, PROC TABULATE has an option called NOCELLMERGE. This option causes the data cells in the first row to be blank and the data values to go into the second row without any row spanning effect.
Here is an example that uses the NOCELLMERGE option. The data cells are colored red to show that they no longer span the first two rows.
PROC TABULATE DATA=sashelp.class;
CLASS sex age;
TABLE sex*{style={backgroundcolor=red}} all, age
/ NOCELLMERGE;
RUN;
Figure 3.6 shows the output from this code.
Figure 3.6: PROC TABULATE using the NOCELLMERGE option

Creating Tables with DATA _NULL_
Many users are familiar with creating output by using DATA _NULL_ that isn’t quite ODS friendly. This involves using PUT statements to output ad-hoc data values. A more ODS-friendly way to create tables from the DATA step is to use the FILE PRINT ODS statement.
This statement is used in conjunction with a table template to create DATA step driven tables. We talked a little bit about table templates in “Creating One-Shot Tables”. There we used PROC ODSTABLE to create a table with arbitrary table headers. DATA step driven table templates have the advantage of being able to use logic within the DATA step to modify data values as the table is being rendered.
Here is the most basic use of DATA _NULL_ to render a table. First, a table template is created using PROC TEMPLATE. Then the DATA step uses that template in the FILE PRINT ODS statement to indicate what the table should look like.
PROC TEMPLATE;
DEFINE TABLE mytable;
END;
RUN;
DATA _NULL_;
SET sashelp.class(OBS=3);
FILE PRINT ODS=(TEMPLATE='mytable'),
PUT _ODS_;
RUN;
The code above generates a report that looks Figure 3.7.
Figure 3.7: Rendering a table template using DATA _NULL_

Since our table template is empty, it just uses all of the default settings. We can add headers to the table just as we did in “Creating One-Shot Tables”, but since we are in the DATA step, we are going to demonstrate an ability that you can only do in this context.
It’s possible to modify or generate data values in the DATA step as we are creating our table. This could include summarization, filling in missing values, adding blank lines, etc. The options really are limited only by your imagination, so long as they still fit within the column structure of the table. Here is an example that creates a summary row of the numeric columns in the data. Note that in this case, we also use the COLUMN statement to limit the columns being shown since we are using other variables in the DATA step that we don’t want displayed at each observation.
PROC TEMPLATE;
DEFINE TABLE mytable;
COLUMN name sex age height weight;
END;
RUN;
DATA _NULL_;
SET sashelp.class(OBS=3) END=last;
FILE PRINT ODS=(TEMPLATE='mytable'),
agetotal + age;
heighttotal + height;
weighttotal + weight;
PUT _ODS_;
IF last THEN DO;
PUT _ODS_ @1 'Total'
@2 ' '
@3 agetotal
@4 heighttotal
@5 weighttotal;
END;
RUN;
Figure 3.8 shows the output from the code above.
Figure 3.8: Creating a summary line in DATA _NULL_ while using a table template

Styling All Template-Based Tables at Once
There are times when it would be nice to be able to add something to all of the existing table templates at once. Probably the most common reason for this would be to create alternating color rows. It’s not difficult to do this for a single table template; the code for this is:
PROC TEMPLATE;
DEFINE TABLE mytable;
CELLSTYLE MOD(_ROW_,2) AS {BACKGROUNDCOLOR=WHITE},
1 AS {BACKGROUNDCOLOR=GRAY};
END;
RUN;
The CELLSTYLE-AS statement gets invoked for every data cell in the table. The _ROW_ variable is a built-in variable that increments for each row. The value after the AS is the style override to apply. Each comma-separated condition is tested until one is found to be true, then the style override is applied. Once a true condition is found, processing stops. The code above uses a simple trick at the end. A condition of 1 is used to make sure that the last condition is always true. This gives the effect of a default case.
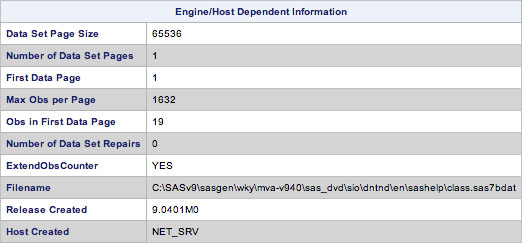
While this code works for our single table template, we want to do alternating colors on all template-based tables in SAS. To do this, we use a special template called Base.Template.Table. This table template is the parent of all table templates. It doesn’t exist by default, but if you define it, it will be automatically added to the parent chain of all table templates used by SAS. To define a Base.Template.Table that does alternating row colors, you would change “mytable” in the code above to Base.Template.Table as follows.
PROC TEMPLATE;
DEFINE TABLE Base.Template.Table;
CELLSTYLE MOD(_ROW_,2) AS {BACKGROUNDCOLOR=WHITE},
1 AS {BACKGROUNDCOLOR=VERY LIGHT GRAY};
END;
RUN;
With this template defined, all template-based tables (all non-PRINT, non-REPORT, non-TABULATE, and non-FREQ CROSSTABS) will have alternating row colors. Figure 3.9 shows the Engine/Host table of PROC CONTENTS.
Figure 3.9: Using Base.Template.Table to creating alternating row colors
It is possible to change other style attributes as well using the same technique. You can also change the condition to do different types of alternation or even make the condition dependent on the original style element name (_STYLE_).
Ad Hoc Tables with the Report Writing Interface
While using table templates and DATA _NULL_ can get you some fairly customized tables (as we have shown in previous tips), sometimes you really need total control over the table structure. The only way to do this is with the Report Writing Interface (RWI). This DATA-step-based interface is essentially a direct link into the ODS table building methods. You create the table, rows, and cells all on your own. Since you are responsible for doing the entire table structure, the code can get verbose, but it will allow you to do whatever you want. The primary table building methods are as follows:
/* Start and end a table */
obj.TABLE_START(args) and obj.TABLE_END(args)
/* Start and end a table head section */
obj.HEAD_START(args) and obj.HEAD_END(args)
/* Start and end a table body section */
obj.BODY_START(args) and obj.BODY_END(args)
/* Start and end a table foot section */
obj.FOOT_START(args) and obj.FOOT_END(args)
/ * Start and end a table row */
obj.ROW_START(args) and obj.ROW_END(args)
/* Create a table cell */
obj.FORMAT_CELL(args)
Each of these methods accepts a STYLE_ELEM and/or STYLE_ATTR arguments to specify the style element or style attributes to use for that item, respectively. The FORMAT_CELL method accepts a DATA argument that can be a string, number, or variable name. It also accepts COLUMN_SPAN and ROW_SPAN to specify how many columns or rows the cell should span. There are, of course, many more options to these methods that won’t be covered in this tip, but just these few options will take you a long way. Let’s look at an example.
DATA _NULL_;
SET sashelp.class(obs=3) end=last;
/* Do table start and header section
on first observation */
IF _N_ = 1 THEN DO;
/* Instantiate the odsout object */
DECLARE odsout obj();
/* Start table */
obj.TABLE_START();
obj.HEAD_START();
obj.ROW_START();
obj.FORMAT_CELL(
DATA: 'Class Information',
COLUMN_SPAN: 3
);
obj.ROW_END();
obj.HEAD_END();
obj.BODY_START();
END;
/* Create data rows */
obj.ROW_START();
/* Name cell spans whole table */
obj.FORMAT_CELL(
DATA: name,
COLUMN_SPAN: 3
);
obj.ROW_END();
obj.ROW_START();
/* Data cells */
obj.FORMAT_CELL(DATA: age);
obj.FORMAT_CELL(DATA: height);
obj.FORMAT_CELL(DATA: weight);
obj.ROW_END();
/* Close off the table at the last observation */
IF last THEN DO;
obj.BODY_END();
obj.TABLE_END();
END;
RUN;
Figure 3.10 shows the output from the sample above. As you can see, this method of building tables allows you to do pretty much whatever you want if you want to take the time to build the table cell-by-cell.
Figure 3.10: Output generated using the Report Writing Interface
Generating Bulleted Lists and Blocks of Text
A fairly recent addition to ODS is the ability to create bulleted lists and blocks of text. While you could create some text effects using titles, footnotes, or ODS TEXT, PROC ODSLIST and PROC ODSTEXT give you much more control over your text output.
Creating Bulleted Lists
Traditionally, ODS output has included only tables and graphics, but starting in SAS 9.3, you can also do blocks of text and bulleted lists. The next few tips will focus on these new output types. The simplest of them is bulleted lists created by PROC ODSLIST. The easiest (and probably most common) way to create a bulleted list is to make one that just uses static text. Here is a very simple list structure using static strings.
PROC ODSLIST;
ITEM 'Apples';
ITEM 'Oranges';
ITEM 'Bananas';
RUN;
The output for this list looks like the output in Figure 3.11.
Figure 3.11: PROC ODSLIST output

Each of the ITEM statements in PROC ODSLIST creates an item in the bulleted list. The argument to the ITEM statement is a SAS expression, so it can contain variable names as well as DATA step functions. In order to use variable names, we need a data set. Just like most other procedures, PROC ODSLIST has a DATA= option. Here is an example that uses a data set and more complex SAS expressions for the item content.
PROC ODSLIST DATA=sashelp.class(OBS=3);
ITEM name || ': ' ||
PUT(age, BEST.) || ' ' ||
PUT(height, BEST.) || ' ' ||
PUT(weight, BEST.);
RUN;
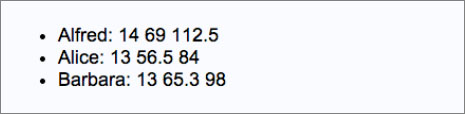
When using a data set with PROC ODSLIST, each observation in the data set causes the entire content of the PROC ODSLIST block to be rendered. So if you put more than one ITEM statement in the block, you will get that many items for each observation. Figure 3.12 shows the output from the example above.
Figure 3.12: PROC ODSLIST output using SAS expressions
Creating Nested Lists
In the last tip, we covered the basic use of bulleted lists. Nested lists can cause some confusion, so they get their own tip. The ITEM statement actually has two flavors depending on how it’s used. In the previous tip, the argument was a SAS expression and that was the end of the statement. In order to do nested lists, items need to be able to nest as well. This requires an ITEM statement that gets ended with an END statement. When using this type of item, there cannot be a SAS expression.
Basically, the rule is this: if the item has a SAS expression item block ends at that statement; if the item doesn’t have a SAS expression, the item ends with an END statement. This sounds more complicated than it really is, so let’s look at an example. We have already seen ITEM statements with a SAS expression (and no END statement), so let’s look at an item that does end with an END statement.
PROC ODSLIST;
ITEM;
P 'Apples';
P 'Oranges';
P 'Bananas';
END;
END;
Rather than creating three items, this code creates one item with three paragraphs in it. In order to nest lists, you would use an ITEM / END block, with a LIST / END block inside it. In almost every case, you should start your ITEM block with a P element to indicate that item’s content. If you don’t, you will end up with a bullet that has no text above the nested list. Here is the correct way to format a nested list.
PROC ODSLIST;
ITEM;
P 'Apples';
LIST;
ITEM 'Macintosh';
ITEM 'Braeburn';
ITEM 'Pink Lady';
END;
END;
ITEM 'Oranges';
ITEM 'Bananas';
RUN;
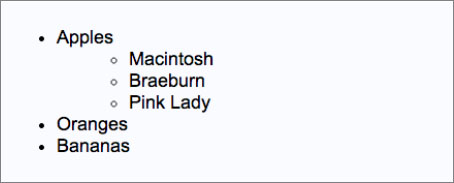
The output for this code looks like Figure 3.13.
Figure 3.13: Nested lists from PROC ODSLIST
Creating Blocks of Text
In addition to being able to do bulleted lists, you can also create combinations of paragraphs and lists called “text blocks.” This is the more common way of doing lists and text since it is more flexible than PROC ODSLIST. The simplest thing you can do in text blocks is a single paragraph of text using PROC ODSTEXT.
PROC ODSTEXT;
P 'A single paragraph of text.';
RUN;
You can, of course, do more than one paragraph in the same text block as well.
PROC ODSTEXT;
P 'The first paragraph of text.';
P 'The second paragraph of text.';
P 'The third paragraph of text.';
RUN;
Figure 3.14 shows the output from the code above.
Figure 3.14: Paragraphs of text created by PROC ODSTEXT

As we mentioned, lists can also be combined with paragraphs. The syntax for lists is the same as in PROC ODSLIST. Here is an example of using both paragraphs and lists.
PROC ODSTEXT;
P 'Apples';
LIST;
ITEM 'Macintosh';
ITEM 'Braeburn';
ITEM 'Pink Lady';
END;
P 'Oranges';
P 'Bananas';
RUN;
Just as with PROC ODSLIST, you can use a data set with PROC ODSTEXT. Again, the entire block of text will be produced for each observation. Here is a small example of using a data set.
PROC ODSTEXT DATA=sashelp.class(OBS=3);
P name || ': ' ||
PUT(age, BEST.) || ' ' ||
PUT(height, BEST.) || ' ' ||
PUT(weight, BEST.);
RUN;
The output from this code is shown in Figure 3.15.
Figure 3.15: PROC ODSTEXT output using a data set
