
Chapter 3. Working with the REST API
- Understanding the basics of the ArcGIS Server REST API
- Building custom widgets by using the REST API
- Using the Dojo loader
- Performing analysis with the geometry service
Chapter 2 covered examples of building simple mapping applications by using the ArcGIS API for JavaScript. These applications may not have been difficult, but they introduced core functions of the JavaScript API. One of the cool things about the API is that, like many other JavaScript libraries, it abstracts away some of the nitty-gritty work being done behind the curtain. Where does all that fancy mapping data come from? By looking at how the JavaScript API interacts with ArcGIS Server, you’ll have a better grasp of what it might take to build your own custom components that may not be provided in the ArcGIS API for JavaScript.
Various components are at play when working with the ArcGIS API for JavaScript, such as how you acquire the data that composes a map. The other key component is the ArcGIS Server REST API. REST stands for Representational State Transfer, which is a method of communication over the web that uses what is typically called an endpoint. An endpoint is a URL used as a reference to get data from ArcGIS Server. An endpoint could look like http://myservername/arcgis/rest/services/myservice?f=json. In this URL example, you’d be asking the REST API to provide information about the map service in JavaScript Object Notation (JSON) format, which I discuss later in this chapter.
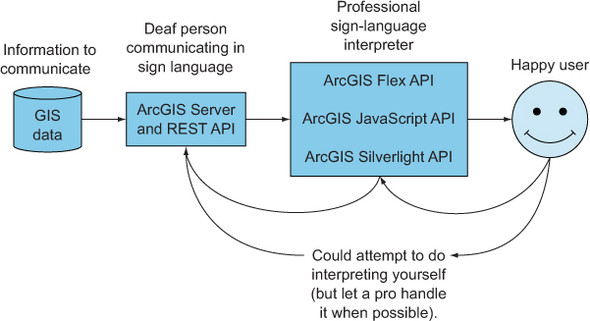
To get a better understanding of these components, consider an analogy of having a conversation with a deaf person through an interpreter. My sister is deaf and uses a service that enables her to make a video call to an interpreter through her television, using a webcam that looks like a bright, red, all-seeing eye. The interpreter routes her call to the intended recipient and relays the conversation by interpreting what my sister is saying in sign language to the person on the other end of the line. This method of communication works pretty well for all parties involved. Now, maybe you have sign language experience and could do much of the interpretation work yourself but aren’t as efficient at sign language as the professional interpreter. You could get the job done, but not as efficiently. You could think of the ArcGIS Server software as the deaf person; in this case, the information being communicated is GIS data. The ArcGIS Server REST API is analogous to sign language, being a specific form of communication provided by a URL endpoint. The ArcGIS API for JavaScript would then be the interpreter, relaying the information to us in a more efficient manner than if we tried to do it ourselves. This relationship is shown in figure 3.1.
Figure 3.1. Comparing ArcGIS components to sign-language interpretation

Figure 3.1 shows the source for all the fancy mapping data that ends up in your applications. To expose this data to a web browser, ArcGIS Server can view the details of the data and relay this data via the REST API in a format that’s easily digestible to the outside world. This data is communicated by a URL endpoint. The ArcGIS API for JavaScript is designed to take this structured information and allow us to work with it more easily than if we tried to do it on our own.
Although the ArcGIS API for JavaScript simplifies the process of working with GIS data, sometimes you’ll need to work directly with the ArcGIS Server REST API to perform a task that isn’t readily available in the API for JavaScript. In this chapter, you’re going to use the ArcGIS REST API to build a custom widget, take a closer look at how to use the Dojo loader, and use a neat utility of ArcGIS Server to perform geometric analyses.
3.1. Introducing the ArcGIS Server REST API
So far you’ve built examples of mapping applications by using the ArcGIS API for JavaScript. The purpose of these examples was to whet your appetite (or wet your feet) with the capabilities of the API. The API is like a giant toolbox at your disposal. It not only displays your geographic information on a map but also allows you to ask the map questions about that information. But what questions do you ask? What’s the population in this area? How large is the area? This information has to come from somewhere, and until now, you haven’t explored this part of the process in developing an application. The key is to become at least somewhat familiar with the ArcGIS Server REST API so you understand how to use the data in the services you’ll work with. In doing so, you’ll explore how features of the ArcGIS API for JavaScript work and how to customize these capabilities.
This section covers the following:
- How the ArcGIS REST API relates to the ArcGIS API for JavaScript
- Understanding how to read an ArcGIS Server page
- ArcGIS REST API legend endpoint and retrieving data
3.1.1. Exploring how the API works
The ArcGIS Server REST API is the foundation for the ArcGIS API for JavaScript. The technical details of how REST works aren’t important for this book, but you should know that, as shown in our example, the REST API is similar to a deaf person communicating in sign language to people who want access to the information. This scenario is how a web server communicates with a browser to deliver that information. In the case of ArcGIS Server, it’s how you can access spatial and attribute information from the server. Figure 3.2 illustrates a simplified model of the ArcGIS web stack and what functionality is available to you as a developer when communicating with ArcGIS Server. You can be the happy user who is receiving nicely and professionally translated data. Hopefully by now you realize that this book’s focus is the ArcGIS API for JavaScript and not the other available APIs, such as Flex or Silverlight, but I’ll remind you anyway to keep you on your toes.
Figure 3.2. Relationship of ArcGIS Server components to the user
The takeaway from figure 3.2 is that these web APIs are speaking the same language to ArcGIS Server via the REST API. So if you ever decide to undertake one of these other APIs in a future project, the basics are the same; you’re just working in a different programming language and development environment.
Having a common base to work from with the REST API can be advantageous to developers because you’ll know what to expect when working in any API. The workflow you choose depends on the tools you have available, whether the API is JavaScript or Silverlight.
REST uses four basic operations—create, read, update, and delete—referred to as CRUD functions. These functions operate on a few Hypertext Transfer Protocol (HTTP) methods; typically POST, GET, PUT, and DELETE. GET is what you could call a safe method, because it’s used only to retrieve information. The other methods potentially make a change. POST usually inserts data via REST, PUT performs updates, and DELETE removes information.
To learn more about these method definitions, refer to the W3C specification at www.w3.org/Protocols/rfc2616/rfc2616-sec9.html.
In theory, you could build your own JavaScript API to interact with the REST API and you’d get the same information, but only after more work on your part. But that doesn’t mean it isn’t useful to get a better understanding of how to work directly with ArcGIS Server. When you’re building your application, you’ll need a basic understanding of the data you’re working with. When working with ArcGIS Server, you can view details about the data directly in nicely formatted HTML pages. This same data is available in JSON used by the JavaScript API. JSON is a way of transferring data in web applications. It boils down to a set of key/value pairs, as shown in the following example:
{
 "name":"Chuck Finley",
 "occupations":["Secret Agent","Entrepreneur","Super Hero"]
}
The HTML pages provided with ArcGIS Server services are useful when you want to view details about the information being supplied by the ArcGIS Server REST API. You can view the documentation for the ArcGIS Server REST API at http://resources.arcgis.com/en/help/rest/apiref/index.html.
3.1.2. Interacting with ArcGIS Server pages
At the time of this writing, the ArcGIS Server REST API is at version 10.11. Let’s take a look at an ArcGIS Server service that provides census information. This is the type of information you need to become familiar with in a web service so you can build an application. The REST API provides HTML pages to give you easy access to web service information, as shown in figure 3.3.
Figure 3.3. Sample ArcGIS Server page
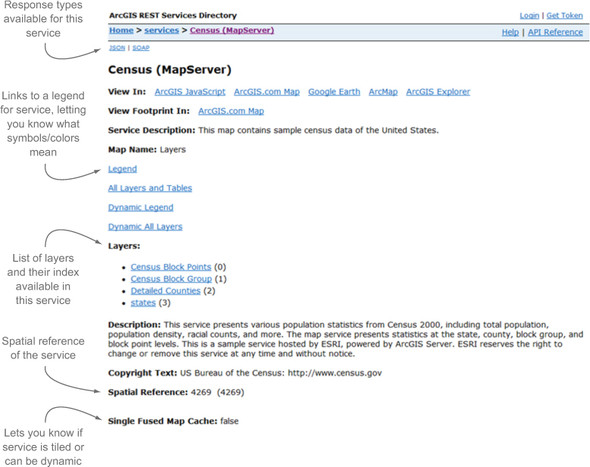
Let’s focus on a few items of this web service page:
- The list of Layers is vital because you’ll use these layer IDs when deciding which features are visible on the map and which layers you’ll want to query or use with the Identify tool covered in chapter 4.
- The Spatial Reference is important because, ideally, you want all your data to be in the same projection (showing how the earth is represented) for performance reasons.
- The REST API page lets you know whether the data in the service is Single Fused Map Cache, meaning that tiles for the map have already been generated ahead of time and can load quickly as a tiled service. Typically, this is done for aerial imagery or large datasets that don’t change often.
- The Legend link is something you’ll take a closer look at next to build a custom widget.
Using a legend in modern web mapping applications can sometimes be considered outdated. In a best-case scenario, your map data is cartographically designed so a legend is unnecessary, and the needs of your users can be met without it. But that’s a best-case scenario. At times, data requires a legend to better express the intent of the map and your application.
Legend Endpoint
The legend widget provided in the ArcGIS API for JavaScript interacts with the legend endpoint of the ArcGIS Server REST API. Remember, an endpoint is an exposed part of your interface in the REST API that’s used for communication. The legend endpoint contains information such as the names of items in the map service as well as how those items should be drawn in the map. This data can be represented in HTML format so that a user can easily review the data, or as a JSON representation that you can use with the ArcGIS API for JavaScript to make a custom widget. You can see what the JSON representation of the legend endpoint looks like in figure 3.4.
Figure 3.4. JSON representation of legend endpoint

This widget makes it easy to display symbols and their meanings. The census block points shown in figure 3.5 display the legend as shown in the ArcGIS Server pages and the legend displayed in an application using the out-of-the-box legend widget.
Figure 3.5. Legend graphics created by ArcGIS Server REST API (at left) and by legend widget (at right)

The out-of-the-box legend widget is a time-saver that accomplishes its task nicely. But suppose your application requires you to allow users to turn layer items on and off via a check box next to each legend item. This feature isn’t built into the legend widget of the ArcGIS API for JavaScript. You’ll need to build a custom solution. To do that, you’ll interact directly with the legend endpoint of the ArcGIS Server REST API and dig into the ArcGIS API for JavaScript to get the job done by using the built-in Dojo tools introduced in chapter 2.
The set of tools and widgets provided by the API are more than enough for a developer to build a suitable application that could meet most needs and requirements. But for those times when you’re challenged to meet a requirement that may have you digging through API documentation, scouring obscure blog postings, or reading through an abandoned mailing list for a solution, fret not; remember your tools and take a look in your toolbox. A widget in its simplest form is a chunk of portable code that can be used in any application. When working with the ArcGIS API for JavaScript, widgets usually involve a visual element of the page, such as the legend.
3.2. Building your own widget
To build your own legend widget with the added capability to turn layers on and off, you’ll use the built-in Dijit framework that comes standard as a part of Dojo. A Dijit in Dojo is a visual component, and in this case you’ll use the Dijit menu suite of components to make a menu-based legend table of contents. This will enable you to build a nice-looking legend widget, as shown in figure 3.6. The entire code base to build this widget can be a bit involved, but you’ll learn the main steps needed to accomplish your goals.
Figure 3.6. Custom legend widget built using Dojo Dijits

This section covers the following:
- Building the root menu of a legend widget
- Retrieving and using legend details from ArcGIS REST API
- Using methods to display legend items in a widget
Note
The code for the custom widget is available in the chapter3/legendtoc folder of the source code included with the book.
The purpose of this widget is to display legend information and allow users to turn items on and off in one place. The key to building this custom widget is interacting directly with the legend endpoint of the ArcGIS Server REST API. Accessing the legend endpoint from your application is easy, but building this custom widget requires a few steps.
3.2.1. Building the legend root menu
The first step is to build the root menu for a map service to add to the custom legend. To build the root menu, initialize a custom module called CheckedPopupMenuItem that displays the root element of a service:
startup: function (options) {
...
  serviceMenu = new CheckedPopupMenuItem({
                      label: layer.title,
                      layer: layer,
                      checked: layer.visible,
                      popup: layerMenu,
                      onChange: onServiceChecked
                  });
...
You initialize a custom CheckedPopupMenuItem widget that is composed of a CheckedMenuItem and PopupMenuItem from the Dijit library. This widget contains a title and a reference to the layer it represents. It will also contain a menu that displays each individual item in the layer as well as the ability to toggle the visibility of the whole service.
3.2.2. Retrieving legend details
The next step is to retrieve the detailed legend information about your map service. The key to building this custom widget is interacting directly with the legend endpoint of the ArcGIS Server REST API. Accessing the legend endpoint from your application is easy. You can use the built-in esri/request module to call the endpoint and return the results. This function returns a JavaScript promise. A promise returns the result of a task, in this case the request sent to the legend endpoint. After you have these results, the next couple of steps are where you need to apply a little bit of elbow grease. You need to send a request to the legend endpoint of the map service and then parse those results to make them useful for your widget:

You’ve created a request object by using the esriRequest() method. This request object is referred to as a promise. The promise pattern is used for handling asynchronous requests, such as needing to wait for a response from the server for the legend information. You can handle the response of this request by passing a function to esriRequest().then() and interacting with the legend results.
The result you get back from the legend endpoint has various pieces of information that will be useful in building your legend widget. I’ve omitted the url and imageData results to conserve space and truncated portions of the results to emphasize what a response from a legend endpoint looks like:

3.2.3. Displaying details in the custom legend widget
Your goal at this point is to turn these results into list items in your widget. You have a couple of options to display the symbols returned in the legend, mostly available to handle cross-browser capabilities:
- Image source URL— You can create a URL to the source image on the server, which uses a standard format to access the source image: http://<hostname>/arcgis/rest/services/<ServiceName>/MapServer/<layerid>/images/imageurl.
- Image data— The other option is to use the provided imageData, which is Base64-encoded image data that enables you to display the image without having to make a round-trip call to the server. This adds a bit of a performance increase. If you intend for your application to be used on a mobile device, the fewer calls to the server, the better.
Figure 3.7 shows a Chrome debug console, comparing the image source URL method and the imageData method.
Figure 3.7. Chrome debug console comparing the use of an image URL and Base64-encoded data
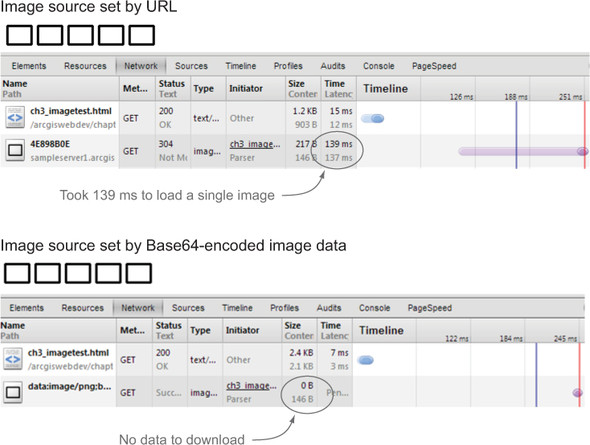
As shown in figure 3.7, using the image source URL method required sending a single request that took 139 milliseconds to load the image. You may display it ten times, but the browser is smart enough to know that it doesn’t need to make ten requests. Compare that to using the imageData method, and you can see that no requests were made to the server. Now, 139 milliseconds may not seem like much, but if lots of images need to be loaded for a legend and a request takes longer than usual, those small delays can add up and cause a noticeable difference to someone using the application.
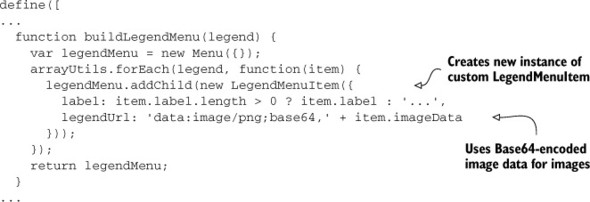
This imageData technique isn’t supported in older desktop browsers, but to avoid unnecessarily complicating the widget, you’ll use imageData to display legend symbols. You can do so by adding data:image/png;base64 to the beginning of the src attribute inside an image tag before you add the imageData string from the server:
<img src="data:image/png;base64,<imageData>" />
The next step is to build the subsequent item in your custom legend menu.
3.2.4. Working with multiple symbols in a feature
To find out whether any of your legend items have more than one set of symbols, such as the census block points shown previously in figure 3.6, you need to do a little more work. Part of the results you get back from a legend endpoint will include an array of legend symbols for each layer in the map service. You need to loop over the results of this array, which contain information such as the ID of the layer that you’ll use in the custom widget:

You use a helper function to build the legend menu items that don’t have check boxes but are symbols, like the census block points in figure 3.6:
Another alternative is to simply use the image URL from the legend service and let the browser cache the image to eliminate excessive requests to the server. That could be done by making one small adjustment, as shown in the following snippet:
legendMenu.addChild(new LegendMenuItem({
    legendUrl: item.url
}));
Both options are viable, and using image data or an image URL is a choice of which method will best suit your situation or need to optimize the number of requests sent to the server.
I hope you take away from this section that you can interact directly with the ArcGIS Server REST API to acquire information that may not be readily available with the ArcGIS API for JavaScript. This opens a whole new world of possibilities for presenting your data to the user, interacting with that data, and making a pleasant-looking application.
Next you’ll learn about using a special service in ArcGIS Server called the geometry service that can be used to perform spatial analyses in your application.
3.3. Working with the geometry service
Numerous types of services are available in ArcGIS Server, most of these representing spatial data, such as aerial imagery, streets, or points of interest. One that is not special data and may prove useful in everyday tasks is the geometry service. The geometry service is a suite of utilities provided in ArcGIS Server to perform general types of geometric analysis, such as creating a new feature based on a distance from a given point, or determining where two features intersect.
This section covers the following:
- Overview of the geometry service
- Turning points into buffered areas
- Using the buffer to make selections with the FeatureLayer
- Incorporating use of a proxy to make large requests
The geometry service can be useful in developing your applications, and the ArcGIS JavaScript API requires you to specify a geometry service to be used in some widgets before they can be implemented. These include the measurement widget, used to do measurements on the map, and the editor widget, which uses the geometry service for various tasks while editing. Figure 3.8 provides a sample of what the geometry service can do.
Figure 3.8. Types of tasks the geometry service can do
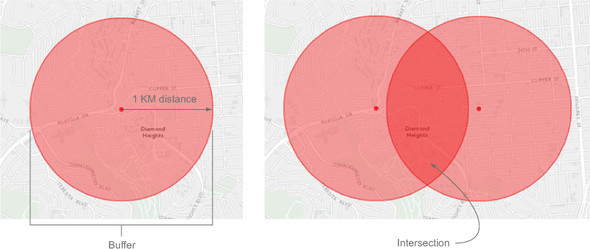
3.3.1. Buffer your heart out
Figure 3.8 shows a small sample of what the geometry service can do, but these operations are a good place for us to start our little adventure. One of the most widely used analyses when working with spatial data is the ever-popular buffer operation. You can imagine a buffer working the same as a compass. No, not the kind that tells you what direction you’re going in, but the kind that you probably used when you were in grade school to draw awesomely perfect circles. That’s what the buffer operation of the geometry service does: it draws circles around a particular point. As you can imagine, this could prove to be useful. Have you used an application on your phone to find nearby restaurants or movie theaters? Powering that search is a buffer operation to provide an answer based on your current location. Let’s experiment with buffer operations to see how easy it is.
Note
The source code for this section is available in the chapter3 folder of the source code included with the book. See chapter3/3.2.html and chapter3/3.2.js.
After loading your dependencies in your JavaScript, you create your map and geometry service task, as shown in the following listing. The application you build will create a buffer geometry based on where you click on the map.
Listing 3.1. Using GeometryService to buffer a location


The Draw toolbar module provided in the ArcGIS JavaScript API isn’t a visual toolbar per se, but it provides all the functionality you need to add points, lines, polygons, and more to the map. You could create your own toolbar with this functionality. It is a module designed to interact with the map.
When a button on the page is clicked, you allow the user to draw a point on the map. This can be done by listening for the drawPoint button to be clicked and activating the drawTool to specifically draw a point:
on(dom.byId('drawPoint'), 'click', function() {
  drawTool.activate(Draw.POINT);
});
You can then wait for the drawTool to send a draw-end event that triggers a function that will immediately deactivate the tool so the user can add only one point at a time:
drawTool.on('draw-end', function(e) {
    drawTool.deactivate();
...
When you click the Point button and then click the map, you see a result similar to figure 3.9.
Figure 3.9. The geometry service creates a buffer equal to one kilometer.
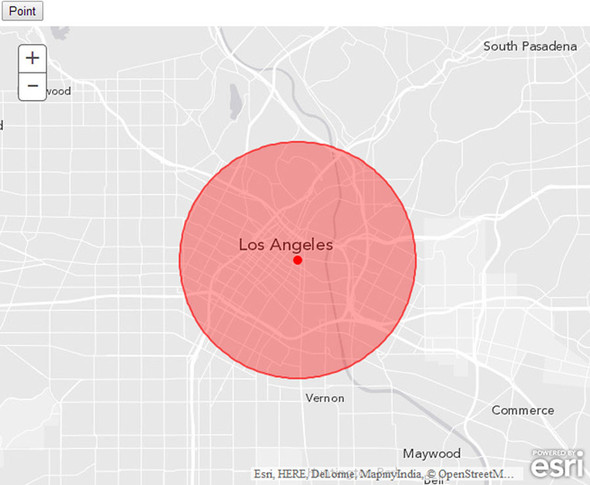
Look at that amazing buffered area. You’ve now mastered the ArcGIS JavaScript API in all its glory! All kidding aside, these are the first steps to more-interesting analyses you can do. Maybe you want information about what’s inside the buffered area you created. Maybe you’re interested in which census blocks are centered inside your buffered area. To do this, you could take advantage of our trusty old FeatureLayer.
3.3.2. Buffer and select
As you learned in chapter 2, a FeatureLayer enables you to add data to the map in different modes. You can use it to add data as needed, so when you first see the map, it downloads only the information in your current view. You can load the data all at once, which helps prevent more HTTP requests to the server during use of your application. This is best suited for small datasets, because anything more than a few hundred features may slow the startup of your application. The mode we’re most interested in at the moment is the ever-popular selection mode. When a FeatureLayer is first loaded, no features are immediately downloaded from the server. But you can perform queries directly against the FeatureLayer, and it’ll download and draw those features in the service that match the query. You could use a standard query, where you ask for ITEM = 'Yes', or you could pass in geometry, such as a line or polygon, to perform the selection. Do you see where this is going? You can initialize a new FeatureLayer right after you create the GeometryService:
featureLayer = new FeatureLayer(
  'http://sampleserver1.arcgisonline.com/ArcGIS/rest/services/' +
  'Demographics/ESRI_Census_USA/MapServer/1',
  {
    mode: FeatureLayer.MODE_SELECTION,
    outFields: ["*"]
}),
drawTool;
map.addLayer(featureLayer);
Then you add code during the iteration to add the buffered area that will set the geometries of the buffer and make the selection of items in the FeatureLayer using the buffers:
arrayUtils.forEach(geometries, function (geom) {
    map.graphics.add(new Graphic(geom, fill));
    var query = new Query();
    query.geometry = geom;
    featureLayer.selectFeatures(query, FeatureLayer.SELECTION_NEW);
});
If you run this code, something amazing happens! Actually, nothing happens at all. If you check your debug console window in Chrome or Firefox, you’ll probably see an error that looks like this:
esri.config.defaults.io.proxyUrl is not set
Too Many Characters in URL Request
Oh dear, we’ve run into the dreaded proxy issue. When you pass the geometry of the buffered area to do a spatial query on the FeatureLayer, that chunk of information is passed in the URL string, which has a limit of 2,048 characters. That buffered area looks like a nice circle, but it’s composed of many smaller line segments. The coordinates at the end and beginning of each line segment are being passed in the URL, and that’s a lot of coordinates. You can’t pass any more characters than that in a URL; the internet says you can’t.
Incorporate a Proxy Page
But the ArcGIS JavaScript API is smart enough to recognize this, and so it tries to use a proxy page to pass this information as a POST request, which isn’t subject to the same character limits. In the preceding message, the API is letting you know that you’re trying to perform a task that requires a proxy page. Please see appendix C for more details on setting up the proxy page.
So how do you use a proxy page inside the ArcGIS API for JavaScript? Once you set up the proxy page per the instructions in appendix C (I’ll assume you have the proxy in the root of your project), you can add this line of code just before you add the FeatureLayer to the map using the esri/config module aliased as esriConfig:
esriConfig.defaults.io.proxyUrl = 'proxy.ashx';
Note
For PHP or JSP, change the file extension as needed. Please review appendix C and its references for more details.
To better see your results, change the color of the buffer area. Run the project again and try adding a buffer; you should see something like figure 3.10.
Figure 3.10. FeatureLayer features selected from a buffer

As you can see, you were able to select only the census block centroids that are inside your buffered area. That’s a nifty analysis tool to have at your disposal. For fun, let’s add one more small analysis into this workflow.
3.3.3. Buffer and intersect
One analysis that you may run into during your time as a GIS professional is finding locations that are suitable for specific needs. Maybe you want to find a home that’s within a certain distance from your workplace and your favorite gym. You decide you don’t want to move any farther than a couple of kilometers between the two. Now, I don’t have home sales data to share with you, so we’re going to pretend that the census block centroids you’ve been working with are homes for sale. Bear with me; the process is what matters, not the data at the moment.
Modifying the Example to Prepare for Adding Intersection Capabilities
You can perform this analysis by adding a few lines of code to your application. First you initialize an empty array (geometryArray = []) to hold your buffer geometries near the top of your application. Then you slightly modify the portion where you loop over the returned buffer geometries. Here’s the code:
arrayUtils.forEach(geometries, function (geom) {
    geometryArray.push(geom);
    map.graphics.add(new Graphic(geom, fill));
});
if (geometryArray.length > 1) {
    intersectGeometries();
}
This snippet adds the buffered geometries to an array. It then checks if the array is not empty and calls another function that will intersect the geometries.
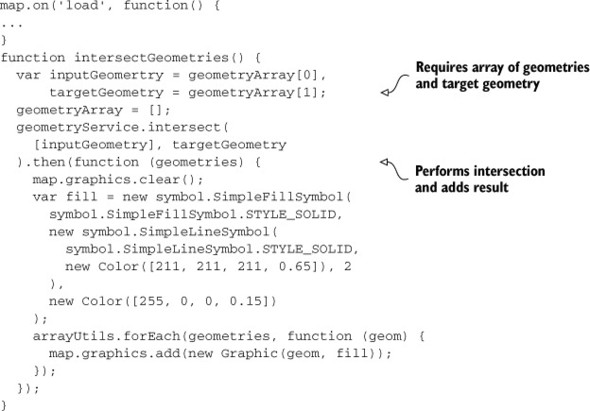
Adding new intersection functionality
Then you add a new function that will use the intersection method of your geometry task, as shown in the following listing.
Note
The code for this section is available in the chapter3 folder of the source code included with the book. See chapter3/3.2.js.
Listing 3.2. Intersecting buffered geometries
At this point, you return only the intersection of these two areas. You should see something similar to figure 3.11.
Figure 3.11. The geometry service displays an intersection of two areas.

You can see that the intersect method of the geometry service returns a geometry equal to the overlap of the two buffers you added to the map. Now you can use this geometry to perform a selection on your FeatureLayer as you did previously and see a result similar to figure 3.12.
Figure 3.12. Homes for sale in the intersected area
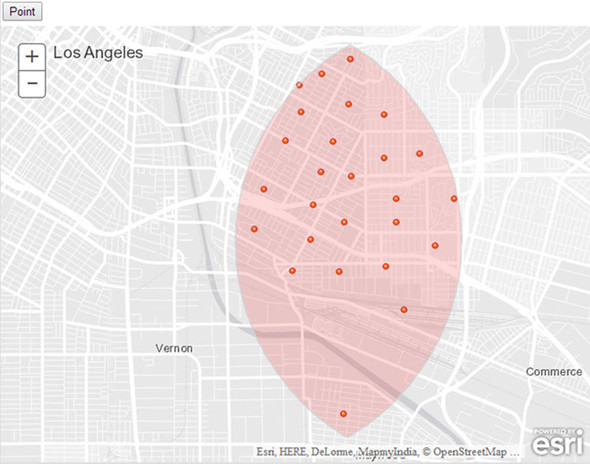
The FeatureLayer behaves precisely as expected and selects only homes within the intersection of your buffered areas. As I mentioned before, this is the groundwork for multiple types of analysis that you may want to perform in your application. The geometry service is a fantastic tool that helps you perform these types of geometric analyses.
3.4. Summary
- This chapter covered how to use the ArcGIS Server REST API directly to build a custom legend table-of-contents widget. In most cases, you won’t have to worry about working directly against the ArcGIS Server REST API, as almost everything you need can be accessed via the abstractions provided in the ArcGIS JavaScript API. But it’s a good idea to be familiar with the concepts if you’re ever required to try to work some magic using the ArcGIS REST API.
- You became more familiar with the Dojo loader, which makes your life easier as an ArcGIS JavaScript developer.
- You dived into the geometry service provided by ArcGIS Server. This is a handy suite of utility functions that offload geometric analyses to the server and can be used in a variety of ways in your application development. We only scratched the surface of the geometry service, and I encourage you to explore its other functions, such as CUT, GENERALIZE, and PROJECT, when you need to work in different coordinate systems.
Congratulations—you’ve now laid the groundwork to begin working on a full-blown application in chapter 4.