
Chapter 4. Building an application
This chapter covers
- Setting up an ArcGIS Online account
- Configuring Dojo for the ArcGIS API for JavaScript
- Styling your map to fit in the browser
- Building a Dojo class
- Using Bootstrap with the ArcGIS API for JavaScript
- Building a Dojo widget
At this point, you’ve seen a few examples that cover the basics of building a web mapping application by using the ArcGIS API for JavaScript. Some of the samples, like those in chapter 2, were intentionally introductory, to show you how simple it can be to get a web mapping application up and running. In chapter 3, you got more in depth, using parts of the ArcGIS API for JavaScript and Dojo to build a custom legend and table of contents widget, and you even took advantage of communicating directly with the ArcGIS Server REST API to do so. In this chapter, you’re going to build what could be a real-world application to deploy to your users or customers. This application will focus on the specific task of collecting data.
A popular item these days is a web application capable of being used on mobile devices. A browser-based web application is incredibly convenient for users and developers alike. Users don’t need to worry about having the right device, and developers can focus on building a better application without the overhead of building platform-specific versions or having to learn a new programming language. In this section, you’ll focus on building a web application that works on most mobile devices. I say most because, honestly, so many devices are available that I’m hesitant to say they all work the same, even in a browser environment. Small variances might occur when you tap your finger on an older Android device running the latest Android operating system, versus when you tap your finger on a brand-new Microsoft tablet using Internet Explorer. Nothing is perfect, but the tools in the ArcGIS API for JavaScript handle most compatibility issues for you under the hood, so you won’t need to be too concerned about them. We’ll discuss more about possible compatibility issues with HTML5 functionality later in the chapter and also in chapter 5.
This chapter covers the type of application you’re going to build and its goals. You’ll also learn how to register a free ArcGIS developer account so you can publish and edit data in ArcGIS Online. Then you’ll learn how to customize what that data looks like in your application, and finally how to incorporate Bootstrap styling into your application and start building what will eventually become a custom edit tool.
4.1. What are you going to build?
I’ve seen requests come across my inbox and have worked on a handful of applications that all seem to have one recurring theme: people want to collect data. This basic task is so popular that Esri even built a collector application that can be found at http://resources.arcgis.com/en/collector/. You’ll build a similar application to this one (see figure 4.1). These types of mobile web mapping applications can vary in terms of bells and whistles, but most are trying to collect information. If they’re not collecting information, they’re probably verifying it. Because data collection is at the heart of most GIS application building, learning how to build an application that does this from the ground up will teach you many of the important skills you’ll need for future application development. You’ll add functionality to this application in chapter 5, such as the ability to add features to the map and handle a loss of internet connection.
Figure 4.1. The application you’ll build in this chapter can work on a tablet and phone browsers.
The application in figure 4.1 may look simple at first glance, but it meets some specific requirements:
- Built for use on a tablet, but usable on a phone
- Can collect points at a user-specified location or by user’s current location
- Can perform limited editing without an internet connection
Let’s cover each of these requirements briefly.
4.1.1. Using a tablet or phone
If you’re building an app for general public use, it makes sense to ensure that it’s going to work on a phone. You don’t see many people walking around with tablets open, working with them. Or maybe you do; I won’t judge. The application you’re going to build will work on either phones or tablet devices, but let’s assume that your prospective users are city employees who have been issued tablets to collect data. That’s not to say you can’t take what you build and apply it to work on a phone as well, and in many cases, that will require little extra configuration on your part.
4.1.2. Collecting points
You want to provide users with the freedom to add locations to the map along with information. Say, for example, a user sees damage to a utility pole between some homes. The user can’t walk directly to the location to collect the point, so you’ll provide the ability to navigate a map and add a point with notes on what needs to be fixed. You’ll also provide the ability to add a location directly where the user is standing (say, on top of a damaged sidewalk). Chapter 5 covers this capability.
4.1.3. Performing disconnected editing
By far, the number one question anyone asks me when discussing a mobile mapping application, be it a web application or a native mobile application that requires installation, is whether will it work if they lose their internet connection. That’s a tricky question, so I mostly say that it depends. You can implement some functionality of HTML5, the latest version of HTML, to minimize the inconvenience of working without an internet connection. But the functionality will be limited, and I’d never fully rely on it. In particular with a web mapping application, if you have no internet connection, you can’t download new map tiles to show on the map, or make requests to the server to perform queries on data. You can, however, continue to collect data and save it locally until you have an internet connection, and then push your updates at that time. Chapter 5 covers saving data locally as a solution for disconnected editing.
These are all details covered as you build the application. Before you start writing any code, though, you need to set up a way to store the data that you collect, which you can do using ArcGIS Online.
4.2. Working with ArcGIS Online
Unless you work for a large organization or a company that provides GIS consulting services, you probably don’t have access to a full ArcGIS Server installation. That’s why I’ve tried to avoid details on the server side of ArcGIS development that aren’t necessary to cover the ArcGIS API for JavaScript. Maybe you’re wondering how you’ll get GIS data that you could edit for your application. That’s what’s discussed in this section.
This section covers the following:
- Understanding how ArcGIS Online differs from ArcGIS Server
- Registering for a developer account
- Creating a FeatureService
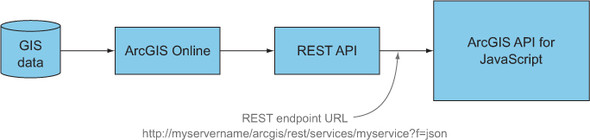
If you don’t have access to ArcGIS Server, no need to worry, because Esri provides a cloud-based GIS solution you can use to create and consume your own data for a web mapping application. Cloud-based indicates that the data resides on servers in a remote location, usually distributed across multiple machines. Using the cloud is a cost-effective way to host and share data and services. In this case, the platform is specifically designed to share GIS data and services. After the data is hosted, it works similarly to the regular ArcGIS Server, as discussed in chapter 3, with a couple of differences you’ll learn about shortly. In figure 4.2, you can see that ArcGIS Online can replace ArcGIS Server in this scenario.
Figure 4.2. ArcGIS Online can be used as a drop-in replacement for ArcGIS Server in some cases.
4.2.1. ArcGIS Online vs. ArcGIS Server
I mentioned that differences exist between ArcGIS Online and ArcGIS Server. In addition to being a cloud-based service, ArcGIS Online differs from ArcGIS Server in that it can’t host dynamic map services. As discussed in chapter 2, ArcGIS Online can host raster data, such as aerial imagery or other forms of data that don’t often change, such as parcels that can be served as tile services (since they are usually updated on an annual or semiannual basis). It can also host feature services that serve vector data, which are services with a single layer designed to work with a FeatureLayer. A FeatureLayer is well-suited for editing data and sharing vector data in an efficient manner. This is precisely the type of service you’ll create.
Esri provides developer subscriptions that allow you to use ArcGIS Online to test and build prototype applications and services at no cost. These subscriptions provide a limited number of credits that allow developers to do most of the work they need to do to build test projects. You can upgrade the developer subscription to a paid account at a later time. Full-featured, nondeveloper ArcGIS Online subscription costs can vary based on need and usage. These are called ArcGIS for Organization accounts. You’ll use the developer subscription for your sample application, which provides everything you’ll need.
4.2.2. Setting up an ArcGIS Online account
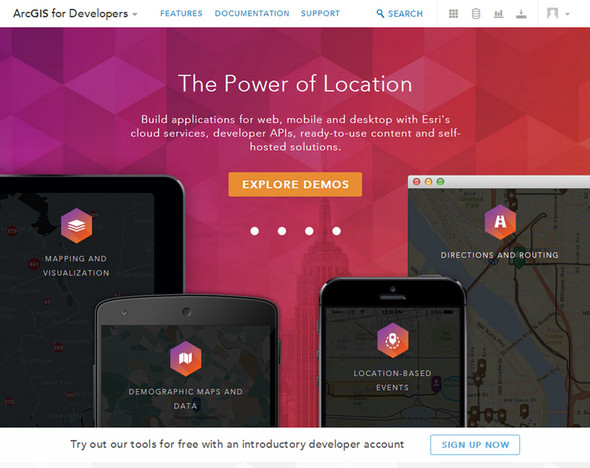
To get your developer subscription up and running, go to the ArcGIS for Developers site at https://developers.arcgis.com/en/. Click the Sign Up for Free link, shown in figure 4.3.
Figure 4.3. The main page for the ArcGIS for Developers site
After you click the link, you’ll be asked for your name and email address. Fill out this information, and you’ll be sent an email to finalize setting up your developer account. You can then log in to the developer page via the link provided in the email. When you first log in, you’ll see a page similar to figure 4.4.
Figure 4.4. The ArcGIS Online developer account page

4.2.3. Defining a feature service
Your developer account page provides an option to create an application. You’ll return to this page after you get your application started. You’ll also find links to documentation on the various web mapping APIs provided by Esri, including the ArcGIS API for JavaScript. At the moment, you want to focus on the Hosted Data link at the top of the page. Click this link to access the page shown in figure 4.5, to create a feature service for collecting data.
Figure 4.5. The page for creating a feature service from the ArcGIS for Developers site

Choosing the data you’re collecting
Before you dive in and start building a feature service, let’s think about the kind of information you want to collect. For this application, you’re collecting data on various problems that need the attention of your local city: for example, broken street lights and damaged sidewalks. So in this case, you want a type field of some sort. You also want to collect the date of the request you’re collecting, so you’ll have a date field. That sounds like a good start.
Click the Create a Feature Service button. You’re presented with the page shown in figure 4.6.
Figure 4.6. Creating a new feature service

I’ve already completed the following information, working from the top down:
- Title— Provides the title of your feature service.
- Description— Provides a basic description of your service.
- Geometry Type— Refers to whether the GIS data is a point, line, or polygon. You’ll use points because you’re concerned with collecting the location of a request at a single coordinate.
- Tags— Allows others to search for services with certain tags on ArcGIS Online, but only if the service is shared with everyone. Someone could search for data that’s tagged as Environmental or Water, for example. You’ll tag your service as request for testing purposes.
The next step is to add fields to your feature service.
Adding fields to your feature service
Click the Continue button, and you’re presented with the screen shown in figure 4.7. As before, I’ve already filled out the fields you’ll use. This page does a good job describing the meaning of each input.
Figure 4.7. Defining fields to be used in your feature service

Because ArcGIS Online still resides in a database, you need to abide by field-name constraints. You can’t use special characters such as @ or #, and you can’t use spaces. What you can do is add a field alias, which is a human-readable label for the data. In this case, you’ll have a field name of IssueType, and a field alias of Issue Type. Because the field name may be descriptive but not exactly user-friendly, you can use the screen-friendly descriptive field alias when the name is displayed in your application. This simplifies your work when you want to edit the data in your application.
One thing we haven’t discussed is that you’ll identify the data collected by what census tract it’s in. This probably isn’t something you’d typically collect in a real-world scenario, but it demonstrates how you can assign data by location. Normally, instead of a census tract, you might want to know, for example, what city a request is located in so that workers can be properly assigned. At a larger scale, you might want a city name when collecting data at a county level.
Review table 4.1 for details on defining the fields in your feature service.
Table 4.1. How to define fields in the feature service
|
Field alias |
Field name |
Data type |
Required |
|---|---|---|---|
| Issue Type | IssueType | String | True |
| Request Date | RequestDate | Date | True |
| Census Tract | TractName | String | False |
| Description | Description | String | False |
Choosing a renderer
After you click Continue on the Define Fields page, you’re presented with the option to choose a renderer for your feature service. A renderer shows what the features will look like in your application. Feel free to choose whatever you like; you can see what I chose in figure 4.8.
Figure 4.8. Choosing a renderer for your feature service

You’re almost finished setting up your feature service to use in your application. The last page shows an overview of the settings you chose, as shown in figure 4.9. A Rendering Preview window even provides a preview of what you might expect the map to look like. Click the Publish Service button to finish.
Figure 4.9. Review the settings of your feature service before you publish it.

4.2.4. Accessing your ArcGIS Online feature service
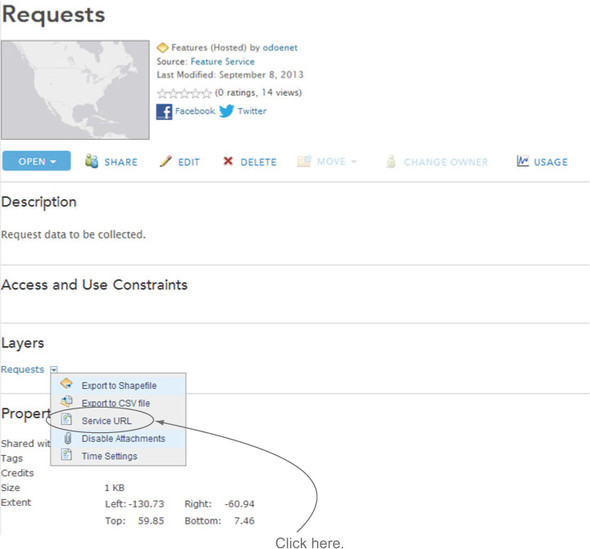
After you publish the service, you’re presented with a page that allows you to edit the service details. Click the View in ArcGIS Online button to access the ArcGIS Online page for your feature service. Under the Layers section, click the Requests link, and you’ll see the menu shown in figure 4.10. Choose the option Service URL.
Figure 4.10. ArcGIS Online page for your feature service
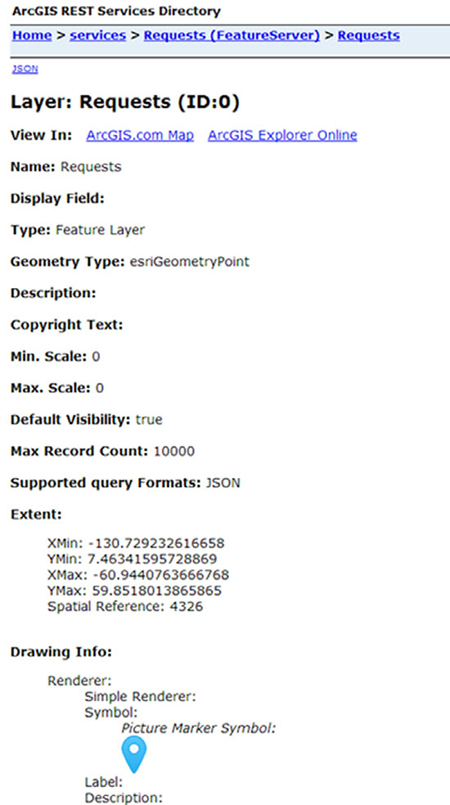
Navigating to the service URL opens a page similar to what you saw in chapter 3 when looking at the ArcGIS Server REST API pages. This page, shown in figure 4.11, provides information on this particular service, such as the Geometry Type, and what the default renderer looks like.
Figure 4.11. ArcGIS REST page for your ArcGIS Online hosted feature service
At this point, you’ve defined your feature service on ArcGIS Online by using a free ArcGIS for Developers account. The process is straightforward, and the end result looks similar to the services you were introduced to in chapters 2 and 3. The developer’s account is a big benefit for those who may not have access to the full ArcGIS Server and desktop installation required to build the database for the source data of their service and then publish it as a feature service. All of this can be an involved process, especially for prototyping an application.
4.3. Building a real-world application
Now that you’ve set up an ArcGIS Online account and built a feature service that you can use to collect data, let’s start the groundwork for building a mobile application. You’re going to cover quite a bit of ground in these next couple of sections, as listed here:
- Organizing your application folder structure
- Building the files and configuring Dojo
- Defining required modules to be used in your application
- Building JavaScript classes with Dojo
At the end of this chapter, you’ll have an application that looks similar to figure 4.12.
Figure 4.12. Your application will look like this at the end of this chapter.

4.3.1. Setting up Dojo and organizing modules
When diving into building an application, the last thing you might think of doing is laying out the folder structure of that application. Because the ArcGIS API for JavaScript is built using the Dojo Toolkit with its library of JavaScript tools, you need to take some considerations into account when starting to configure your application.
Organizing your application folder structure
How developers organize their folder structure varies depending on personal preferences and standards used in development teams. It can be completely subjective from one developer to the next, but I’m going to share with you some best practices to build your applications. This will help keep your modules organized by purpose—widgets separated from your services, and so on—making it much easier to locate the pieces you need. Figure 4.13 shows my recommended folder structure.
Figure 4.13. Recommended folder structure of an application

I’ve gone through variations of this folder structure over the years, and it may vary slightly from application to application. When building web applications with the ArcGIS API for JavaScript, I’ve found this works well, because I can keep my modules cleanly organized by purpose. Common modules that interact with outside web services can be kept in the services folder, and any custom widgets I build are kept in the widgets folder. Helper modules that may do basic tasks such as extract data from various GIS layers would be in a utils folder. After you’ve organized your file folders, you can move on to writing some code.
Building the files and configuring Dojo
The first file you’ll build is index.html, shown in listing 4.1. This file loads your style sheets, the ArcGIS API for JavaScript, and your run.js file that will get the application started. The index.html file also defines a couple of HTML elements you’ll reference in your application.
Note
The code for this chapter is available in the chapter4 folder of the source code included with the book.
Listing 4.1. Main index.html file

This index.html file is similar to what you’ve built in previous chapters for your samples. You’re specifying that you want to use the compact build of the ArcGIS API for JavaScript, which is a smaller build of the API, with fewer modules preloaded in the download. It includes most of the commonly used modules for building a web mapping application, and if you need more, it downloads the additional files as needed. I usually start an application by using the compact build, and if the application grows large enough that I’m downloading many additional files, I switch to using the regular build to cut down on network traffic, as discussed in chapter 3.
Before you dive into the JavaScript, I want to point out the main.css style sheet that helps define what your application looks like:
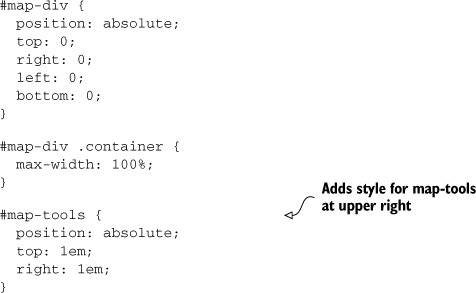
#map-div {
  position: absolute;
  top: 0;
  right: 0;
  left: 0;
  bottom: 0;
}
If you’re unfamiliar with how style sheets work, to style the HTML element with id of map-div, you can reference it as #map-div in your CSS file. To reference an element by class name, reference it by .class-name. In this case, you’d like the map element to take up the whole browser window, so you can provide it a position of absolute, meaning you can now specify that you want it to have 0 space along the top, right, left, and bottom of the browser.
Now you can see how to configure Dojo to work in a modular fashion in your application. The run.js file sets up a regular expression that ensures your modules are loaded correctly. A regular expression is a common method in programming for matching strings of text and finding patterns. You’ll use a regular expression to help you define the locations of modules. The configuration is shown in the following listing.
Listing 4.2. run.js and configuring Dojo
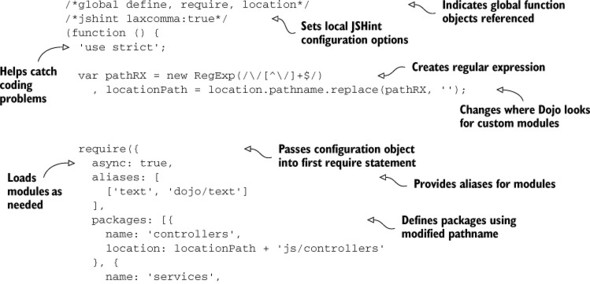
Quite a bit is happening in the run.js file in listing 4.2, starting with items that I would designate as good practice but that are entirely optional.
Using linting and strict mode
When writing JavaScript, it’s typically considered good practice to use some form of linting on your code. Linting is a process that often uses a preprocessing code checker, such as JSLint or JSHint, to check your code for anything suspicious (for example, accidentally creating global variables mixing the use of single quotes with double quotes). Linting can help filter out possible bugs in your code but mostly provides a nice, warm feeling for writing good code. I use JSHint, but you can use JSLint just as easily, or use nothing at all. You can find online linting tools at www.jshint.com. The following list explains common linting options and strict mode:
- The first line at the top of the file (/*global */) tells the lint tool that you’re using specific global variables in this module.
- The second line (/*jshint laxcomma:true*/) lets the linter know that you may be separating your lines with commas at the front as opposed to the end of a line. This is a completely subjective style, but it’s how I like to write JavaScript code.
- The next optional line is the 'use strict'; line. Similar to using a lint tool in your code, the 'use strict'; line places the function in strict mode. The function can capture some common JavaScript taboos such as writing to the global namespace (which isn’t that bad, but it’s good practice to avoid it), and can throw more exceptions when something like that happens.
Again, linting is purely subjective to individual developers. This is the last time I’ll show the linting and use strict-mode functionality in the book, but I wanted to point it out because it’s used in some of the source code provided with the book. You may need to avoid using strict mode when building custom widgets using the Dijit library, as it can cause issues with some of the core Dijit code. I use it mainly with nonwidget modules.
Using Dojo from a nonlocal source
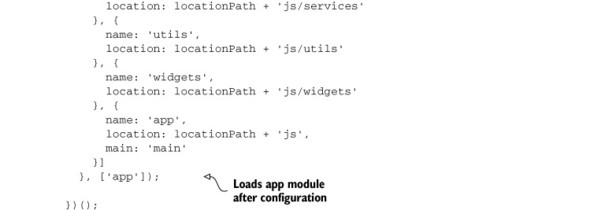
A lot of what’s happening inside run.js for the configuration of your application occurs because you don’t have access to a local copy of Dojo or the ArcGIS API for JavaScript. The API is provided by a content delivery network (CDN), which means the JavaScript for the API is hosted on another server somewhere. One side effect is that when you create a module by using the define method and provide it a path to a module you want to use, by default the API is going to look on the server for that module. This may seem confusing, but figure 4.14 shows how this might look.
Figure 4.14. Demonstrating how Dojo tries to load modules
To get around this issue, you can create a regular expression to replace the default hostname with your application’s hostname so the API can find the file correctly:
var pathRX = new RegExp(//[^/]+$/)
    , locationPath = location.pathname.replace(pathRX, ''),
You create a regular expression object called pathRX, which finds the application’s current pathname in the browser. The pathRX object looks at the URL for the application—for example, let’s say the URL is http://myserver/myapp, and the object matches the last portion of that URL as /myapp. In a browser environment, location is an object that can tell you information about the URL, and pathname will find the information for the current URL after the last forward slash (/) in the URL address. In this case, the result is /myapp. You can then use this little hack to define the location of the modules in your configuration. You can do this by defining a package’s array in the configuration:
{
      name: 'controllers',
      location: locationPath + 'js/controllers'
}
You can provide the package a name, such as controllers. You then let Dojo know that every time you want to load a module using the path controllers/modulename, Dojo should look in the location specified in the package. Because you’ve defined that location as /myapp/js/controllers, Dojo will try to look on the server the application is hosted on rather than the server that provides the ArcGIS API for JavaScript. You can even specify a package with a default file:
{
      name: 'app',
      location: locationPath + 'js',
      main: 'main'
}
In this case, you create a package called app, provide its location, and specify that app is a single file in a JavaScript file called main.js. You use this after you’ve specified the packages by calling the app module inside an array: ['app']. This will load the local js/main.js file after the configuration for Dojo has completed.
Setting up Dojo may seem like an involved process, but this same formula applies in every application you build, so you’ll become accustomed to it after a couple of times. It’s one of those activities that you perform once, and then you can reuse it with every new application, including the folder structure you already laid out.
Now that you’ve configured Dojo with the ArcGIS API for JavaScript to properly find custom modules, let’s see what happens next inside the main.js file.
4.3.2. Tying the application together
Remember that in your Dojo configuration you defined that the module named app would be mapped to the js/main.js file. In the configuration, you’re able to launch the js/main.js file by placing app in an array as the last argument in the configuration. It looks like this:
require({
  ...
  packages: [...]
}, ['app']);
The js/main.js file refers to a controllers/appcontroller module, which I’ll discuss shortly, and to a module called dojo/domReady, which is a plug-in for Dojo that says “Don’t run the code in this module until the browser has finished loading the page.”
Dojo also allows you to provide alias names for a module. In your Dojo configuration, you can alias the dojo/text plug-in as text. This plug-in loads HTML files as strings. You can execute a plug-in by placing an exclamation mark (!) after it to save you a few extra keystrokes. Inside the module, you refer to the instance of the controllers/appcontroller as appCtrl and call the init() method. Pass the method the string map-div, which represents the id of the HTML element you want the map displayed in, and an object with map parameters. You can see what that looks like in the following listing.
Listing 4.3. main.js–starting the application
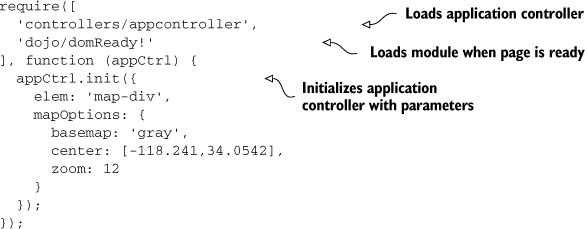
Working with the application controller
So far, you’ve built your application so the run.js file sets up the Dojo configuration for your application. The main.js file is used to set up any application-level configurations you may want to define ahead of time. This makes it easier for you to change these options in a single file. For example, in listing 4.3, you initialize the application controller with an object that provides the element name to use for the map and some default map options. This is the application configuration. You’ll add another item to this configuration object later in the chapter to add more layers to the application. As shown in listing 4.4, the purpose of the controllers/appcontroller.js file is to manage tasks at an application level, meaning it talks to any widgets that get loaded and handles some of the communication in the application (for example, what action the map should take when a widget is closed).
I prefer to handle map actions inside a custom map controller module, which is defined in controllers/mapcontroller.js (see listing 4.5). I’ve found that keeping this action separate makes maintenance easier. If I need to make changes, I can manage how the map is built in a single module.
Listing 4.4. controllers/appcontroller.js

At this point, the only responsibility the application controller has is to initialize the mapcontroller with the configuration file and load it. When it’s loaded, you’re returned a JavaScript promise like the ones discussed in chapter 3 when building the legend widget. When that load is complete, you send a message to the console to notify you that an action happened.
Loading the map with options
We need to cover one last module before you can see the fruits of your labor: the map controller that was mentioned in the preceding section. The controllers/mapcontroller loads the map with the specified options and uses a dojo/Deferred object to let you know when it’s complete. The map controller code is shown in the following listing.
Listing 4.5. controllers/mapcontroller.js

Using the declare module
The map controller may be only a few lines of code, but quite a bit is happening here, including new modules for us to cover. The first is the dojo/_base/declare module. The declare module is used in Dojo to generate JavaScript classes; you’ll become more familiar with it in chapter 5 when you start to build a custom edit widget. You use it to declare a new class that this module will provide. Technically, JavaScript doesn’t have classes, but declare can be used to create class-like constructors. As you can see, it’s aptly named. There’s no hard rule that states you must use the Dojo modules to generate JavaScript classes; you could use the prototype method to add methods to the class. The following snippet is roughly equivalent to what you do with the declare module:
var MapController = function(options) {
    this.options = options;
};
MapController.prototype.load = function() {};
The way I see it, when in Rome, do as the Romans do. You have a multitude of tools available in the Dojo Toolkit provided by the ArcGIS API for JavaScript; you may as well take advantage of them. When using a module built with declare, you can instantiate a new instance of that class by calling new MapController(options), and the first method that gets called is the constructor method. You typically pass in objects that will contain parameters for this module and then use
this.options = lang.mixin(this.options, options)
to copy the provided options to the options object. This saves the effort of writing the code to loop over the options object and copying the properties yourself.
Using the lang module
When you call the load method, a few things happen.
First you create a new Deferred object so you can use the Promises API in this module.
Next you create a new function, but you do so in an interesting way. You use the dojo/_base/lang module with a method called hitch. The purpose of this method is to resolve a deferred instance, meaning to return the result using map after it has been loaded. But the map is bound to the instance of the controllers/mapcontroller module, so the only way to access it is via this.map.
Because the function is being used as a handler function to an event on the map, that function doesn’t have access to this.map of the mapcontroller. Does that sound a little confusing? It might, as all this has to do with how the this keyword is handled in JavaScript, which is based on the context in which the function was called. In this case, the mapcontroller didn’t call the mapLoaded function, but it was triggered by the 'load' event of the map, so you need a way to get access to this.map inside mapLoaded. This is where lang.hitch comes in. This utility method binds the this keyword inside a function to any object passed as the first argument in lang.hitch:
mapLoaded = lang.hitch(this, function() {
            deferred.resolve(this.map);
          });
The utility method lang.hitch returns a function that binds the map controller instance to the function passed to it. This allows it to access this.map in the handler. You could also write this without lang.hitch:
var that = this;
mapLoaded = function() {
  deferred.resolve(that.map);
};
Doing it this way, you can bind an instance of the map controller to a variable called that and use that in the handler methods. But again, because you have all these tools available, you should use them when you can. It may help you later solve some mind-numbing problem you come across. If you were to launch your application now, you’d see a map in your browser, similar to the one shown in figure 4.15.
Figure 4.15. Result of the first draft of your web application

Hmm, if you’re thinking this looks an awful lot like the first samples you built in chapter 2 that used only a few lines of code compared to the multifile setup you just put together, you’re right. But the way you’ve structured the application now makes it easier to scale as new features are added. You’ve also worked with more of the Dojo modules. A few more steps are required to get the application looking like our goal for this chapter. In the next section, you’ll focus on making the application look good.
4.4. Adding layers and using the renderer
Previously in the chapter, I discussed how you’d capture the census tract number in which a request was placed, so you’re going to use a Census Tract map service and modify its appearance to fit the needs of the application.
This section covers the following:
- Using a custom renderer to display data
- Using Bootstrap with ArcGIS API for JavaScript
- Creating a custom widget to help with editing
4.4.1. Adding layers with a module
To accomplish this task, you’re going to create another module that creates instances of FeatureLayer to use in the map. The code for the services/mapservices module is shown in the following listing.
Listing 4.6. services/mapservices module

This module is pretty straightforward. Its only responsibility is to generate instances of new FeatureLayers and add them to an array that you can use to add them to the map.
Let’s return to the main.js file, where you built the configuration for your application, and modify it, as shown in the following listing.
Listing 4.7. main.js–modified with services/mapservices

You were able to easily modify the main.js file to add an array of layers that are generated by the services/mapservices.js module.
Now that you’ve modified the configuration, modify controllers/mapcontroller .js to load the layers in the map, as shown in the next listing.
Listing 4.8. controllers/mapcontroller.js–modified to add layers
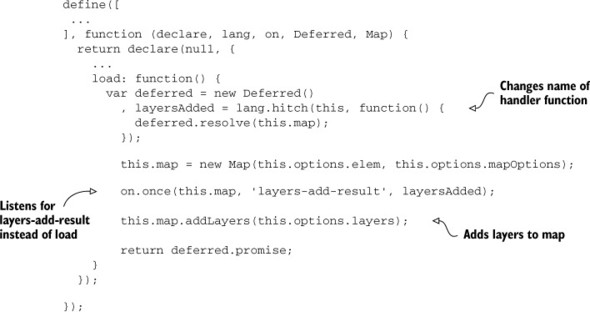
All you need to do to the mapcontroller is modify it slightly so that instead of listening for the 'load' event to occur, you listen for the 'layers-add-result' event, which fires when the layers you add by using map.addLayers() are loaded. This method takes an array of layers, which coincidentally happens to be what you have in the options of the mapcontroller. Remember, the mapcontroller is passed the configuration object (defined in main.js) and binds those values to its own option property. Because you’re no longer listening for the map to load, but for when the added layers are loaded, change the handler’s function name from mapLoaded to layersAdded to better reflect what you’re doing.
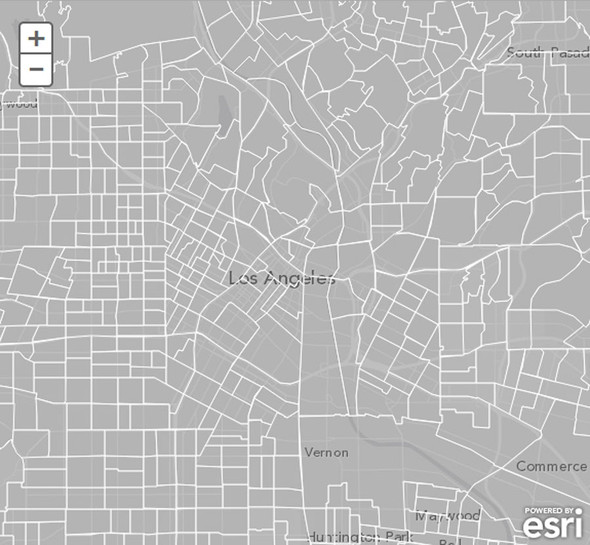
Refresh the application in the browser to see the Census Tract map service, as shown in figure 4.16.
Figure 4.16. Adding the Census Tract map service to the application
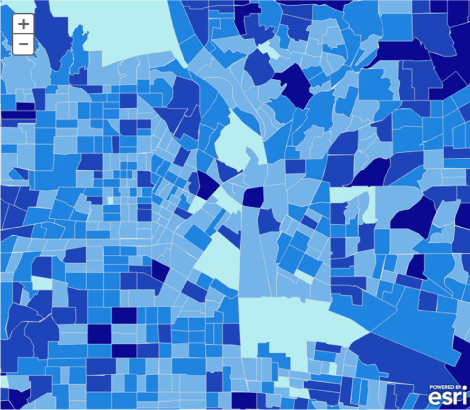
That’s absolutely beautiful, a true measure of cartographic excellence. But now you can’t see the streets or the city names on the map. Plus the color scheme of the map is designed to reflect how much of the population is employed in each census tract. That doesn’t fit into your plans for using the data, so let’s modify it.
4.4.2. Using the renderer
When working with map services in the ArcGIS API for JavaScript, you may want to change what the map service looks like. If you’re lucky, you could make a phone call to whomever made the service and request the change to be made. But maybe the look of the service is locked in because it’s used across multiple applications. No need to worry, as you have the ability to define how you want that service to look. You’re going to build a utility module that you can use to define the look of the layer in the map. The following listing shows what this module looks like.
Listing 4.9. utils/symbolUtil.js module
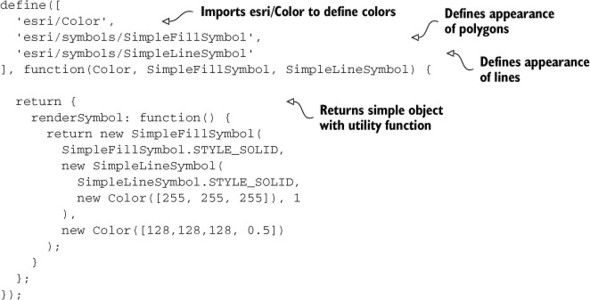
As discussed in chapters 2 and 3, the ArcGIS API for JavaScript provides a handful of modules in the esri/symbols namespace to define how features are drawn in the browser. The modules are dependent on the esri/Color module to define the colors they use. The Color module uses RGB (red, green, blue) to define colors.
Tip
To give you an idea of how RGB colors work, an RGB value of 0,0,0 is black, a value of 255,255,255 is white, and a multitude of values and combinations exist between them.
The census tracts in our service are polygons, so you define a SimpleFillSymbol that’s a solid color to fill them with. You could also make this a hatched symbol, meaning the fill would be multiple lines instead of a solid color. The second argument indicates what you want the outline of the polygon to look like. In this case, you make the outline white by setting the color to new Color([255,255,255]), and the third argument defines the color you want the polygon fill to be. You make this a light gray color with a transparency of 50%. Transparency of a color can be set by passing a fourth element in the RGB array to represent the transparency, as shown in the code: new Color([128,128,128, 0.5]).
4.4.3. Applying the renderer
After you instantiate the layer for the census tracts, you can use the utility module that helps define what the census tracts in the application should look like. Applying the utility module in the services/mapservices.js module makes sense because it’s responsible for generating layers for the application. You can see what this modification looks like in the next listing.
Listing 4.10. services/mapservices.js–modified to apply renderer
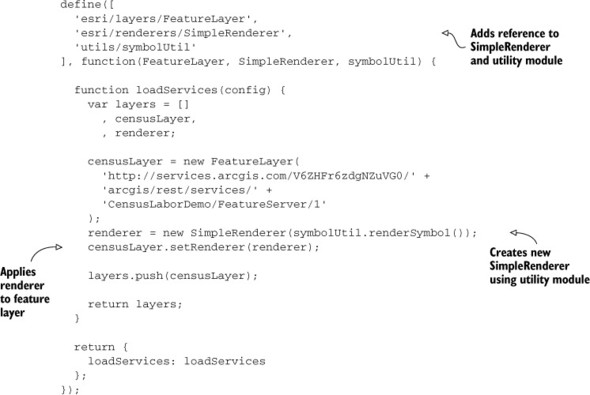
You want to change the overall appearance of the Census Tract map service so it doesn’t overpower the map in your application. You’ll use a SimpleRenderer, which will change the appearance of all items in the layer. If you wanted to change the appearance in a more complicated manner (say, by grouping the appearance of census tracts by a certain criteria), you could do that also, but that isn’t the purpose of the application.
That’s the only change you need to make to change the appearance of the census tracts in the application. You can see what the application looks like now in figure 4.17.
Figure 4.17. The application after altering the appearance of the census tracts layer
The census tracts no longer overpower the entire map in terms of the coloring scheme, and you can still see city names and streets. As you can see, it’s not difficult to alter the appearance of layers used in web mapping applications when the need arises. Feel free to experiment with the color and adjust to your liking. The next step is to get ready to start editing.
4.4.4. Setting up the editing tools
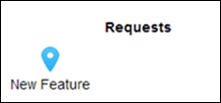
You need to build an interface that allows the user to add data to the map. Remember, this is meant to be used on a mobile device, so it would be nice if this tool was as simple to use as possible. The ArcGIS API for JavaScript does come with a neat built-in widget called the TemplatePicker, that, similar to the built-in legend Dijit discussed in chapter 3, is provided as an out-of-the-box solution. Figure 4.18 shows what the TemplatePicker might look like for your application.
Figure 4.18. Out-of-the-box ArcGIS TemplatePicker using your Request feature service
This is a great tool and something I recommend if you’re building a larger application targeted more toward users working on desktop computers. You could probably work with it, but remember, you want to focus on simple in terms of usability for the user. So to do this, you’re going to flex some of the skills you learned in section 4.3.2 about building classes with dojo/_base/declare and the custom widget you built in chapter 3 to build a simple customer editing tool.
Bootstrap CSS: It’s not cheating
I’ll be frank: I may be able to make a decent-looking map by using the cartographic skills I’ve picked up over the years, but when it comes to designing a stylish website, I’m not exactly an accomplished designer. To assist in making slick-looking tools, you’re going to use a framework that many other web developers use: Bootstrap.
Go to http://getbootstrap.com/ and download the latest version.
Extract the zip file and find the dist folder in the download.
Copy the css and fonts folders into the root of your application so that the fonts folder is at the same level as the js and css folders (app/css, app/js, app/fonts).
To reference the Bootstrap style sheet in your index.html file, enter the code as shown in the following listing.
Listing 4.11. index.html–added Bootstrap style sheet

The Bootstrap style sheet comes in handy not only as you build this application but also when you need to quickly get other applications up and running. I’ll give you one tip about using Bootstrap with the ArcGIS API for JavaScriptafter you look at figure 4.19.
Figure 4.19. The application after adding the Bootstrap style sheet
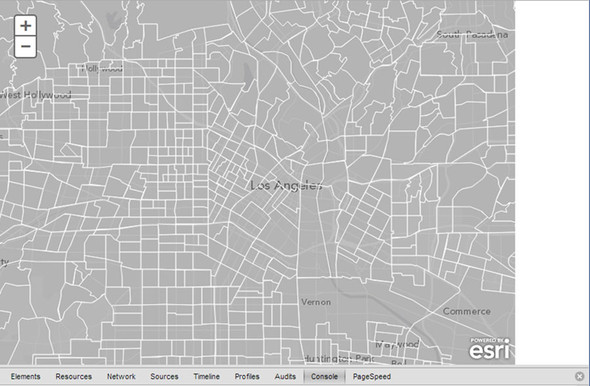
Notice anything odd here? After adding the Bootstrap style sheet, the map width is limited to a certain size. If the browser width is larger than that size, you end up with whitespace at the right side of the application. It took me a little debugging to see why this was happening. Using the browser debug tools in Chrome, I figured out that the HTML element that contains the map has a class called container, and Bootstrap has a specific styling for elements with a class name of container. You can see this in figure 4.20.
Figure 4.20. Chrome debug console to debug style sheet conflicts

To correct this, you can modify your own style sheet to override the Bootstrap style sheet. You can see how that’s done in the following snippet for css/main.css:
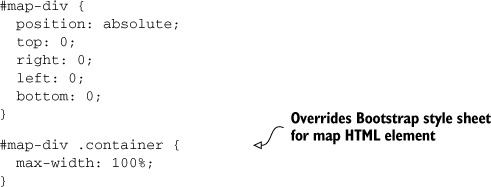
The preceding snippet says that for any HTML element that has a class container with an id of map-div, make the max-width equal to 100%. This overrides the Bootstrap style for container, but only in your map. This is a small price to pay to have access to the nice styling you get with Bootstrap when building applications.
Everyone likes buttons
When you think about the process of adding a request to the map, you need to think about the workflow. How do you guide the user in adding a request to the map? Add a request every time the user clicks or touches the map? Maybe, but that could get tough to manage if the user touches it a bunch of times when trying to pan or when cleaning a smudge off the screen. It’s tough to get much simpler than adding a button users can push and enabling them to click on the map to add a point where they’d like. So that’s what you’ll set up: adding a button. This isn’t just any button, though. This button will handle the bulk of the editing workflow, so you’re going to build this button as a custom widget. Start by creating a template HTML file that contains the HTML for your button:
<button type="button" class="btn btn-primary">Add Request</button>
This button has class names related to bootstrap styling.
Note
The code for this section is available in the chapter4 folder of the source code included with the book. See app/js/widgets/edit/editTools .tpl.html.
When working with template HTML files like this one, I prefer to add the tpl extension before the html extension. This is a preference and not a requirement. It helps me remember that I’m working with a template file.
4.4.5. Assigning an action to a button
A button that does nothing or provides no feedback is useless. You want to display feedback to the user that an action is taking place after the button click—for example, by changing the text or the color of the button. To see how this works, let’s do both.
With the template file complete, let’s build a custom editing widget that tells users to click to start editing and lets them know they’re currently editing. The following listing provides the code for this custom widget.
Listing 4.12. widgets/edit/editTools.js

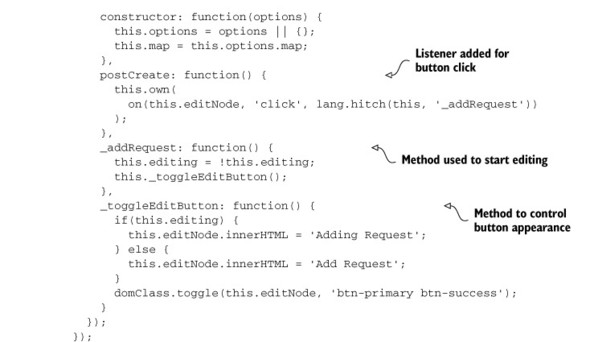
A lot is happening in the custom widget. Much of this you saw in section 4.3.2, when you used the dojo/_base/declare module to create custom classes for use in the application. This time, you’re using the declare module to create a new widget that will also extend a couple of other Dojo Dijits.
Using the WidgetBase module
I won’t get into too much detail, but the dijit/_WidgetBase module handles the lifecycle of a widget. This module has all the functions built in that you can access when a widget is created. The module indicates what happens before the HTML element is created, what happens after it’s created, and what happens when it’s removed. Don’t worry too much about this lifecycle process, but for more details, review appendix B.
Using the TemplatedMixin module
The dijit/_TemplatedMixin module is handy when creating widgets that are based on HTML elements, such as our button. This module allows you to define a template for your widget and also allows you to add references in the HTML template to methods on the widget to handle what happens when a button is clicked, for example. You initialize this widget with a set of options that include a reference to the map, but you also pass it a reference to an HTML element where you want this widget to be placed on the page. You start to do some interesting stuff in the two methods defined as _addRequest and _toggleEditButton. The underscores at the beginning of method and property names designate that those methods and properties are intended to be used internally by the class only, so you wouldn’t call editTools._addRequest(). Again, this is another subjective preference but is widely used when building Dojo applications.
Dojo Dijit lifecycle
A few of the methods you’re using in the custom widget have to do with the Dojo Dijit lifecycle as defined by dijit/_WidgetBase. You can read more details about this lifecycle in appendix B. The common methods are as follows:
- Constructor— Initializes a widget.
- postCreate— Runs when the HTML elements of the widget are built but may not be on the page yet. By using this method, you can start attaching event listeners.
- startup— Runs after the HTML elements are built and inserted into the page. If you have to do anything involving any style lookups, this is the place to do it.
- destroy or destroyRecursive— The destroy method is part of the Dijit lifecycle, but to destroy child widgets, use the destroyRecursive method. Call this method on a widget when it’s done being used and is removed from the page (for example, an order form). This cleans up the widget and removes it from memory. You don’t typically need to override destroy, as the Dijit will normally clean things up, but if you create a widget inside this module that is not a child widget, you might need to perform the cleanup manually.
Widget and template communication
In the _addRequest method you toggle whether the tool is currently editing. This will come in handy if you ever need to check whether an edit session is already occurring (hint: we’ll do that right now). Then you call the _toggleEditButton method. This method does exactly what it says it does. It checks whether the widget is currently editing and sets the text of the button to reflect what’s happening by using the this.editNode.innerHTML property. The innerHTML property of HTML elements allows you to change the values inside them, using plain text or more HTML elements. Then you can use the domClass module provided with Dojo to toggle a couple of class names on this.editNode. What domClass.toggle does is add the class name supplied if the HTML element doesn’t already have it, but if it does have it, it will remove it. In Bootstrap styling, btn-primary styles the button blue, and btn-success styles the button green.
But what is the this.editNode that we keep referring to? You can use some Dojo magic with the assistance of the dijit/_TempaltedMixin by adding attributes to your HTML template file that allow you to access HTML elements in the template from your code. You can even tell the template to call methods in the widget directly. You can see what this looks like by looking at your modified template:
<button type="button" class="btn btn-primary btn-edit"
  data-dojo-attach-point='editNode'Add Request</button>
In this template, you’ve provided an attribute called data-dojo-attach-point with a name of editNode. This enables you to reference this node in your widget by using the this.editNode property. That’s a nifty feature. You then use this.editNode to listen for click events in widgets/edit/editTools.js and call the _addRequest method. All you need to do is instantiate the module inside the application. You do that in the application controller, as shown in the next listing.
Listing 4.13. controllers/appcontroller.js–added edit widget
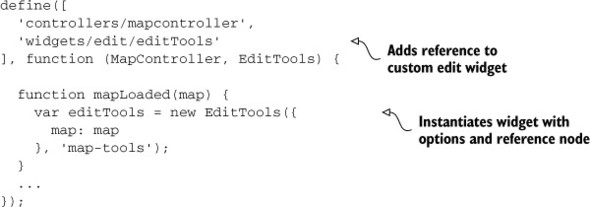
When you instantiate a new EditTools, you’ll also provide it a reference to the map so the EditTools can have access to the map when you start the edit functionality. You’ll also provide EditTools a reference to the id of an HTML element you already have in index.html called map-tools. You need to do one last thing for everything to come together: edit the main.css style sheet, as shown in the following listing.
Listing 4.14. css/main.css
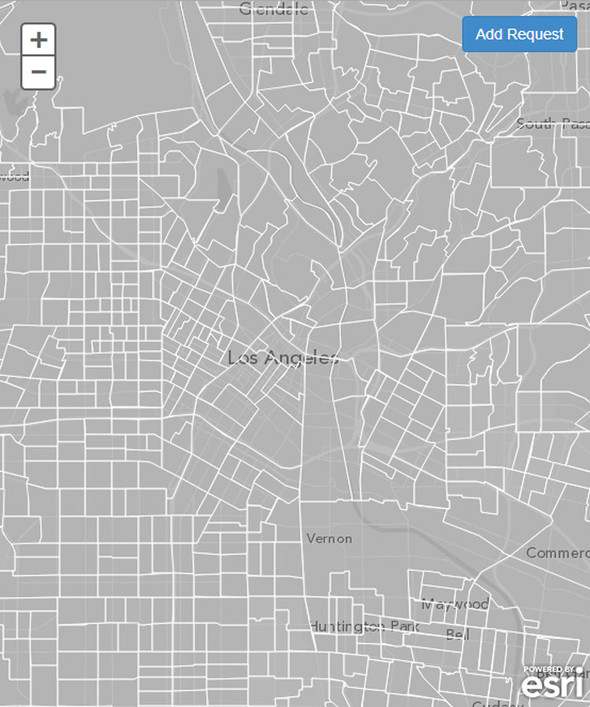
With all of this in place, if you launch the application, you should see a screen similar to what was shown in figure 4.12. If you click the Add Request button a few times, the text label and the color of the button toggle. Figure 4.21 illustrates.
Figure 4.21. The Add Request toggle button changes based on user action

This is a simple but effective method of providing feedback to the user that something is happening in the application. Users like feedback from the applications and web pages they use.
4.5. Summary
- This chapter covered quite a bit of material, and you haven’t even started writing the code to do the edits using HTML5 features yet. You now know how to acquire a free ArcGIS developer’s account and set up your own feature services. This is a valuable resource for developers because you no longer need to have access to a full ArcGIS Server installation to publish or even edit data. This will prove invaluable in the next chapter. You also set up an ArcGIS Online account and published a feature service in ArcGIS Online.
- You should be huffing and puffing by now, as you just covered a slew of material about not only ArcGIS API for JavaScript modules but also important Dojo modules used for creating classes and widgets. You used promises in your modules, dojo/_base/declare to build your modules, and dojo/_base/lang to handle JavaScript scope.
- You customized a FeatureLayer with a custom renderer, styled your map with CSS and Bootstrap, and enabled a widget and its template to communicate with each other.
- Previous chapters covered building basic samples and even building a custom widget, but this chapter went into much more detail about how to configure Dojo for your application and dived into the details of how Dojo classes and widgets are built. You didn’t get to edit data yet, but you did lay some major groundwork for yourself.
You now have a good base to finish building out the application with the required editing functionality to collect new requests, as you’ll do in chapter 5.