
Tcpdump is a command-line tool that runs on various flavors of Linux. It can be used for network traffic packet capture and analysis. It is a free tool that is distributed under the Berkeley Software Distribution (BSD) license.
Tcpdump requires the libpcap library to capture packets. Tcpdump has also been ported to Windows. In this avatar, it requires the WinPcap library, which is a port of libpcap for Windows.
Tcpdump is a great tool to learn about the traffic on your network in a more hands-on way. Though tcpdump requires more inputs from the user vis-à-vis higher analysis tools such as Wireshark, it really increases your fundamental understanding of the TCP/IP suite. Any security professional getting in the network forensics domain must understand the data in its raw form.
Tcpdump also provides the option to save the captured network traffic (packets) to a .pcap format file for future analysis.
From a learning perspective, we will use tcpdump with libpcap to grab network traffic.
Before we get started on the hands-on aspect, we will require the following prerequisites:
- A system running Linux (a VM with Linux will also do). We will be using Ubuntu on our system.
- A download of tcpdump and libpcap—both available at http://www.tcpdump.org/.
Let's get started.
Before we can get going with capturing network traffic, we need to prepare our system and ourselves by having all our tools installed and configured for use.
As a rule, tcpdump comes pre-installed on most Linux distributions; however, just for the sake of completeness, we will see how to install it, as shown in the following image:

Open the terminal and run the following command to install tcpdump:
$ apt-get install tcpdump
Before we can actually use tcpdump, we need to understand the various tcpdump commands and options.
Tcpdump comes with a large number of parameters that inform it what to do. The best source of information for all of the tcpdump command-line options is its man page.
At the terminal prompt, type the following:
$ man tcpdump
The output is as shown in the following screenshot:
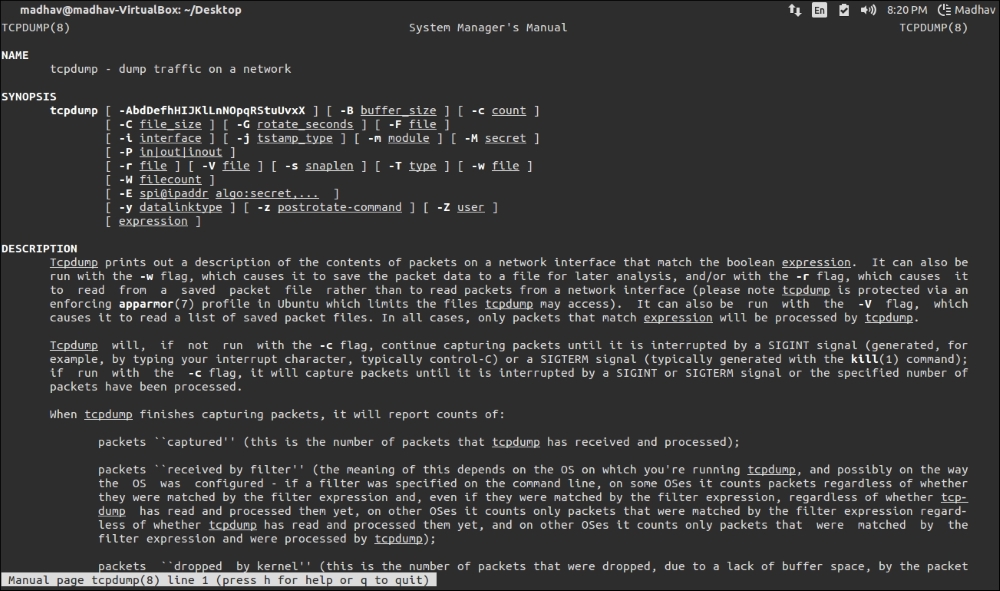
man tcpdump output
While there are a lot of options when it comes to using tcpdump, we will cover some of the important ones that are needed to capture packets.
Before we begin the exercise of capturing network traffic using tcpdump, we need to understand the various sources of network traffic that we have access to on our machine.
To do this, we need to first identify the number of available interfaces on our machine. To do this we will type the following:
$ tcpdump –D
From an output perspective, we will get a list of all the available interfaces.
This will include all Ethernet, wireless, USB and FireWire interfaces. Additionally, it will offer an option—any, a pseudo device that will include all available interfaces:

To start capturing packets (on eth0 by default), we need to type the following command:
$ tcpdump

This command will begin the capture process and keep going continuously until Ctrl + C is pressed.
All the traffic until this point on the default eth0 interface will be captured by this command.
The output will look similar to the following screenshot:

To capture packets from a different interface use the -i command-line flag. For example, the following command will capture all the packets from the eth1 interface.

To write the raw data to a file use the -w command-line flag. The following command will write the first 96 bytes of every captured packet in a file called rawdata in the present directory. This can later be used for investigation purposes, as follows:

The following screenshot depicts capturing all traffic related to a specific port (in this case port 80):

To listen to a specific port, let's say 80, we use the preceding command which captures all the packets with source or destination. To only capture packets with its source as port 80, we use src and for destination port as port 80, we use dst. Let us see the following command:

To read a trace file saved earlier using the -w command-line flag, use the -r flag in the command as shown in the following:

To capture all the packets originating from a particular source, say the host 10.0.2.15, execute the following command:

The output derived would be as follows:

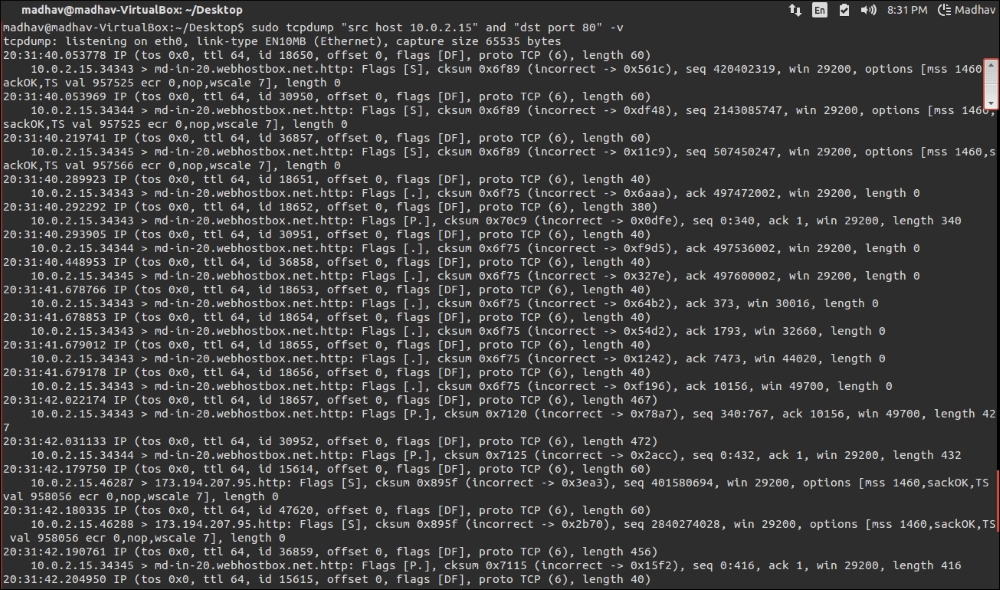
Tcpdump supports the usage of logical arguments such as AND and OR, they can be used as shown in the following; however, the argument being passed to tcpdump must be in the form of a Boolean expression. To capture all the packets originating from a particular source, say the host 10.0.2.15 and destination port 80, execute the command as shown in the following screenshot:

The output derived will be as shown in the following screenshot:
This brief tutorial on capturing traffic using tcpdump acts as a primer on the path to network forensics.